
Mobile Application Market Size 2025-2029
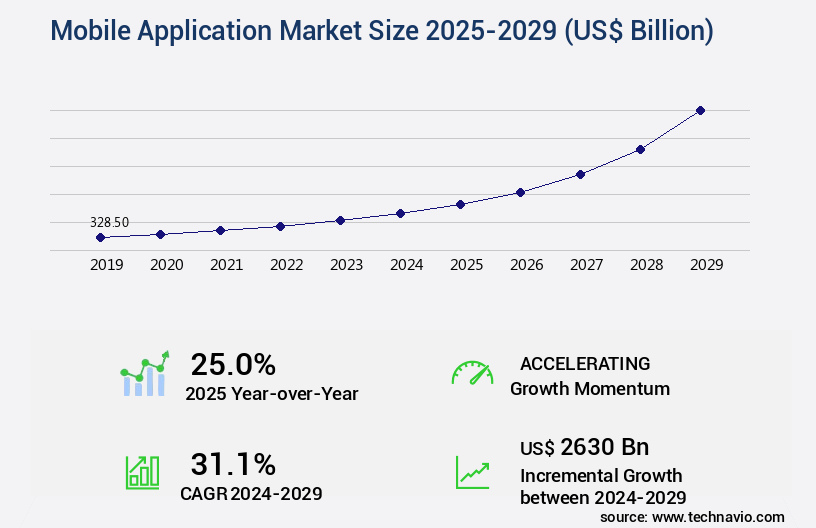
The mobile application market size is valued to increase USD 2630 billion, at a CAGR of 31.1% from 2024 to 2029. Growing penetration of smartphones will drive the mobile application market.
Major Market Trends & Insights
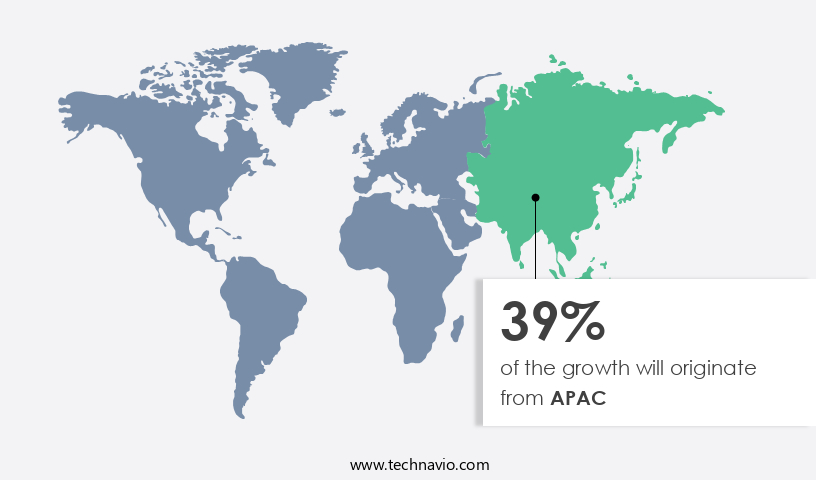
- APAC dominated the market and accounted for a 39% growth during the forecast period.
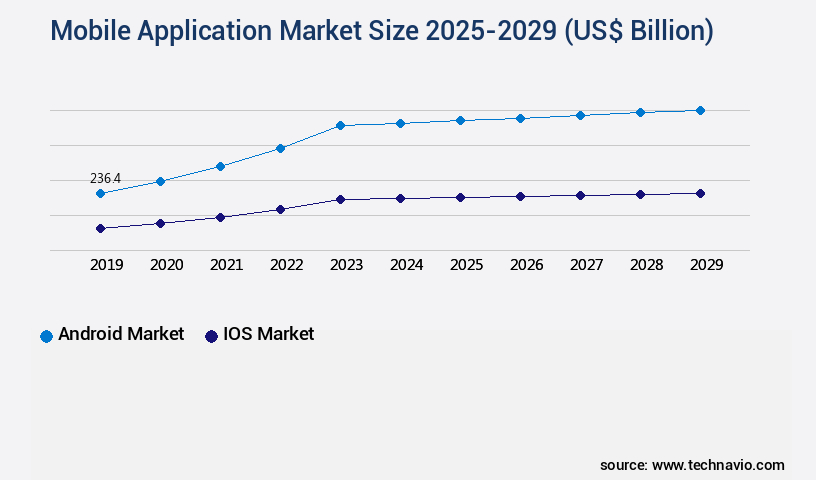
- By Platform - Android market segment was valued at USD 236.40 billion in 2023
- By Type - Gaming segment accounted for the largest market revenue share in 2023
Market Size & Forecast
- Market Opportunities: USD 978.60 billion
- Market Future Opportunities: USD 2630.00 billion
- CAGR from 2024 to 2029 : 31.1%
Market Summary
- The market represents a dynamic and continually evolving landscape, driven by the increasing penetration of smartphones and the growing number of mobile apps for IoT devices. Core technologies, such as artificial intelligence and machine learning, are revolutionizing application development and usage, while service types like mobile app testing and analytics are becoming essential components of the mobile app ecosystem. The cost associated with mobile app development and operation continues to be a significant challenge for businesses, yet the opportunities for innovation and engagement are immense.
- According to recent estimates, over 51% of all internet traffic comes from mobile devices, underscoring the importance of a strong mobile application presence for businesses seeking to reach and engage their customers effectively.
What will be the Size of the Mobile Application Market during the forecast period?
Get Key Insights on Market Forecast (PDF) Request Free Sample
How is the Mobile Application Market Segmented?
The mobile application industry research report provides comprehensive data (region-wise segment analysis), with forecasts and estimates in "USD billion" for the period 2025-2029, as well as historical data from 2019-2023 for the following segments.
- Platform
- Android market
- iOS market
- Others
- Type
- Gaming
- Music and entertainment
- Health and fitness
- Social networking
- Others
- Geography
- North America
- US
- Canada
- Europe
- France
- Germany
- UK
- Middle East and Africa
- UAE
- APAC
- China
- India
- Japan
- South America
- Brazil
- Rest of World (ROW)
- North America
By Platform Insights
The android market segment is estimated to witness significant growth during the forecast period.
In the dynamic and evolving market, location-based services have gained significant traction, enabling users to access customized content based on their geographical location. User authentication systems ensure secure access to applications, while user interface design and software testing methodologies ensure seamless user experiences. Database management systems and mobile analytics platforms facilitate data-driven decision-making, while backend infrastructure and application performance management optimize application functionality. The market embraces various development methodologies, including the waterfall development method, cloud computing services, and agile development process. Payment gateway integration and in-app purchase systems facilitate monetization strategies. Software development kits, application performance monitoring, and app development lifecycle tools streamline the development process.
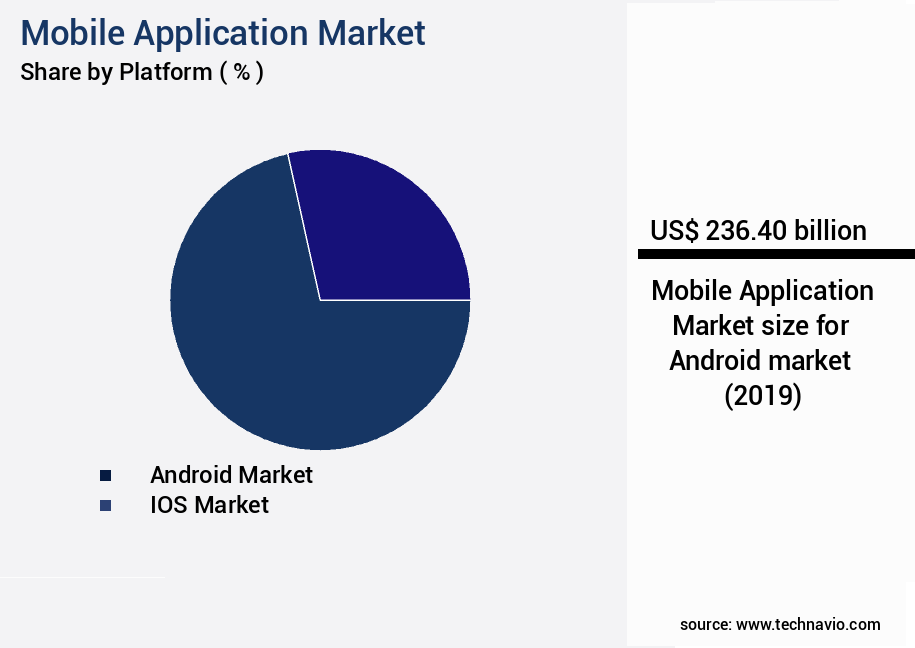
The Android market segment was valued at USD 236.40 billion in 2019 and showed a gradual increase during the forecast period.
User interaction design and mobile UI design focus on enhancing user experience, while mobile app monetization strategies cater to diverse revenue models. Hybrid mobile development, responsive web design, frontend development, and data encryption methods ensure versatility and security. Software deployment strategies, cross-platform development, version control systems, and code repository management enable efficient development and maintenance. Scalable architecture, native mobile development, push notification services, and application security testing ensure robustness and reliability. As of 2023, approximately 60% of Android users access the Google Play Store, with adoption growing by 18%. Future industry growth is expected to reach 25%, driven by the increasing demand for mobile applications across various sectors.
The Android operating system, with its vast user base and versatile development tools, continues to dominate the market.
Regional Analysis
APAC is estimated to contribute 39% to the growth of the global market during the forecast period. Technavio's analysts have elaborately explained the regional trends and drivers that shape the market during the forecast period.
See How Mobile Application Market Demand is Rising in APAC Request Free Sample
The Asia-Pacific (APAC) region dominated the market in 2023, driven by a substantial mobile phone user base. This expansion in APAC's mobile phone customer base can be attributed to the region's growing consumer disposable incomes. Unique mobile subscribers, defined as individual customers with one or multiple mobile connections, offer insight into this market. In 2023, APAC boasted over 2.11 billion unique mobile subscribers.
Market Dynamics
Our researchers analyzed the data with 2024 as the base year, along with the key drivers, trends, and challenges. A holistic analysis of drivers will help companies refine their marketing strategies to gain a competitive advantage.
The market is a dynamic and evolving landscape, characterized by continuous innovation and growth. Mobile app development cost estimation is a critical factor for businesses looking to enter this market, as effective user interface design principles, implementing secure payment gateways, integrating location-based features, managing mobile app security vulnerabilities, optimizing performance, improving user engagement, and ensuring compliance with data privacy regulations are all essential components of successful mobile apps. In terms of user experience, designing scalable and maintainable mobile apps is crucial for long-term success. Measuring user acquisition cost and analyzing user behavior data are essential for optimizing marketing strategies and enhancing user experience.
Choosing the right mobile app development platform is another key consideration, as it can significantly impact development time, cost, and performance. Robust data backup and recovery, testing compatibility on various devices, deploying and maintaining apps in the cloud, integrating social media features, and increasing downloads through strategic initiatives are all essential aspects of mobile app development. According to market intelligence, more than 60% of new app developments focus on enhancing user experience, while only 30% prioritize adding new features. This indicates a clear trend towards prioritizing user-centric design and optimization. Furthermore, ensuring compliance with data privacy regulations, such as GDPR and CCPA, is a significant challenge for businesses operating in the mobile app market.
A recent study revealed that over 80% of apps fail basic security tests, highlighting the importance of implementing robust security measures. The market is a highly competitive landscape, with businesses continually striving to optimize their apps for user experience, performance, and security. Adoption rates for mobile apps are nearly double those for desktop applications, making it a lucrative and exciting market for businesses of all sizes.
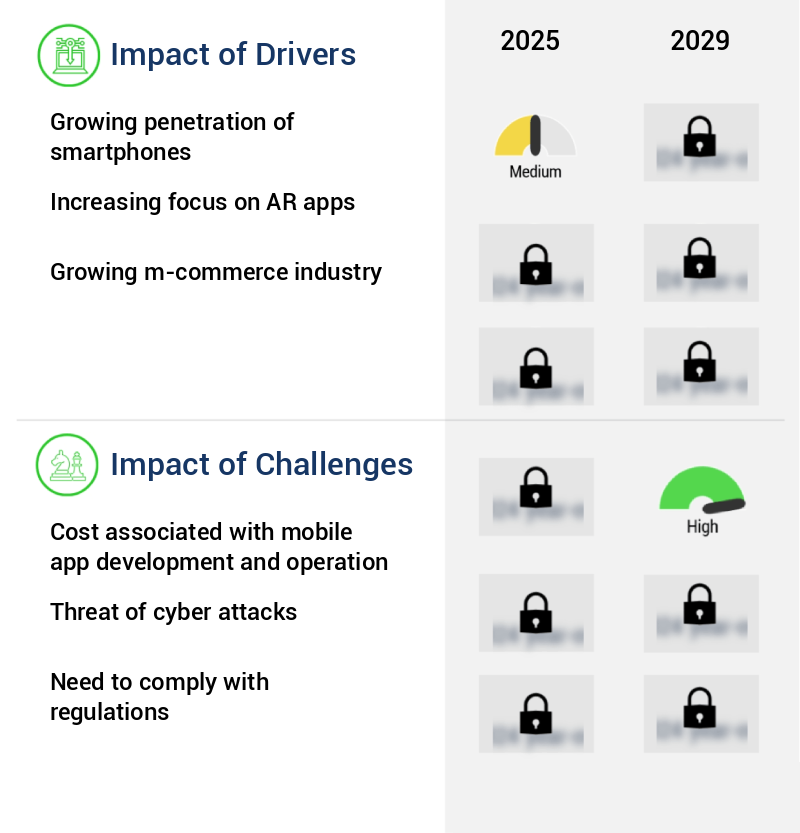
What are the key market drivers leading to the rise in the adoption of Mobile Application Industry?
- The increasing prevalence of smartphones serves as the primary catalyst for market growth.
- The global smartphone market continues to expand, driven largely by the increasing popularity of affordable devices. Specifically, low-priced smartphones, priced under USD 200, have experienced significant demand. This trend is particularly prominent in developing regions such as Asia Pacific (APAC), where countries like India, Vietnam, the Philippines, Sri Lanka, and Pakistan have shown a notable preference for budget smartphones. Europe also exhibits a growing trend in the sales of affordable devices, with Spain and Greece being notable markets. Popular models within this price range include Nokia 7.1 and Nokia 6.1.
- The potential for growth in high-population, economically developing countries like China and India is substantial, making them attractive markets for low-cost smartphones. This shift towards affordable devices underscores the evolving nature of the smartphone market and its applications across various sectors.
What are the market trends shaping the Mobile Application Industry?
- The increasing prevalence of mobile applications for Internet of Things (IoT) devices represents a significant market trend. A growing number of mobile apps cater to IoT devices is a notable market trend.
- IoT, or the Internet of Things, represents the interconnected network of physical devices, objects, and machines, facilitated by software and sensors. The market's expansion is fueled by the versatility, convenience, and mobility features of IoT devices. The proliferation of IoT is closely linked to the integration of these devices with smartphones through mobile applications. In 2023, smartphone shipments reached a significant milestone of 1.14 billion units, marking a slight decline of 4% compared to the previous year. This increase in smartphones can be attributed to their compatibility with a multitude of IoT devices, such as smartwatches and augmented reality eyeglasses, via mobile applications.
- The IoT landscape continues to evolve, with applications spanning various sectors, including healthcare, manufacturing, transportation, and agriculture. The integration of IoT devices with smartphones underscores the convenience and accessibility of this technology, making it an indispensable part of modern business and daily life.
What challenges does the Mobile Application Industry face during its growth?
- The escalating costs related to mobile app development and maintenance represent a significant challenge that can hinder the growth of the industry.
- Mobile apps have gained significant traction in today's digital landscape, enabling users to perform various activities with ease. While the development of these apps is a crucial step, the subsequent support activities incur higher costs. Functional services are essential for mobile apps to operate efficiently, representing a substantial portion of these costs. The need for administrative and maintenance support escalates as apps progress through their operational lifecycle. Infrastructure services, including hosting and security, are also vital components of mobile app support. According to recent studies, functional services account for approximately 30% of the total mobile app development costs.
- This percentage highlights the importance of understanding the costs associated with these services to effectively manage project budgets. Moreover, the competitive landscape of mobile apps necessitates continuous updates and improvements. These enhancements can lead to increased functional service costs. For instance, integrating new features or addressing user feedback may require additional resources and time, ultimately increasing expenses. Mobile apps have become indispensable tools for businesses and individuals alike. While development costs are a significant consideration, the ongoing expenses related to functional services should not be overlooked. Understanding the various components of mobile app support costs and their respective percentages can help stakeholders make informed decisions and allocate resources effectively.
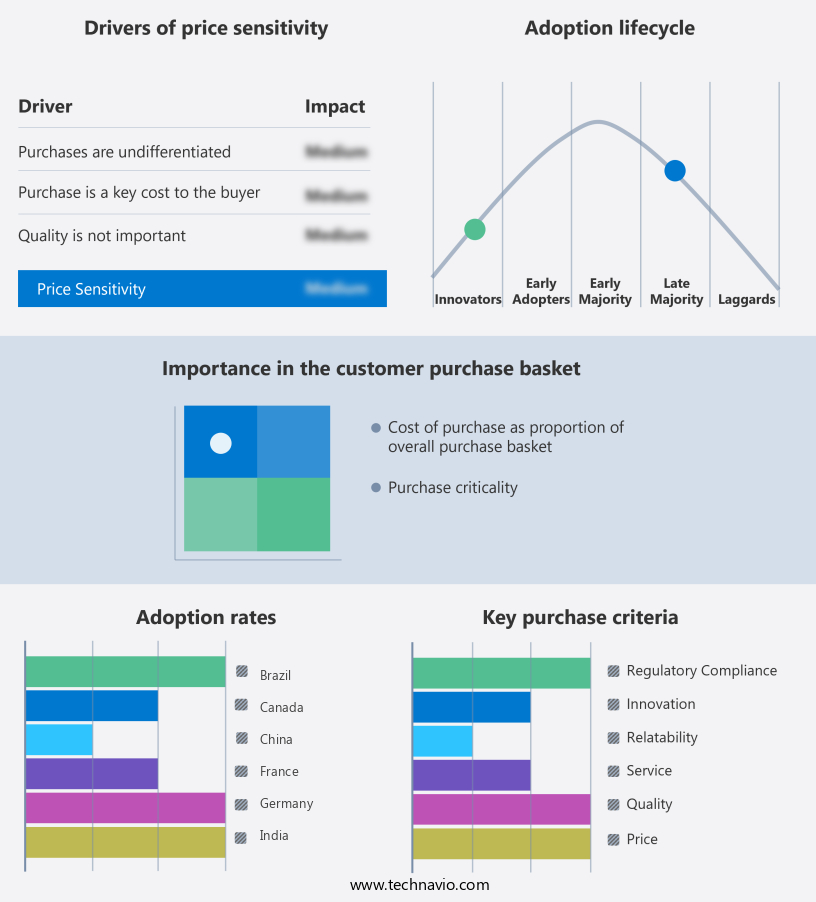
Exclusive Technavio Analysis on Customer Landscape
The mobile application market forecasting report includes the adoption lifecycle of the market, covering from the innovator's stage to the laggard's stage. It focuses on adoption rates in different regions based on penetration. Furthermore, the mobile application market report also includes key purchase criteria and drivers of price sensitivity to help companies evaluate and develop their market growth analysis strategies.
Customer Landscape of Mobile Application Industry
Competitive Landscape
Companies are implementing various strategies, such as strategic alliances, mobile application market forecast, partnerships, mergers and acquisitions, geographical expansion, and product/service launches, to enhance their presence in the industry.
Amazon.com Inc. - This company provides a range of mobile applications, including Amazon Prime, Amazon Kindle, and Amazon Pay.
The industry research and growth report includes detailed analyses of the competitive landscape of the market and information about key companies, including:
- Amazon.com Inc.
- ANI Technologies Pvt. Ltd.
- ASICS Corp.
- Canva Pty Ltd.
- Electronic Arts Inc.
- Google LLC
- Grab Holdings Ltd.
- Meta Platforms Inc.
- Microsoft Corp.
- Mozilla Corp.
- Netflix Inc.
- Niantic Inc.
- One97 Communications Ltd.
- Spotify Technology SA
- The Gap Inc.
- Uber Technologies Inc.
- Ubisoft Entertainment SA
- Walmart Inc.
- Xiaomi Inc.
- Zomato Ltd.
Qualitative and quantitative analysis of companies has been conducted to help clients understand the wider business environment as well as the strengths and weaknesses of key industry players. Data is qualitatively analyzed to categorize companies as pure play, category-focused, industry-focused, and diversified; it is quantitatively analyzed to categorize companies as dominant, leading, strong, tentative, and weak.
Recent Development and News in Mobile Application Market
- In January 2024, Apple announced the launch of its long-awaited augmented reality (AR) headset, the Apple Glass, during its product event. The device, which integrates mobile applications, is designed for a seamless blend of digital and physical experiences (Apple Inc. Press release, 2024).
- In March 2024, Google and Microsoft formed a strategic partnership to expand their cloud services offerings in the market. The collaboration aimed to enhance the development, deployment, and management of mobile applications using Google Cloud's AI and machine learning capabilities and Microsoft's Azure platform (Google and Microsoft press releases, 2024).
- In May 2024, Tencent Holdings, the Chinese tech giant, acquired a significant stake in Indian mobile gaming company, Nazara Technologies for approximately USD 100 million. The deal aimed to strengthen Tencent's presence in the Indian mobile gaming market and expand its user base (Reuters, 2024).
- In January 2025, Apple became the first market player to reach a valuation of USD 3 trillion, surpassing the market capitalization of major tech companies like Microsoft and Amazon. The milestone was attributed to the growing popularity of its mobile applications and services, including the App Store and Apple Arcade (Bloomberg, 2025).
Dive into Technavio's robust research methodology, blending expert interviews, extensive data synthesis, and validated models for unparalleled Mobile Application Market insights. See full methodology.
|
Market Scope |
|
|
Report Coverage |
Details |
|
Page number |
213 |
|
Base year |
2024 |
|
Historic period |
2019-2023 |
|
Forecast period |
2025-2029 |
|
Growth momentum & CAGR |
Accelerate at a CAGR of 31.1% |
|
Market growth 2025-2029 |
USD 2630 billion |
|
Market structure |
Fragmented |
|
YoY growth 2024-2025(%) |
25.0 |
|
Key countries |
US, China, Japan, India, UK, Canada, Germany, Brazil, France, and UAE |
|
Competitive landscape |
Leading Companies, Market Positioning of Companies, Competitive Strategies, and Industry Risks |
Research Analyst Overview
- The market continues to evolve, with location-based services and user authentication systems becoming increasingly essential components. User interface design plays a pivotal role in user engagement, with mobile UI design and responsive web design shaping the user experience. Software testing methodologies, including waterfall development and agile processes, ensure application quality. Backend infrastructure, cloud computing services, and application performance management are crucial for maintaining optimal performance and reliability. Payment gateway integration and in-app purchase systems enable monetization, while software development kits and API integration streamline development. Application performance monitoring and application programming interfaces are integral to the app development lifecycle, with user interaction design and user experience testing ensuring user satisfaction.
- Hybrid mobile development and cross-platform development offer versatility, while scalable architecture and native mobile development cater to growing user bases. Security is a top priority, with data encryption methods, application security testing, and mobile security protocols safeguarding sensitive information. Code repository management and version control systems facilitate efficient development and collaboration. Push notification services keep users engaged, while application performance monitoring and software deployment strategies ensure seamless updates. The market's dynamics continue to unfold, with ongoing innovation in user authentication, UI design, and monetization strategies.
What are the Key Data Covered in this Mobile Application Market Research and Growth Report?
-
What is the expected growth of the Mobile Application Market between 2025 and 2029?
-
USD 2630 billion, at a CAGR of 31.1%
-
-
What segmentation does the market report cover?
-
The report segmented by Platform (Android market, iOS market, and Others), Type (Gaming, Music and entertainment, Health and fitness, Social networking, and Others), and Geography (APAC, North America, Europe, South America, and Middle East and Africa)
-
-
Which regions are analyzed in the report?
-
APAC, North America, Europe, South America, and Middle East and Africa
-
-
What are the key growth drivers and market challenges?
-
Growing penetration of smartphones, Cost associated with mobile app development and operation
-
-
Who are the major players in the Mobile Application Market?
-
Key Companies Amazon.com Inc., ANI Technologies Pvt. Ltd., ASICS Corp., Canva Pty Ltd., Electronic Arts Inc., Google LLC, Grab Holdings Ltd., Meta Platforms Inc., Microsoft Corp., Mozilla Corp., Netflix Inc., Niantic Inc., One97 Communications Ltd., Spotify Technology SA, The Gap Inc., Uber Technologies Inc., Ubisoft Entertainment SA, Walmart Inc., Xiaomi Inc., and Zomato Ltd.
-
Market Research Insights
- The market continues to expand, with over 2.7 million apps available for download as of 2021, representing a 10% increase from the previous year. This growth is driven by the increasing use of open source frameworks and DevOps methodology, enabling faster development and deployment of applications. Third-party libraries and continuous delivery further streamline the process, allowing businesses to integrate e-commerce functionality, ensure mobile device compatibility, and utilize data visualization tools. Applications must also prioritize serverless computing for scalability, user feedback analysis for performance improvement, and data privacy compliance for customer trust. Performance benchmark testing and security vulnerability assessment are crucial components of the development process, while code optimization techniques and customer retention strategies ensure long-term success.
- Real-time data processing and user behavior tracking provide valuable insights, and application scalability is essential for handling increasing user demand. In-app marketing strategies and database schema design further enhance user engagement and overall performance. Ultimately, the market remains a dynamic and evolving landscape, requiring continuous innovation and adaptation to meet the demands of consumers and businesses alike.
We can help! Our analysts can customize this mobile application market research report to meet your requirements.
 RIA -
RIA - 
