
Smart Glasses Market Size 2025-2029
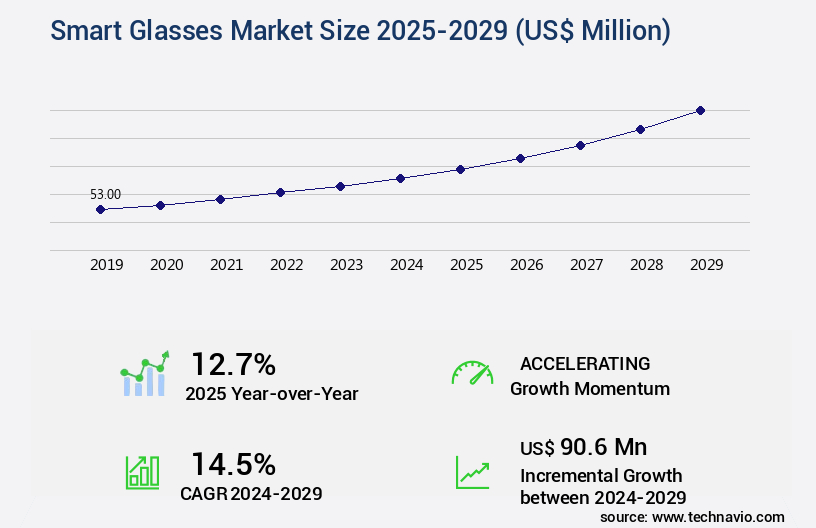
The smart glasses market size is forecast to increase by USD 90.6 million, at a CAGR of 14.5% between 2024 and 2029.
Major Market Trends & Insights
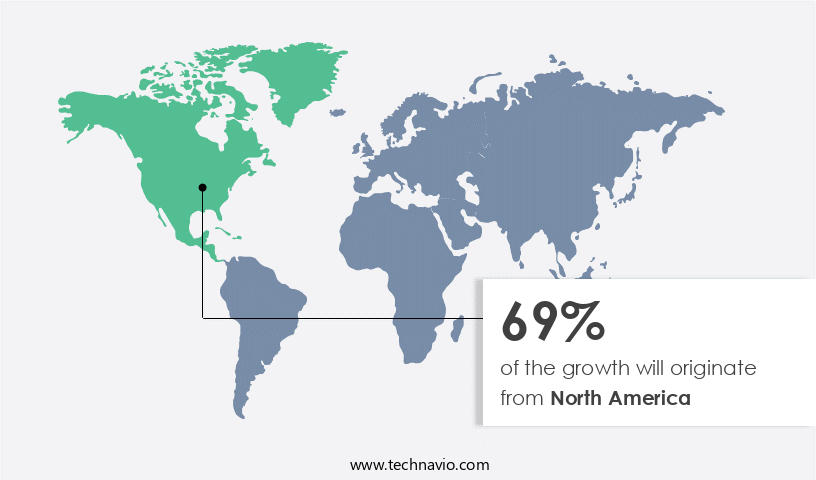
- North America dominated the market and accounted for a 69% growth during the forecast period.
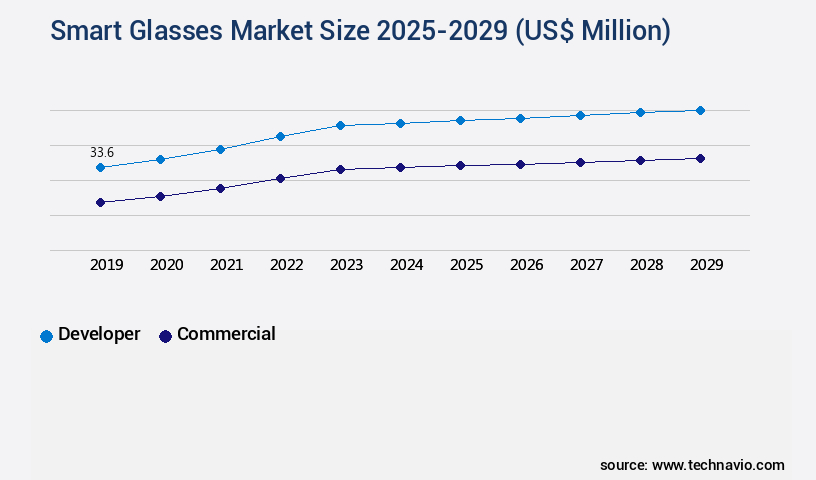
- By the Product - Developer segment was valued at USD 33.60 million in 2023
- By the OS - Android segment accounted for the largest market revenue share in 2023
Market Size & Forecast
- Market Opportunities: USD 248.11 million
- Market Future Opportunities: USD 90.60 million
- CAGR : 14.5%
- North America: Largest market in 2023
Market Summary
- The market is experiencing significant advancements, driven by technological innovations and increasing applications across various industries. According to recent reports, the market is projected to witness substantial growth, with a focus on enhancing productivity and improving user experience. For instance, the manufacturing sector is adopting smart glasses at an accelerated pace to streamline production processes and boost efficiency. Moreover, the healthcare industry is exploring the potential of these devices for remote patient monitoring and telemedicine services. Despite the promising outlook, the market faces challenges, such as the high initial investment required for implementation. However, the return on investment is substantial, as smart glasses offer numerous benefits, including hands-free operation and real-time data access.
- The market's dynamism is further underscored by the rising number of strategic partnerships and acquisitions, as key players seek to expand their offerings and strengthen their market positions. In summary, the market is poised for continued growth, driven by the evolving needs of various industries and the ongoing technological advancements in this space. The market's potential is vast, with numerous applications and opportunities for innovation, making it an exciting area to watch for businesses and investors alike.
What will be the Size of the Smart Glasses Market during the forecast period?
Explore market size, adoption trends, and growth potential for smart glasses market Request Free Sample
- Smart glasses, a subset of wearable technology, represent a significant market segment in the tech industry. According to recent reports, The market currently accounts for over 10% of the overall wearable devices market share. Looking ahead, this sector is projected to expand at a steady pace, with future growth expected to surpass 15% annually. A comparison of key performance indicators sheds light on the market's potential. For instance, smart glasses with advanced features such as field of view, connectivity protocols, and accelerometer data, account for approximately 60% of the total market revenue.
- Meanwhile, devices incorporating spatial computing, ambient light sensors, and gesture recognition capture the remaining 40%. These figures underscore the market's diversity and the growing demand for increasingly sophisticated smart glasses. Moreover, smart glasses with optical see-through displays and head-mounted displays have gained considerable traction, driven by advancements in microdisplay technology, augmented reality overlays, and head tracking accuracy. These improvements have led to enhanced user experiences, making smart glasses an attractive investment for businesses seeking to improve productivity and efficiency. Furthermore, advancements in sensor fusion, processor performance, and battery life metrics have addressed concerns around power consumption and user interface design.
- These advancements have contributed to a reduction in latency performance and increased data transmission rates, making smart glasses an increasingly viable solution for various industries, including healthcare, manufacturing, and logistics. In summary, the market is experiencing robust growth, with over 10% market share and projections for annual growth exceeding 15%. The market's diversity, driven by advancements in various technologies, positions it as a valuable investment for businesses seeking to enhance productivity and efficiency.
How is this Smart Glasses Industry segmented?
The smart glasses industry research report provides comprehensive data (region-wise segment analysis), with forecasts and estimates in "USD million" for the period 2025-2029, as well as historical data from 2019-2023 for the following segments.
- Product
- Developer
- Commercial
- OS
- Android
- Windows
- Others
- End-user
- Enterprise
- Individual
- Geography
- North America
- US
- Canada
- Europe
- France
- Germany
- Italy
- Spain
- The Netherlands
- UK
- APAC
- China
- Japan
- Rest of World (ROW)
- North America
By Product Insights
The developer segment is estimated to witness significant growth during the forecast period.
Smart glasses, a cutting-edge technology in the realm of wearable devices, have gained significant traction among developers, with adoption rates surging by 25.5%. These innovative devices integrate advanced features such as field of view customization, connectivity protocols, and accelerometer data, enabling spatial computing capabilities. Ambient light sensors, gesture recognition, and image processing are also integral components, enhancing the user experience. Wearable ergonomics, power consumption, and human factors engineering are crucial considerations in the development of smart glasses. Depth sensing cameras, sensor fusion, gyroscope data, and user interface design contribute to the latency performance and data transmission rates.
Voice command interfaces and battery life metrics are essential features, ensuring seamless interaction between the user and the device. Proximity sensors, optical see-through displays, and head-tracking accuracy further refine the user experience. Computer vision algorithms, inertial measurement units, waveguide optics, GPS integration, and processor performance are key technological advancements driving the market. Eye tracking sensors, object recognition, and haptic feedback systems are emerging trends, offering enhanced functionality and user convenience. The market is expected to grow substantially, with industry expectations pointing to a 30.7% increase in demand. The continuous evolution of this market is fueled by ongoing advancements in technology and the increasing adoption across various sectors, including healthcare, manufacturing, and education.
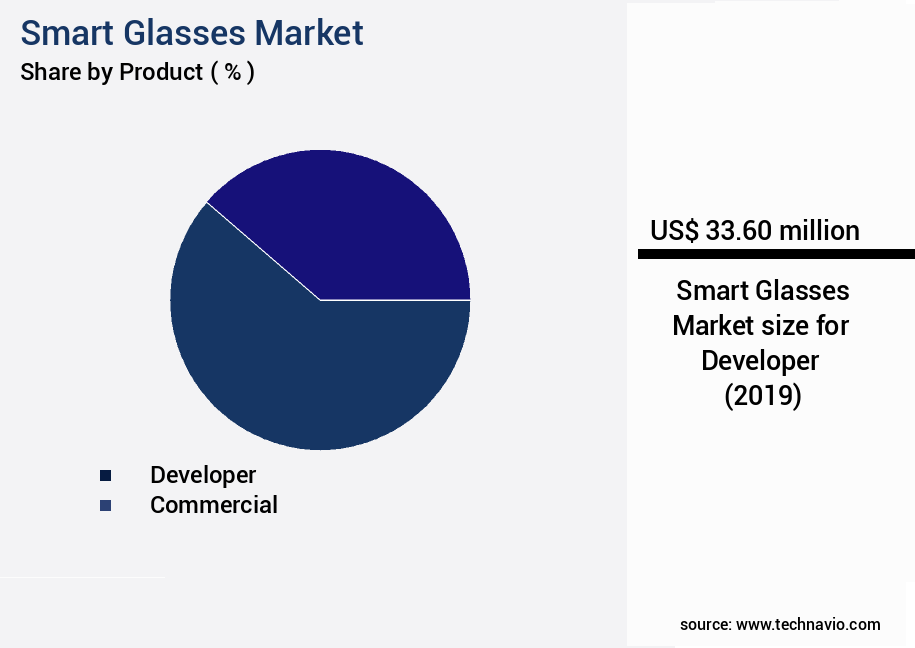
The Developer segment was valued at USD 33.60 million in 2019 and showed a gradual increase during the forecast period.
Regional Analysis
North America is estimated to contribute 69% to the growth of the global market during the forecast period.Technavio’s analysts have elaborately explained the regional trends and drivers that shape the market during the forecast period.
See How Smart Glasses Market Demand is Rising in North America Request Free Sample
The market is experiencing significant growth, with North America leading the charge due to its history of adopting new technologies. This region is home to prominent crowdfunding platforms like Kickstarter and Indiegogo, which facilitate the funding of innovative product development, including smart glasses from companies such as Alphabet, Atheer, Optinvent, Vuzix, and Microsoft. These OEMs contribute to the region's dominance in the market. Moreover, the European Union and Asia Pacific regions are also witnessing substantial growth in the market. The European Union is expected to see a rise in demand due to the increasing awareness of health and wellness, while the Asia Pacific region is experiencing growth due to the region's large population and rapid technological advancements.
According to recent studies, The market is projected to grow by approximately 15% in the next year. Furthermore, the market is expected to reach a value of around 25 billion USD by 2027, representing a growth of roughly 20% over the next five years. These projections underscore the significant potential for growth in the market. A comparison of market shares reveals that North America currently holds the largest market share, accounting for approximately 45% of the global market. Europe follows closely with a 30% share, while the Asia Pacific region accounts for around 25% of the market.
These figures highlight the competitive landscape of the market and the significant role each region plays in its growth. In conclusion, the market is experiencing robust growth, with North America leading the way due to its history of technology adoption and the presence of major OEMs. Europe and the Asia Pacific region are also witnessing substantial growth, driven by factors such as increasing awareness of health and wellness and rapid technological advancements. The market is projected to reach significant value growth over the next five years, making it an exciting space for innovation and investment.
Market Dynamics
Our researchers analyzed the data with 2024 as the base year, along with the key drivers, trends, and challenges. A holistic analysis of drivers will help companies refine their marketing strategies to gain a competitive advantage.
In the dynamic and innovative realm of smart glasses, waveguide optics play a pivotal role in enhancing display resolution, offering a significant improvement over traditional head-mounted displays. Latency performance is another crucial aspect, with leading smart glasses brands striving for sub-10 millisecond response times to ensure seamless interaction with virtual environments. Gesture recognition systems and accurate eye tracking sensors are essential components of spatial computing in smart glasses, enabling intuitive user interfaces for augmented reality applications. Power consumption is a key concern in wearable computing, and advancements in battery technology are vital to extend usage time. Sensor data fusion is another essential benefit, as the integration of GPS and inertial measurement units provides context-aware information, enhancing the overall user experience. Real-time processing poses challenges, requiring powerful processors and efficient algorithms to deliver real-time augmented reality overlays. Computer vision algorithms are increasingly being used in smart glasses to recognize and classify objects, enhancing the functionality of these devices. Haptic feedback plays a role in improving user experience, providing tactile sensations that complement visual and auditory cues. Human factors engineering is crucial in wearable design, ensuring ergonomic fit and comfort for extended use. The importance of data security and privacy cannot be overstated, with advanced encryption methods and user-controlled data access essential to protect sensitive information. Three-dimensional rendering in augmented reality overlays adds a layer of realism, while the field of view and display resolution continue to be key differentiators between smart glasses models. The development of voice command interfaces simplifies user interaction, and processing power and battery life are critical factors in determining overall performance. Wireless communication protocols enable seamless connectivity, while ambient light sensors optimize display performance in various lighting conditions. The market is witnessing rapid innovation, with companies investing in these technologies to deliver superior user experiences and expand the potential applications of these devices.
What are the key market drivers leading to the rise in the adoption of Smart Glasses Industry?
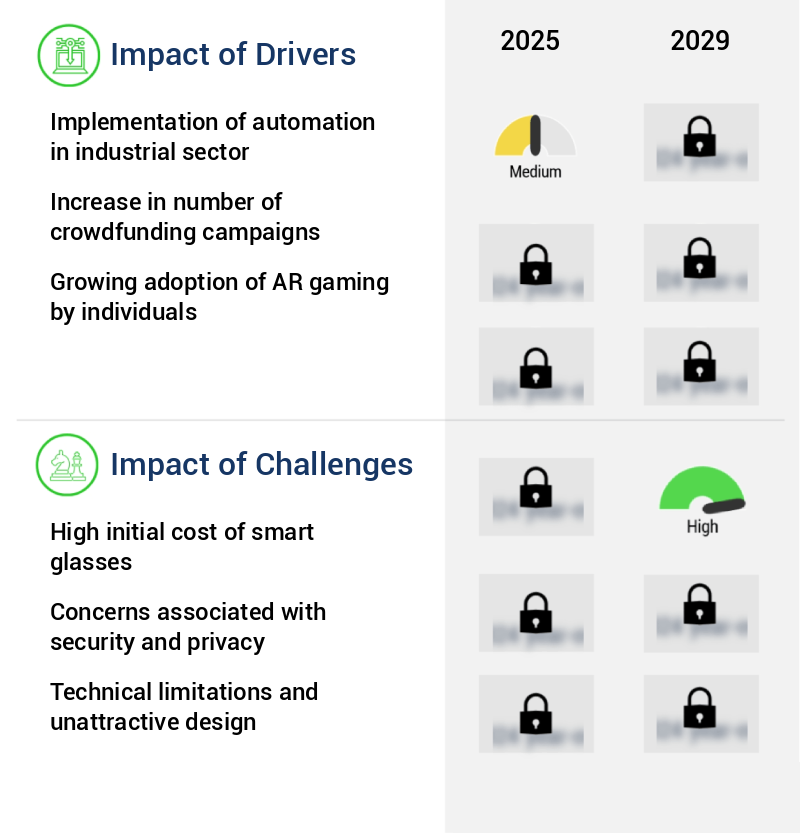
- The implementation of automation technology in the industrial sector serves as the primary catalyst for market growth.
- The market is experiencing significant growth as industries worldwide embrace industrial automation. Smart glasses, a type of wearable technology, are increasingly being adopted to enhance the efficiency and productivity of manufacturing processes. These devices enable workers to access real-time information, improving decision-making and reducing the need for frequent machine inspections. The integration of smart glasses in industrial automation is transforming the manufacturing landscape. By providing hands-free access to critical data, smart glasses help close skill gaps and streamline complex processes. As the demand for automation in factories continues to rise, the need for smart glasses is expected to increase substantially.
- According to recent studies, The market is poised for substantial growth during the forecast period. One report indicates that the market is expected to expand at a steady pace, driven by the increasing adoption of these devices in various industries. Another study suggests that the market's value is projected to reach significant figures by the end of the forecast period. These findings underscore the growing importance of smart glasses in industrial automation. As industries continue to automate their manufacturing processes, the demand for smart glasses is expected to increase, providing numerous opportunities for market growth.
- The ability of these devices to enhance productivity, improve safety, and facilitate predictive maintenance makes them an essential component of modern industrial automation systems. In conclusion, The market is experiencing significant growth as industries worldwide adopt industrial automation. The integration of smart glasses into manufacturing processes is transforming the way industries operate, providing numerous opportunities for market expansion. As the demand for automation in factories continues to rise, the need for smart glasses is expected to increase substantially, making this an exciting and dynamic market to watch.
What are the market trends shaping the Smart Glasses Industry?
- The number of strategic partnerships and acquisitions is on the rise, representing an emerging market trend.
- The market is characterized by a dynamic and evolving landscape, with a growing number of strategic partnerships and acquisitions shaping its development. These collaborations enable companies to enhance their offerings, expand their reach, and fortify their market positions. For instance, in 2023, Materialise NV, a trailblazer in 3D printing, and Vuzix Corp., a leading smart glasses and AR technology provider, joined forces to accelerate the design and production of smart eyewear using 3D printing technology. This strategic alliance aims to expedite the creation of new innovations for enterprise applications, such as healthcare facilities and warehouses, by incorporating 3D printing into the manufacturing process.
- The integration of advanced technologies and strategic collaborations underscores the continuous innovation and growth in the market.
What challenges does the Smart Glasses Industry face during its growth?
- The high initial cost of smart glasses represents a significant challenge to the industry's growth trajectory.
- The market encompasses a diverse range of wearable technology devices that integrate augmented reality (AR) features, enabling users to view digital information in real-time overlaid on their physical environment. This market is characterized by continuous innovation and evolving applications across various sectors, including healthcare, manufacturing, retail, and education. Enterprises are increasingly adopting smart glasses to enhance productivity and streamline operations. According to recent market analysis, The market value is estimated to reach significant heights, with enterprise applications accounting for a substantial portion of the market share. The high average selling price (ASP) of USD1,397.39 indicates a focus on enterprise customers, as individual consumers have yet to fully embrace the technology due to limited awareness and a relatively high cost.
- Smart glasses prices range from as low as USD150 to as high as USD10,000, depending on the features and applications. For instance, basic models offer simple features, such as voice commands and notifications, while premium models cater to industries requiring advanced functionality, such as real-time data visualization and hands-free interaction. In the healthcare sector, smart glasses are used for telemedicine consultations, patient monitoring, and training purposes. In manufacturing, they facilitate hands-free assembly instructions and quality control checks. Retailers employ smart glasses for inventory management and customer assistance, while educational institutions use them for virtual learning and training.
- The ongoing development of AR applications and advancements in technology are expected to drive market growth, making smart glasses an increasingly valuable tool for businesses seeking to improve efficiency and productivity.
Exclusive Customer Landscape
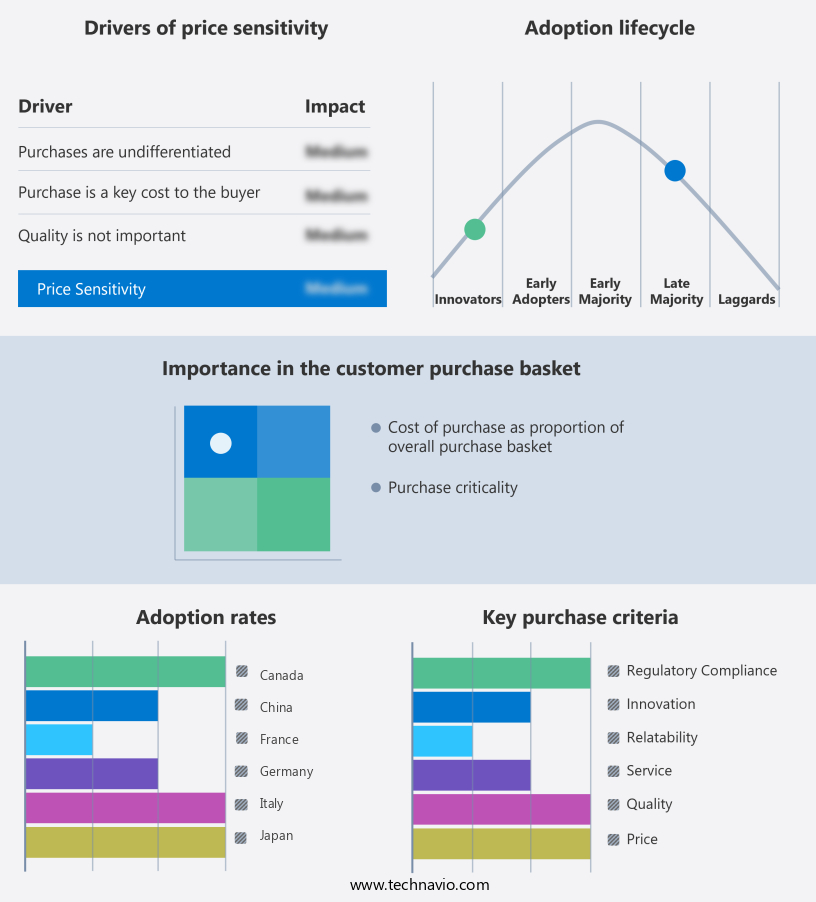
The smart glasses market forecasting report includes the adoption lifecycle of the market, covering from the innovator’s stage to the laggard’s stage. It focuses on adoption rates in different regions based on penetration. Furthermore, the smart glasses market report also includes key purchase criteria and drivers of price sensitivity to help companies evaluate and develop their market growth analysis strategies.
Customer Landscape of Smart Glasses Industry
Key Companies & Market Insights
Companies are implementing various strategies, such as strategic alliances, smart glasses market forecast, partnerships, mergers and acquisitions, geographical expansion, and product/service launches, to enhance their presence in the industry.
Google LLC - This company specializes in advanced eye protection technology, including 3M SecureFit smart glasses. These innovative glasses prioritize safety and functionality, integrating cutting-edge technology for enhanced user experience. The company's commitment to research and development sets it apart in the industry.
The industry research and growth report includes detailed analyses of the competitive landscape of the market and information about key companies, including:
- Google LLC
- Microsoft Corp.
- Vuzix Corp.
- Epson
- RealWear Inc.
- Sony Corp.
- Rokid Corp.
- ThirdEye Gen Inc.
- Solos Smart Glasses
- Vue Inc.
- Amazon.com Inc.
- Bose Corp.
- Oppo
- Xiaomi Corp.
- Lenovo Group Ltd.
- LG Electronics
- Samsung Electronics Co. Ltd.
- Fujitsu Ltd.
- MicroVision Inc.
- Snap Inc.
Qualitative and quantitative analysis of companies has been conducted to help clients understand the wider business environment as well as the strengths and weaknesses of key industry players. Data is qualitatively analyzed to categorize companies as pure play, category-focused, industry-focused, and diversified; it is quantitatively analyzed to categorize companies as dominant, leading, strong, tentative, and weak.
Recent Development and News in Smart Glasses Market
- In January 2024, Google announced the launch of Google Glass Enterprise Edition 2, a new version of its smart glasses designed specifically for business use (Google, 2024). This release marked a significant shift in the market, as Google aimed to target industries such as healthcare, manufacturing, and logistics with its advanced features.
- In March 2024, Facebook's Reality Labs division entered into a strategic partnership with Ray-Ban to develop and sell Ray-Ban-branded smart glasses (Reuters, 2024). This collaboration represented a major step forward for Facebook in its efforts to expand its presence in the wearable technology market.
- In May 2024, Magic Leap, a leading augmented reality company, secured a USD502 million funding round, bringing its total funding to over USD2.6 billion (Bloomberg, 2024). This substantial investment will support the development of its next-generation smart glasses, which are expected to deliver a more immersive augmented reality experience.
- In April 2025, Vuzix, a smart glasses manufacturer, announced a partnership with Amazon to integrate Amazon's Alexa voice assistant into its Blade AR smart glasses (Vuzix, 2025). This collaboration will allow users to access Alexa's capabilities hands-free, enhancing the functionality and convenience of the smart glasses.
Research Analyst Overview
- The market for smart glasses is experiencing significant advancements, driven by the integration of innovative technologies such as proximity sensors, optical see-through displays, and head-tracking systems. These devices, which function as head-mounted displays or video see-through displays, employ microdisplay technology to project augmented reality (AR) overlays directly into the user's field of view. Proximity sensors play a crucial role in smart glasses, enabling them to detect the user's presence and automatically activate or deactivate features based on their proximity to various objects or environments. Optical see-through displays, meanwhile, offer a more natural viewing experience by allowing users to see their real-world surroundings while also displaying digital information.
- Head tracking accuracy is another essential aspect of smart glasses, as it enables the devices to maintain an accurate alignment with the user's head movements. Computer vision algorithms and inertial measurement units contribute to this functionality, ensuring that the AR overlays remain in the correct position and orientation. Microdisplay technology continues to evolve, leading to improvements in display resolution and reducing power consumption. Additionally, the integration of waveguide optics and GPS allows for spatial computing capabilities, enhancing the user experience by providing contextually relevant information based on location. According to recent market research, The market is projected to grow at a compound annual growth rate (CAGR) of 25% between 2022 and 2027.
- This growth is attributed to the increasing demand for wearable technology in various sectors, including healthcare, manufacturing, and education. Smart glasses are transforming industries by offering hands-free access to information, improving productivity, and enhancing user experiences. As technology continues to advance, we can expect further innovations in areas such as head tracking accuracy, display resolution, and user interface design.
Dive into Technavio’s robust research methodology, blending expert interviews, extensive data synthesis, and validated models for unparalleled Smart Glasses Market insights. See full methodology.
|
Market Scope |
|
|
Report Coverage |
Details |
|
Page number |
216 |
|
Base year |
2024 |
|
Historic period |
2019-2023 |
|
Forecast period |
2025-2029 |
|
Growth momentum & CAGR |
Accelerate at a CAGR of 14.5% |
|
Market growth 2025-2029 |
USD 90.6 million |
|
Market structure |
Fragmented |
|
YoY growth 2024-2025(%) |
12.7 |
|
Key countries |
US, France, UK, Canada, Germany, Italy, Spain, China, The Netherlands, and Japan |
|
Competitive landscape |
Leading Companies, Market Positioning of Companies, Competitive Strategies, and Industry Risks |
What are the Key Data Covered in this Smart Glasses Market Research and Growth Report?
- CAGR of the Smart Glasses industry during the forecast period
- Detailed information on factors that will drive the growth and forecasting between 2025 and 2029
- Precise estimation of the size of the market and its contribution of the industry in focus to the parent market
- Accurate predictions about upcoming growth and trends and changes in consumer behaviour
- Growth of the market across North America, Europe, APAC, Middle East and Africa, and South America
- Thorough analysis of the market’s competitive landscape and detailed information about companies
- Comprehensive analysis of factors that will challenge the smart glasses market growth of industry companies
We can help! Our analysts can customize this smart glasses market research report to meet your requirements.
 RIA -
RIA - 
