Pet Care Market Analysis, Size, and Forecast 2026-2030: North America (US, Canada, and Mexico), Europe (Germany, UK, and France), APAC (China, Japan, and India), Middle East and Africa (South Africa, Saudi Arabia, and UAE), South America (Brazil and Argentina), and Rest of World (ROW)

Pet Care Market Analysis, Size, and Forecast 2026-2030:
North America (US, Canada, and Mexico), Europe (Germany, UK, and France), APAC (China, Japan, and India), Middle East and Africa (South Africa, Saudi Arabia, and UAE), South America (Brazil and Argentina), and Rest of World (ROW)

Published: Mar 2026 291 Pages SKU: IRTNTR70541

Market Overview at a Glance

$110.2 Mn
Market Opportunity
7.4%
CAGR 2025 - 2030
44%
North America Growth
$107.5 Mn
Dogs segment 2024

Pet Care Market Size 2026-2030

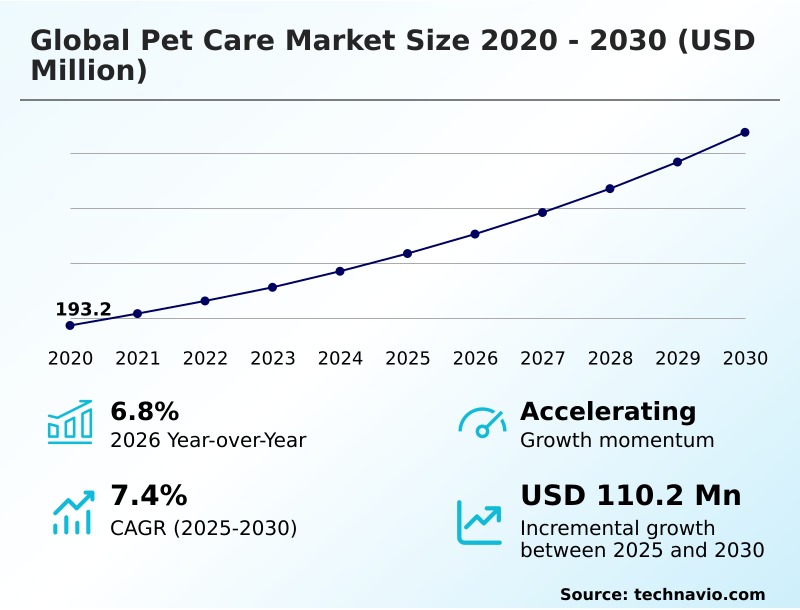
The pet care market size is valued to increase by USD 110.2 million, at a CAGR of 7.4% from 2025 to 2030. Increasing number of pet ownership will drive the pet care market.

Major Market Trends & Insights

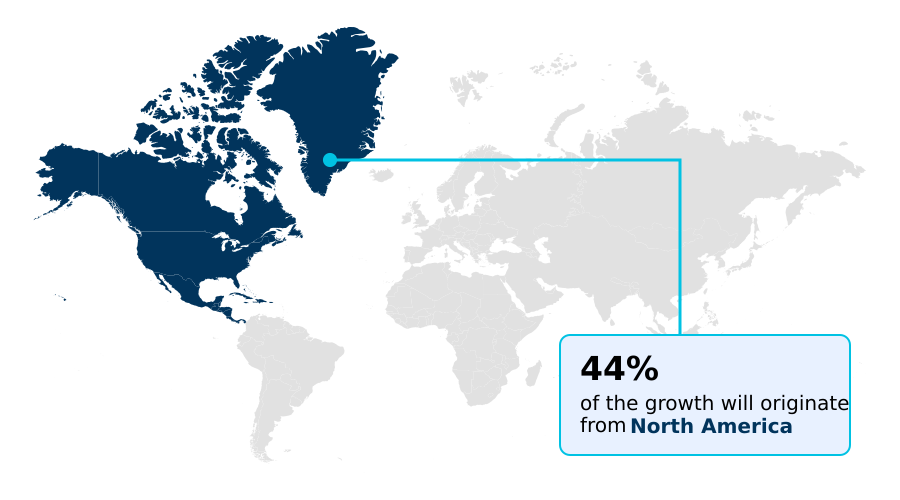
  • North America dominated the market and accounted for a 44% growth during the forecast period.
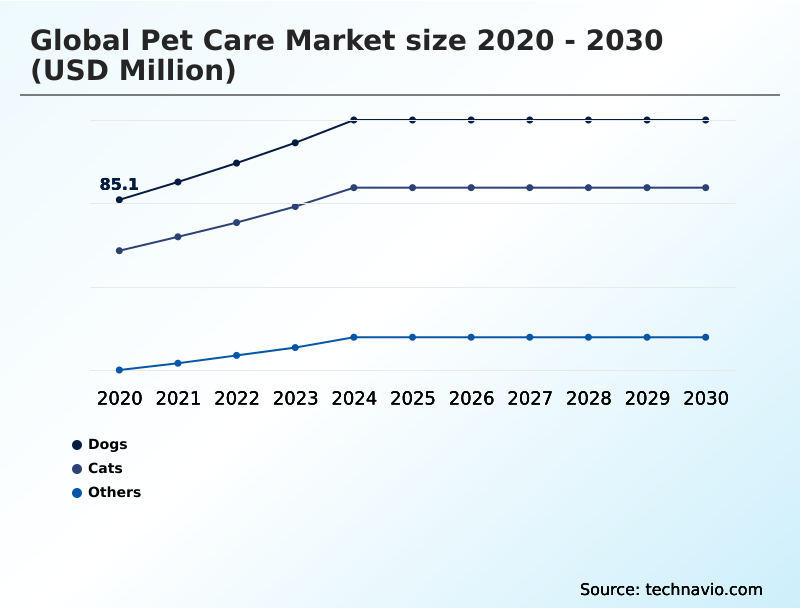
  • By Application - Dogs segment was valued at USD 107.5 million in 2024
  • By Product - Food segment accounted for the largest market revenue share in 2024

Market Size & Forecast

  • Market Opportunities: USD 175.6 million
  • Market Future Opportunities: USD 110.2 million
  • CAGR from 2025 to 2030 : 7.4%

Market Summary

  • The Pet Care Market is undergoing a significant transformation, driven by the deep-seated trend of pet humanization. Consumers increasingly view their companion animals as family members, fueling demand for products and services that align with their own health and wellness standards.
  • This has led to the proliferation of premium pet food, including organic and grain-free diets, and a surge in demand for pet supplements that address specific health concerns from joint support to anxiety. The focus on animal welfare extends beyond nutrition to encompass holistic pet care, with owners investing in advanced veterinary services, comprehensive pet insurance, and high-quality pet accessories.
  • As e-commerce and direct-to-consumer pet brands reshape the retail landscape, businesses must navigate complex supply chains to ensure pet food safety and ingredient transparency. For instance, a brand specializing in specialized pet diets must manage sourcing for niche ingredients while meeting stringent regulatory standards, making operational agility a critical factor for success in this dynamic and emotionally-driven market.
  • The integration of pet tech, from smart feeders to activity trackers, further illustrates the industry's shift toward data-driven, personalized care solutions.

What will be the Size of the Pet Care Market during the forecast period?

Get Key Insights on Market Forecast (PDF) Request Free Sample

How is the Pet Care Market Segmented?

The pet care industry research report provides comprehensive data (region-wise segment analysis), with forecasts and estimates in "USD million" for the period 2026-2030, as well as historical data from 2020-2024 for the following segments.

  • Application
    • Dogs
    • Cats
    • Others
  • Product
    • Food
    • Accessories
    • Grooming
  • Distribution channel
    • Offline
    • Online
  • Geography
    • North America
      • US
      • Canada
      • Mexico
    • Europe
      • Germany
      • UK
      • France
    • APAC
      • China
      • Japan
      • India
    • Middle East and Africa
      • South Africa
      • Saudi Arabia
      • UAE
    • South America
      • Brazil
      • Argentina
    • Rest of World (ROW)

By Application Insights

The dogs segment is estimated to witness significant growth during the forecast period.

The dogs segment reflects the deep integration of canines as a companion animal in households, where the pet humanization trend is paramount.

This cultural shift drives demand for products that mirror human lifestyle choices, from premium pet food and organic pet food to holistic pet care solutions.

Owners are increasingly investing in advanced canine health, including diets for dog joint support and supplements. Beyond nutrition, the market for high-tech pet accessories and gear for pet-friendly travel is expanding.

The demand for human-grade pet food, featuring high-quality ingredients, has led to some brands seeing a 15% increase in their premium line sales, underscoring the segment's focus on quality and well-being.

Request Free Sample

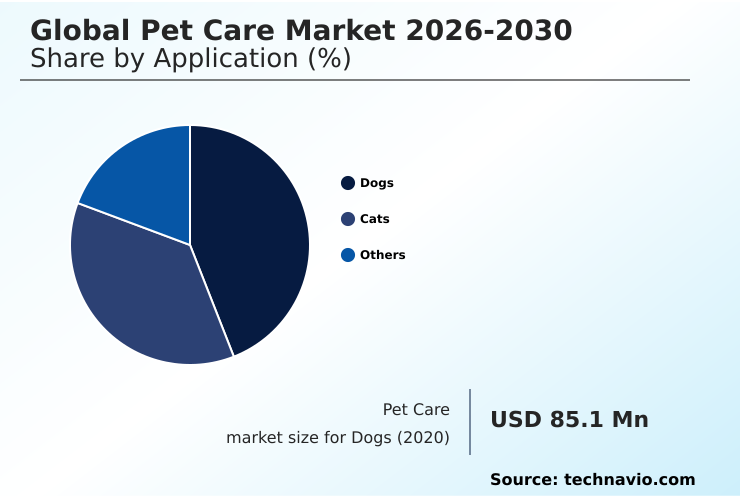
The Dogs segment was valued at USD 107.5 million in 2024 and showed a gradual increase during the forecast period.

Request Free Sample

Regional Analysis

North America is estimated to contribute 44% to the growth of the global market during the forecast period.Technavio’s analysts have elaborately explained the regional trends and drivers that shape the market during the forecast period.

See How Pet Care Market Demand is Rising in North America Request Free Sample

The geographic landscape is diverse, with North America representing over 44% of incremental growth, focusing on high-tech solutions for pet obesity management and pet anxiety solutions.

In contrast, Europe, which accounts for roughly 26% of growth, prioritizes sustainability, driving demand for upcycled pet products and natural flea and tick prevention.

APAC is the fastest-growing region, with a digital-first approach to purchasing specialized pet diets for issues like cat urinary health and smart pet toys for animal enrichment.

This regional divergence requires global brands to adapt, balancing high-tech innovation with a growing demand for sustainable practices and accessible solutions for pet grooming at home.

Market Dynamics

Our researchers analyzed the data with 2025 as the base year, along with the key drivers, trends, and challenges. A holistic analysis of drivers will help companies refine their marketing strategies to gain a competitive advantage.

  • The market's long-tail strategy is increasingly focused on hyper-specialization and sustainability, directly addressing nuanced consumer demands. The benefits of hydrolyzed protein in dog food are now a key selling point for brands targeting pets with specific allergies.
  • Simultaneously, there's a growing emphasis on comparing sustainable materials for pet beds, where brands using eco-friendly options report a customer loyalty increase nearly double that of competitors. This eco-consciousness also drives interest in how smart feeders help with pet obesity and the best practices for at-home pet dental care.
  • The impact of probiotics on feline digestive health is another critical area, influencing the formulation of advanced cat foods. As consumers seek comprehensive solutions, topics like the role of omega-3 in canine skin health, natural supplements for cat anxiety, and guidance on transitioning a cat to a raw food diet are becoming central to brand communication.
  • This is further supported by the rise of advancements in tele-veterinary consultations, which make expert advice on choosing a grain-free diet for senior dogs more accessible than ever, creating a highly informed and discerning consumer base.

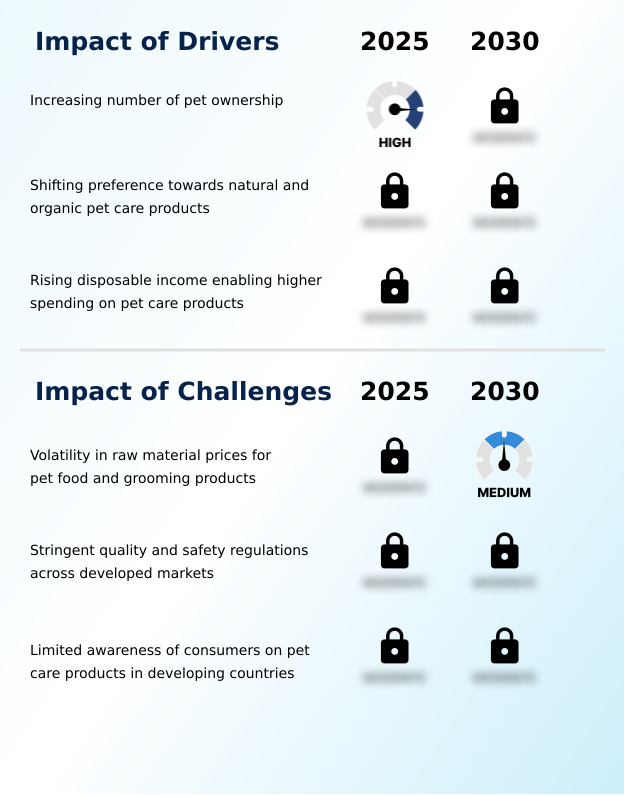
What are the key market drivers leading to the rise in the adoption of Pet Care Industry?

  • A primary driver fueling market expansion is the increasing rate of pet ownership worldwide, coupled with the growing trend of pet humanization.

  • Rising pet ownership and a focus on animal welfare are key market drivers.
  • With higher disposable incomes, consumers are investing more in preventative care, including regular veterinary services and pet insurance, which has seen a 20% rise in policy adoption, enabling higher spending on specialized treatments.
  • The demand for advanced feline care and canine products such as pet supplements and functional pet treats that support pet dental care is growing. Furthermore, personalized pet nutrition, often guided by tele-veterinary services, is becoming mainstream.
  • The adoption of specialized grain-free diets has been shown to reduce allergic-reaction-related vet visits by over 15% in certain breeds.

What are the market trends shaping the Pet Care Industry?

  • The market is experiencing a significant transformation driven by the growth of e-commerce platforms and direct-to-consumer channels. This shift offers consumers unparalleled convenience and access to a vast selection of pet care products.

  • The market is being reshaped by the growth of pet care e-commerce, with direct-to-consumer pet brands leveraging pet subscription boxes to foster loyalty. This digital shift has led to adoption rates for automated delivery services increasing by 40% in key demographics.
  • Concurrently, sustainability is a major trend, with a focus on sustainable pet products and eco-friendly pet toys, making the use of biodegradable pet waste bags a standard expectation.
  • In parallel, pet tech is advancing with smart pet feeders and pet activity trackers, which integrate with home pet grooming tools, showing a 25% improvement in managing pet health and wellness routines for owners.

What challenges does the Pet Care Industry face during its growth?

  • Significant volatility in the prices of raw materials for pet food and grooming products poses a primary challenge to the industry's profitability and growth.

  • Navigating supply chain volatility and stringent pet food safety regulations presents a major challenge. The rising cost of sourcing specialized ingredients for veterinary diet formulations, such as hydrolyzed protein or omega-3 for pets, can compress margins by up to 10%. This impacts niche segments like raw feeding and cold-pressed pet food.
  • Manufacturers must also manage the complexities of formulating limited ingredient diets and ensuring pet food palatability. Balancing the demand for beneficial additives like probiotics for pets while adhering to evolving regulatory standards for animal behavior supplements can extend product development timelines by over 25% compared to less regulated consumer goods.

Exclusive Technavio Analysis on Customer Landscape

The pet care market forecasting report includes the adoption lifecycle of the market, covering from the innovator’s stage to the laggard’s stage. It focuses on adoption rates in different regions based on penetration. Furthermore, the pet care market report also includes key purchase criteria and drivers of price sensitivity to help companies evaluate and develop their market growth analysis strategies.

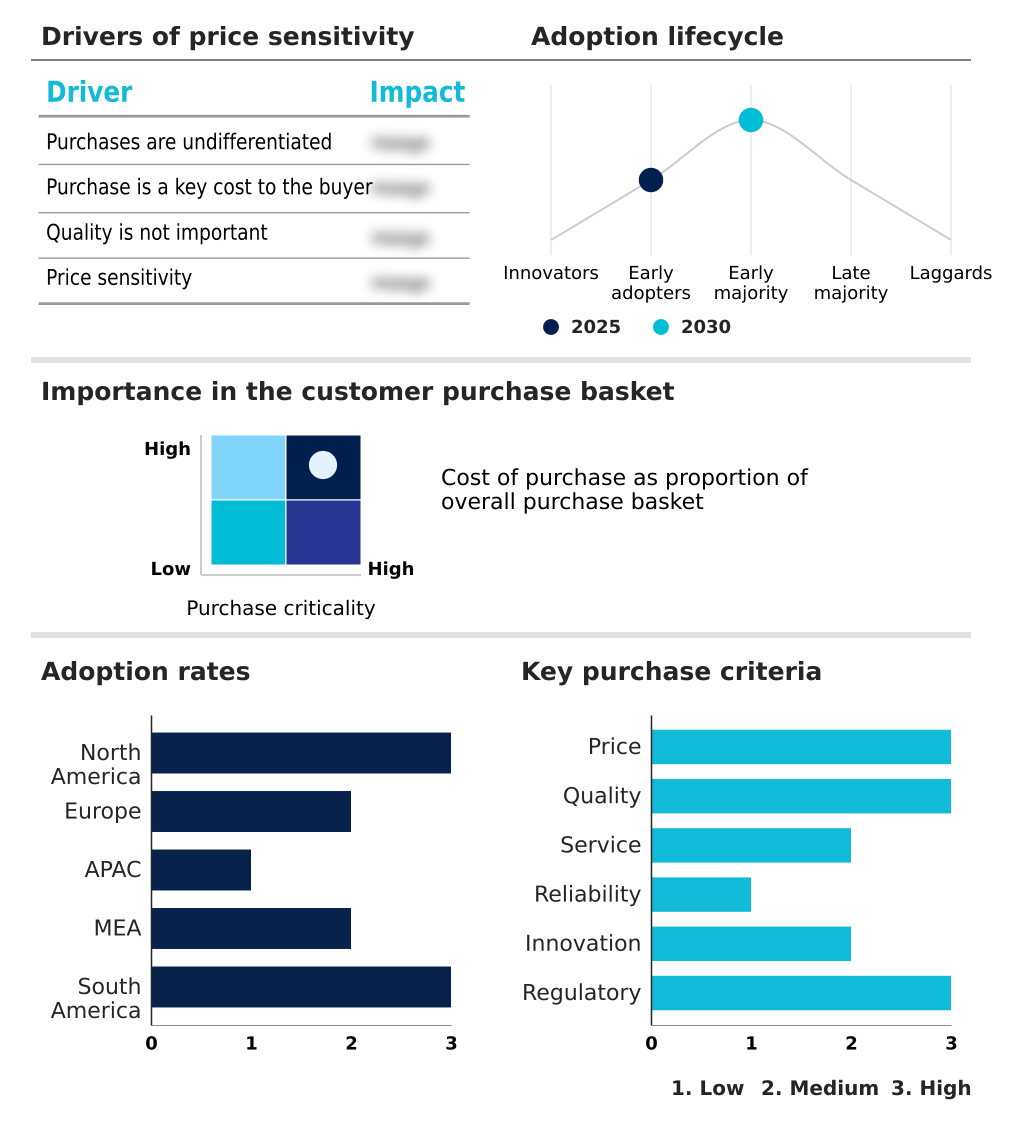
Customer Landscape of Pet Care Industry

Competitive Landscape

Companies are implementing various strategies, such as strategic alliances, pet care market forecast, partnerships, mergers and acquisitions, geographical expansion, and product/service launches, to enhance their presence in the industry.

Blue Buffalo Co. Ltd. - Analysts observe a strategic focus on developing science-backed nutritional formulas and premium products designed to enhance overall pet health and well-being.

The industry research and growth report includes detailed analyses of the competitive landscape of the market and information about key companies, including:

  • Blue Buffalo Co. Ltd.
  • Canidae Pet Food Co.
  • Central Garden and Pet Co.
  • Diamond Pet Foods Inc.
  • Farmina Pet Foods
  • Fromm Family Foods LLC
  • Hills Pet Nutrition Inc.
  • Instinct Pet Food
  • Mars Inc.
  • Merrick Pet Care Inc.
  • Natural Balance Pet Foods
  • Nestle Purina PetCare Co.
  • Nulo Pet Food
  • Petmate
  • Rolf C. Hagen Inc.
  • Simmons Pet Food Inc.
  • Solid Gold Pet LLC
  • Stella and Chewys LLC
  • Wellness Pet Co. Inc.
  • Zignature

Qualitative and quantitative analysis of companies has been conducted to help clients understand the wider business environment as well as the strengths and weaknesses of key industry players. Data is qualitatively analyzed to categorize companies as pure play, category-focused, industry-focused, and diversified; it is quantitatively analyzed to categorize companies as dominant, leading, strong, tentative, and weak.

Recent Development and News in Pet care market

  • In September 2025, Chewy implemented a new AI driven health dashboard for its subscription members that uses machine learning to predict when refills for therapeutic diets and chronic medications will be needed based on real time consumption data.
  • In May 2025, Petco Animal Supplies announced a major partnership with a sustainable material startup to develop a range of pet beds filled with recycled textile waste instead of traditional foam.
  • In March 2025, Mars Petcare launched a new line of breed specific functional treats aimed at supporting cognitive health in aging feline and canine populations across major urban centers.
  • In February 2025, Amazon expanded its specialized pet subscription tier to include even more therapeutic and raw food options reflecting the growing demand for home delivery of specialized nutrition.

Dive into Technavio’s robust research methodology, blending expert interviews, extensive data synthesis, and validated models for unparalleled Pet Care Market insights. See full methodology.

Market Scope
Page number 291
Base year 2025
Historic period 2020-2024
Forecast period 2026-2030
Growth momentum & CAGR Accelerate at a CAGR of 7.4%
Market growth 2026-2030 USD 110.2 million
Market structure Fragmented
YoY growth 2025-2026(%) 6.8%
Key countries US, Canada, Mexico, Germany, UK, France, Italy, Spain, The Netherlands, China, Japan, India, South Korea, Australia, Indonesia, South Africa, Saudi Arabia, UAE, Turkey, Israel, Brazil, Argentina and Chile
Competitive landscape Leading Companies, Market Positioning of Companies, Competitive Strategies, and Industry Risks

Request Free Sample

Research Analyst Overview

  • The pet care market is evolving beyond basic sustenance, driven by a deeper understanding of canine health and feline care. The overarching trends of pet humanization and a focus on animal welfare are compelling manufacturers to innovate across pet nutrition and pet grooming.
  • Boardroom decisions now frequently center on the complexities of sourcing for organic pet food and grain-free diets, while ensuring rigorous pet food safety standards. The rise of specialized products, including hydrolyzed protein for allergies, probiotics for pets for digestive health, and omega-3 for pets for coat conditioning, highlights a shift towards targeted solutions.
  • Firms that successfully integrate pet tech, such as smart pet feeders and pet activity trackers, report a 30% higher customer engagement rate. This data-driven approach extends to raw feeding protocols and even the formulation of pet supplements.
  • Consequently, the industry is seeing a convergence of veterinary services, advanced pet dental care, and consumer demand for sustainable pet products, such as biodegradable pet waste bags, creating a highly competitive and sophisticated marketplace where the well-being of the companion animal is paramount.

What are the Key Data Covered in this Pet Care Market Research and Growth Report?

  • What is the expected growth of the Pet Care Market between 2026 and 2030?

    • USD 110.2 million, at a CAGR of 7.4%

  • What segmentation does the market report cover?

    • The report is segmented by Application (Dogs, Cats, and Others), Product (Food, Accessories, and Grooming), Distribution Channel (Offline, and Online) and Geography (North America, Europe, APAC, Middle East and Africa, South America)

  • Which regions are analyzed in the report?

    • North America, Europe, APAC, Middle East and Africa and South America

  • What are the key growth drivers and market challenges?

    • Increasing number of pet ownership, Volatility in raw material prices for pet food and grooming products

  • Who are the major players in the Pet Care Market?

    • Blue Buffalo Co. Ltd., Canidae Pet Food Co., Central Garden and Pet Co., Diamond Pet Foods Inc., Farmina Pet Foods, Fromm Family Foods LLC, Hills Pet Nutrition Inc., Instinct Pet Food, Mars Inc., Merrick Pet Care Inc., Natural Balance Pet Foods, Nestle Purina PetCare Co., Nulo Pet Food, Petmate, Rolf C. Hagen Inc., Simmons Pet Food Inc., Solid Gold Pet LLC, Stella and Chewys LLC, Wellness Pet Co. Inc. and Zignature

Market Research Insights

  • The market is defined by a strategic pivot towards high-engagement, value-driven models that prioritize holistic pet care. Strategic adoption of direct-to-consumer models has enabled brands to achieve customer retention rates that are twice as high as traditional retail channels by leveraging personalized pet nutrition.
  • Furthermore, implementing these customized diet plans, often guided by tele-veterinary services, has been shown to reduce a pet's likelihood of developing common ailments by a significant margin.
  • This focus on premium pet food and preventative health, supported by a robust pet insurance market, underscores a fundamental shift in consumer spending, where long-term animal enrichment and wellness are now primary investment drivers.

We can help! Our analysts can customize this pet care market research report to meet your requirements.

Get in touch

1. Executive Summary

1.1 Market overview

Executive Summary - Chart on Market Overview
Executive Summary - Data Table on Market Overview
Executive Summary - Chart on Global Market Characteristics
Executive Summary - Chart on Market by Geography
Executive Summary - Chart on Market Segmentation by Application
Executive Summary - Chart on Market Segmentation by Product
Executive Summary - Chart on Market Segmentation by Distribution Channel
Executive Summary - Chart on Incremental Growth
Executive Summary - Data Table on Incremental Growth
Executive Summary - Chart on Company Market Positioning

2. Technavio Analysis

2.1 Analysis of price sensitivity, lifecycle, customer purchase basket, adoption rates, and purchase criteria

2.2 Criticality of inputs and Factors of differentiation

Chart on Overview on criticality of inputs and factors of differentiation

2.3 Factors of disruption

Chart on Overview on factors of disruption

2.4 Impact of drivers and challenges

Chart on Impact of drivers and challenges in 2025 and 2030

3. Market Landscape

3.1 Market ecosystem

Chart on Parent Market
Data Table on - Parent Market

3.2 Market characteristics

Chart on Market characteristics analysis

3.3 Value chain analysis

Chart on Value chain analysis

4. Market Sizing

4.1 Market definition

Data Table on Offerings of companies included in the market definition

4.2 Market segment analysis

Market segments

4.3 Market size 2025

4.4 Market outlook: Forecast for 2025-2030

Chart on Global - Market size and forecast 2025-2030 ($ million)
Data Table on Global - Market size and forecast 2025-2030 ($ million)
Chart on Global Market: Year-over-year growth 2025-2030 (%)
Data Table on Global Market: Year-over-year growth 2025-2030 (%)

5. Historic Market Size

5.1 Global Pet Care Market 2020 - 2024

Historic Market Size - Data Table on Global Pet Care Market 2020 - 2024 ($ million)

5.2 Application segment analysis 2020 - 2024

Historic Market Size - Application Segment 2020 - 2024 ($ million)

5.3 Product segment analysis 2020 - 2024

Historic Market Size - Product Segment 2020 - 2024 ($ million)

5.4 Distribution Channel segment analysis 2020 - 2024

Historic Market Size - Distribution Channel Segment 2020 - 2024 ($ million)

5.5 Geography segment analysis 2020 - 2024

Historic Market Size - Geography Segment 2020 - 2024 ($ million)

5.6 Country segment analysis 2020 - 2024

Historic Market Size - Country Segment 2020 - 2024 ($ million)

6. Qualitative Analysis

6.1 Impact of AI on the Global Pet Care Market

6.2 Impact of Geopolitical Conflicts on Global Pet Care Market

7. Five Forces Analysis

7.1 Five forces summary

Five forces analysis - Comparison between 2025 and 2030

7.2 Bargaining power of buyers

Bargaining power of buyers - Impact of key factors 2025 and 2030

7.3 Bargaining power of suppliers

Bargaining power of suppliers - Impact of key factors in 2025 and 2030

7.4 Threat of new entrants

Threat of new entrants - Impact of key factors in 2025 and 2030

7.5 Threat of substitutes

Threat of substitutes - Impact of key factors in 2025 and 2030

7.6 Threat of rivalry

Threat of rivalry - Impact of key factors in 2025 and 2030

7.7 Market condition

Chart on Market condition - Five forces 2025 and 2030

8. Market Segmentation by Application

8.1 Market segments

Chart on Application - Market share 2025-2030 (%)
Data Table on Application - Market share 2025-2030 (%)

8.2 Comparison by Application

Chart on Comparison by Application
Data Table on Comparison by Application

8.3 Dogs - Market size and forecast 2025-2030

Chart on Dogs - Market size and forecast 2025-2030 ($ million)
Data Table on Dogs - Market size and forecast 2025-2030 ($ million)
Chart on Dogs - Year-over-year growth 2025-2030 (%)
Data Table on Dogs - Year-over-year growth 2025-2030 (%)

8.4 Cats - Market size and forecast 2025-2030

Chart on Cats - Market size and forecast 2025-2030 ($ million)
Data Table on Cats - Market size and forecast 2025-2030 ($ million)
Chart on Cats - Year-over-year growth 2025-2030 (%)
Data Table on Cats - Year-over-year growth 2025-2030 (%)

8.5 Others - Market size and forecast 2025-2030

Chart on Others - Market size and forecast 2025-2030 ($ million)
Data Table on Others - Market size and forecast 2025-2030 ($ million)
Chart on Others - Year-over-year growth 2025-2030 (%)
Data Table on Others - Year-over-year growth 2025-2030 (%)

8.6 Market opportunity by Application

Market opportunity by Application ($ million)
Data Table on Market opportunity by Application ($ million)

9. Market Segmentation by Product

9.1 Market segments

Chart on Product - Market share 2025-2030 (%)
Data Table on Product - Market share 2025-2030 (%)

9.2 Comparison by Product

Chart on Comparison by Product
Data Table on Comparison by Product

9.3 Food - Market size and forecast 2025-2030

Chart on Food - Market size and forecast 2025-2030 ($ million)
Data Table on Food - Market size and forecast 2025-2030 ($ million)
Chart on Food - Year-over-year growth 2025-2030 (%)
Data Table on Food - Year-over-year growth 2025-2030 (%)

9.4 Accessories - Market size and forecast 2025-2030

Chart on Accessories - Market size and forecast 2025-2030 ($ million)
Data Table on Accessories - Market size and forecast 2025-2030 ($ million)
Chart on Accessories - Year-over-year growth 2025-2030 (%)
Data Table on Accessories - Year-over-year growth 2025-2030 (%)

9.5 Grooming - Market size and forecast 2025-2030

Chart on Grooming - Market size and forecast 2025-2030 ($ million)
Data Table on Grooming - Market size and forecast 2025-2030 ($ million)
Chart on Grooming - Year-over-year growth 2025-2030 (%)
Data Table on Grooming - Year-over-year growth 2025-2030 (%)

9.6 Market opportunity by Product

Market opportunity by Product ($ million)
Data Table on Market opportunity by Product ($ million)

10. Market Segmentation by Distribution Channel

10.1 Market segments

Chart on Distribution Channel - Market share 2025-2030 (%)
Data Table on Distribution Channel - Market share 2025-2030 (%)

10.2 Comparison by Distribution Channel

Chart on Comparison by Distribution Channel
Data Table on Comparison by Distribution Channel

10.3 Offline - Market size and forecast 2025-2030

Chart on Offline - Market size and forecast 2025-2030 ($ million)
Data Table on Offline - Market size and forecast 2025-2030 ($ million)
Chart on Offline - Year-over-year growth 2025-2030 (%)
Data Table on Offline - Year-over-year growth 2025-2030 (%)

10.4 Online - Market size and forecast 2025-2030

Chart on Online - Market size and forecast 2025-2030 ($ million)
Data Table on Online - Market size and forecast 2025-2030 ($ million)
Chart on Online - Year-over-year growth 2025-2030 (%)
Data Table on Online - Year-over-year growth 2025-2030 (%)

10.5 Market opportunity by Distribution Channel

Market opportunity by Distribution Channel ($ million)
Data Table on Market opportunity by Distribution Channel ($ million)

11. Customer Landscape

11.1 Customer landscape overview

Analysis of price sensitivity, lifecycle, customer purchase basket, adoption rates, and purchase criteria

12. Geographic Landscape

12.1 Geographic segmentation

Chart on Market share by geography 2025-2030 (%)
Data Table on Market share by geography 2025-2030 (%)

12.2 Geographic comparison

Chart on Geographic comparison
Data Table on Geographic comparison

12.3 North America - Market size and forecast 2025-2030

Chart on North America - Market size and forecast 2025-2030 ($ million)
Data Table on North America - Market size and forecast 2025-2030 ($ million)
Chart on North America - Year-over-year growth 2025-2030 (%)
Data Table on North America - Year-over-year growth 2025-2030 (%)
Chart on Regional Comparison - North America
Data Table on Regional Comparison - North America

12.3.1 US - Market size and forecast 2025-2030

Chart on US - Market size and forecast 2025-2030 ($ million)
Data Table on US - Market size and forecast 2025-2030 ($ million)
Chart on US - Year-over-year growth 2025-2030 (%)
Data Table on US - Year-over-year growth 2025-2030 (%)

12.3.2 Canada - Market size and forecast 2025-2030

Chart on Canada - Market size and forecast 2025-2030 ($ million)
Data Table on Canada - Market size and forecast 2025-2030 ($ million)
Chart on Canada - Year-over-year growth 2025-2030 (%)
Data Table on Canada - Year-over-year growth 2025-2030 (%)

12.3.3 Mexico - Market size and forecast 2025-2030

Chart on Mexico - Market size and forecast 2025-2030 ($ million)
Data Table on Mexico - Market size and forecast 2025-2030 ($ million)
Chart on Mexico - Year-over-year growth 2025-2030 (%)
Data Table on Mexico - Year-over-year growth 2025-2030 (%)

12.4 Europe - Market size and forecast 2025-2030

Chart on Europe - Market size and forecast 2025-2030 ($ million)
Data Table on Europe - Market size and forecast 2025-2030 ($ million)
Chart on Europe - Year-over-year growth 2025-2030 (%)
Data Table on Europe - Year-over-year growth 2025-2030 (%)
Chart on Regional Comparison - Europe
Data Table on Regional Comparison - Europe

12.4.1 Germany - Market size and forecast 2025-2030

Chart on Germany - Market size and forecast 2025-2030 ($ million)
Data Table on Germany - Market size and forecast 2025-2030 ($ million)
Chart on Germany - Year-over-year growth 2025-2030 (%)
Data Table on Germany - Year-over-year growth 2025-2030 (%)

12.4.2 UK - Market size and forecast 2025-2030

Chart on UK - Market size and forecast 2025-2030 ($ million)
Data Table on UK - Market size and forecast 2025-2030 ($ million)
Chart on UK - Year-over-year growth 2025-2030 (%)
Data Table on UK - Year-over-year growth 2025-2030 (%)

12.4.3 France - Market size and forecast 2025-2030

Chart on France - Market size and forecast 2025-2030 ($ million)
Data Table on France - Market size and forecast 2025-2030 ($ million)
Chart on France - Year-over-year growth 2025-2030 (%)
Data Table on France - Year-over-year growth 2025-2030 (%)

12.4.4 Italy - Market size and forecast 2025-2030

Chart on Italy - Market size and forecast 2025-2030 ($ million)
Data Table on Italy - Market size and forecast 2025-2030 ($ million)
Chart on Italy - Year-over-year growth 2025-2030 (%)
Data Table on Italy - Year-over-year growth 2025-2030 (%)

12.4.5 Spain - Market size and forecast 2025-2030

Chart on Spain - Market size and forecast 2025-2030 ($ million)
Data Table on Spain - Market size and forecast 2025-2030 ($ million)
Chart on Spain - Year-over-year growth 2025-2030 (%)
Data Table on Spain - Year-over-year growth 2025-2030 (%)

12.4.6 The Netherlands - Market size and forecast 2025-2030

Chart on The Netherlands - Market size and forecast 2025-2030 ($ million)
Data Table on The Netherlands - Market size and forecast 2025-2030 ($ million)
Chart on The Netherlands - Year-over-year growth 2025-2030 (%)
Data Table on The Netherlands - Year-over-year growth 2025-2030 (%)

12.5 APAC - Market size and forecast 2025-2030

Chart on APAC - Market size and forecast 2025-2030 ($ million)
Data Table on APAC - Market size and forecast 2025-2030 ($ million)
Chart on APAC - Year-over-year growth 2025-2030 (%)
Data Table on APAC - Year-over-year growth 2025-2030 (%)
Chart on Regional Comparison - APAC
Data Table on Regional Comparison - APAC

12.5.1 China - Market size and forecast 2025-2030

Chart on China - Market size and forecast 2025-2030 ($ million)
Data Table on China - Market size and forecast 2025-2030 ($ million)
Chart on China - Year-over-year growth 2025-2030 (%)
Data Table on China - Year-over-year growth 2025-2030 (%)

12.5.2 Japan - Market size and forecast 2025-2030

Chart on Japan - Market size and forecast 2025-2030 ($ million)
Data Table on Japan - Market size and forecast 2025-2030 ($ million)
Chart on Japan - Year-over-year growth 2025-2030 (%)
Data Table on Japan - Year-over-year growth 2025-2030 (%)

12.5.3 India - Market size and forecast 2025-2030

Chart on India - Market size and forecast 2025-2030 ($ million)
Data Table on India - Market size and forecast 2025-2030 ($ million)
Chart on India - Year-over-year growth 2025-2030 (%)
Data Table on India - Year-over-year growth 2025-2030 (%)

12.5.4 South Korea - Market size and forecast 2025-2030

Chart on South Korea - Market size and forecast 2025-2030 ($ million)
Data Table on South Korea - Market size and forecast 2025-2030 ($ million)
Chart on South Korea - Year-over-year growth 2025-2030 (%)
Data Table on South Korea - Year-over-year growth 2025-2030 (%)

12.5.5 Australia - Market size and forecast 2025-2030

Chart on Australia - Market size and forecast 2025-2030 ($ million)
Data Table on Australia - Market size and forecast 2025-2030 ($ million)
Chart on Australia - Year-over-year growth 2025-2030 (%)
Data Table on Australia - Year-over-year growth 2025-2030 (%)

12.5.6 Indonesia - Market size and forecast 2025-2030

Chart on Indonesia - Market size and forecast 2025-2030 ($ million)
Data Table on Indonesia - Market size and forecast 2025-2030 ($ million)
Chart on Indonesia - Year-over-year growth 2025-2030 (%)
Data Table on Indonesia - Year-over-year growth 2025-2030 (%)

12.6 Middle East and Africa - Market size and forecast 2025-2030

Chart on Middle East and Africa - Market size and forecast 2025-2030 ($ million)
Data Table on Middle East and Africa - Market size and forecast 2025-2030 ($ million)
Chart on Middle East and Africa - Year-over-year growth 2025-2030 (%)
Data Table on Middle East and Africa - Year-over-year growth 2025-2030 (%)
Chart on Regional Comparison - Middle East and Africa
Data Table on Regional Comparison - Middle East and Africa

12.6.1 South Africa - Market size and forecast 2025-2030

Chart on South Africa - Market size and forecast 2025-2030 ($ million)
Data Table on South Africa - Market size and forecast 2025-2030 ($ million)
Chart on South Africa - Year-over-year growth 2025-2030 (%)
Data Table on South Africa - Year-over-year growth 2025-2030 (%)

12.6.2 Saudi Arabia - Market size and forecast 2025-2030

Chart on Saudi Arabia - Market size and forecast 2025-2030 ($ million)
Data Table on Saudi Arabia - Market size and forecast 2025-2030 ($ million)
Chart on Saudi Arabia - Year-over-year growth 2025-2030 (%)
Data Table on Saudi Arabia - Year-over-year growth 2025-2030 (%)

12.6.3 UAE - Market size and forecast 2025-2030

Chart on UAE - Market size and forecast 2025-2030 ($ million)
Data Table on UAE - Market size and forecast 2025-2030 ($ million)
Chart on UAE - Year-over-year growth 2025-2030 (%)
Data Table on UAE - Year-over-year growth 2025-2030 (%)

12.6.4 Turkey - Market size and forecast 2025-2030

Chart on Turkey - Market size and forecast 2025-2030 ($ million)
Data Table on Turkey - Market size and forecast 2025-2030 ($ million)
Chart on Turkey - Year-over-year growth 2025-2030 (%)
Data Table on Turkey - Year-over-year growth 2025-2030 (%)

12.6.5 Israel - Market size and forecast 2025-2030

Chart on Israel - Market size and forecast 2025-2030 ($ million)
Data Table on Israel - Market size and forecast 2025-2030 ($ million)
Chart on Israel - Year-over-year growth 2025-2030 (%)
Data Table on Israel - Year-over-year growth 2025-2030 (%)

12.7 South America - Market size and forecast 2025-2030

Chart on South America - Market size and forecast 2025-2030 ($ million)
Data Table on South America - Market size and forecast 2025-2030 ($ million)
Chart on South America - Year-over-year growth 2025-2030 (%)
Data Table on South America - Year-over-year growth 2025-2030 (%)
Chart on Regional Comparison - South America
Data Table on Regional Comparison - South America

12.7.1 Brazil - Market size and forecast 2025-2030

Chart on Brazil - Market size and forecast 2025-2030 ($ million)
Data Table on Brazil - Market size and forecast 2025-2030 ($ million)
Chart on Brazil - Year-over-year growth 2025-2030 (%)
Data Table on Brazil - Year-over-year growth 2025-2030 (%)

12.7.2 Argentina - Market size and forecast 2025-2030

Chart on Argentina - Market size and forecast 2025-2030 ($ million)
Data Table on Argentina - Market size and forecast 2025-2030 ($ million)
Chart on Argentina - Year-over-year growth 2025-2030 (%)
Data Table on Argentina - Year-over-year growth 2025-2030 (%)

12.7.3 Chile - Market size and forecast 2025-2030

Chart on Chile - Market size and forecast 2025-2030 ($ million)
Data Table on Chile - Market size and forecast 2025-2030 ($ million)
Chart on Chile - Year-over-year growth 2025-2030 (%)
Data Table on Chile - Year-over-year growth 2025-2030 (%)

12.8 Market opportunity by geography

Market opportunity by geography ($ million)
Data Tables on Market opportunity by geography ($ million)

13. Drivers, Challenges, and Opportunity

13.1 Market drivers

Increasing number of pet ownership
Shifting preference towards natural and organic pet care products
Rising disposable income enabling higher spending on pet care products

13.2 Market challenges

Volatility in raw material prices for pet food and grooming products
Stringent quality and safety regulations across developed markets
Limited awareness of consumers on pet care products in developing countries

13.3 Impact of drivers and challenges

Impact of drivers and challenges in 2025 and 2030

13.4 Market opportunities

Growth of e-commerce and direct-to-consumer channels for pet care products
Increasing adoption of personalized and functional pet nutrition
Expansion of sustainable and eco-friendly pet care product packaging

14. Competitive Landscape

14.1 Overview

14.2

Overview on criticality of inputs and factors of differentiation

14.3 Landscape disruption

Overview on factors of disruption

14.4 Industry risks

Impact of key risks on business

15. Competitive Analysis

15.1 Companies profiled

Companies covered

15.2 Company ranking index

15.3 Market positioning of companies

Matrix on companies position and classification

15.4 Blue Buffalo Co. Ltd.

Blue Buffalo Co. Ltd. - Overview
Blue Buffalo Co. Ltd. - Product / Service
Blue Buffalo Co. Ltd. - Key offerings
SWOT

15.5 Central Garden and Pet Co.

Central Garden and Pet Co. - Overview
Central Garden and Pet Co. - Business segments
Central Garden and Pet Co. - Key offerings
Central Garden and Pet Co. - Segment focus
SWOT

15.6 Diamond Pet Foods Inc.

Diamond Pet Foods Inc. - Overview
Diamond Pet Foods Inc. - Product / Service
Diamond Pet Foods Inc. - Key offerings
SWOT

15.7 Fromm Family Foods LLC

Fromm Family Foods LLC - Overview
Fromm Family Foods LLC - Product / Service
Fromm Family Foods LLC - Key offerings
SWOT

15.8 Hills Pet Nutrition Inc.

Hills Pet Nutrition Inc. - Overview
Hills Pet Nutrition Inc. - Product / Service
Hills Pet Nutrition Inc. - Key offerings
SWOT

15.9 Instinct Pet Food

Instinct Pet Food - Overview
Instinct Pet Food - Product / Service
Instinct Pet Food - Key offerings
SWOT

15.10 Mars Inc.

Mars Inc. - Overview
Mars Inc. - Product / Service
Mars Inc. - Key offerings
SWOT

15.11 Merrick Pet Care Inc.

Merrick Pet Care Inc. - Overview
Merrick Pet Care Inc. - Product / Service
Merrick Pet Care Inc. - Key offerings
SWOT

15.12 Nestle Purina PetCare Co.

Nestle Purina PetCare Co. - Overview
Nestle Purina PetCare Co. - Product / Service
Nestle Purina PetCare Co. - Key offerings
SWOT

15.13 Petmate

Petmate - Overview
Petmate - Product / Service
Petmate - Key offerings
SWOT

15.14 Rolf C. Hagen Inc.

Rolf C. Hagen Inc. - Overview
Rolf C. Hagen Inc. - Product / Service
Rolf C. Hagen Inc. - Key offerings
SWOT

15.15 Simmons Pet Food Inc.

Simmons Pet Food Inc. - Overview
Simmons Pet Food Inc. - Product / Service
Simmons Pet Food Inc. - Key offerings
SWOT

15.16 Solid Gold Pet LLC

Solid Gold Pet LLC - Overview
Solid Gold Pet LLC - Product / Service
Solid Gold Pet LLC - Key offerings
SWOT

15.17 Stella and Chewys LLC

Stella and Chewys LLC - Overview
Stella and Chewys LLC - Product / Service
Stella and Chewys LLC - Key offerings
SWOT

15.18 Wellness Pet Co. Inc.

Wellness Pet Co. Inc. - Overview
Wellness Pet Co. Inc. - Product / Service
Wellness Pet Co. Inc. - Key offerings
SWOT

16. Appendix

16.1 Scope of the report

Market definition
Objectives
Notes and caveats

16.2 Inclusions and exclusions checklist

Inclusions checklist
Exclusions checklist

16.3 Currency conversion rates for US$

16.4 Research methodology

16.5 Data procurement

Information sources

16.6 Data validation

16.7 Validation techniques employed for market sizing

16.8 Data synthesis

16.9 360 degree market analysis

16.10 List of abbreviations

Research Methodology

Technavio presents a detailed picture of the market by way of study, synthesis, and summation of data from multiple sources. The analysts have presented the various facets of the market with a particular focus on identifying the key industry influencers. The data thus presented is comprehensive, reliable, and the result of extensive research, both primary and secondary.

INFORMATION SOURCES

Primary sources

  • Manufacturers and suppliers
  • Channel partners
  • Industry experts
  • Strategic decision makers

Secondary sources

  • Industry journals and periodicals
  • Government data
  • Financial reports of key industry players
  • Historical data
  • Press releases

DATA ANALYSIS

Data Synthesis

  • Collation of data
  • Estimation of key figures
  • Analysis of derived insights

Data Validation

  • Triangulation with data models
  • Reference against proprietary databases
  • Corroboration with industry experts

REPORT WRITING

Qualitative

  • Market drivers
  • Market challenges
  • Market trends
  • Five forces analysis

Quantitative

  • Market size and forecast
  • Market segmentation
  • Geographical insights
  • Competitive landscape

Interested in this report?

Get your sample now to see our research methodology and insights!

Download Now

Frequently Asked Questions

Pet Care market growth will increase by USD 110.2 million during 2026-2030.

The Pet Care market is expected to grow at a CAGR of 7.4% during 2026-2030.

Pet Care market is segmented by Application (Dogs, Cats, Others) Product (Food, Accessories, Grooming) Distribution channel (Offline, Online)

Blue Buffalo Co. Ltd., Canidae Pet Food Co., Central Garden and Pet Co., Diamond Pet Foods Inc., Farmina Pet Foods, Fromm Family Foods LLC, Hills Pet Nutrition Inc., Instinct Pet Food, Mars Inc., Merrick Pet Care Inc., Natural Balance Pet Foods, Nestle Purina PetCare Co., Nulo Pet Food, Petmate, Rolf C. Hagen Inc., Simmons Pet Food Inc., Solid Gold Pet LLC, Stella and Chewys LLC, Wellness Pet Co. Inc., Zignature are a few of the key vendors in the Pet Care market.

North America will register the highest growth rate of 44% among the other regions. Therefore, the Pet Care market in North America is expected to garner significant business opportunities for the vendors during the forecast period.

US, Canada, Mexico, Germany, UK, France, Italy, Spain, The Netherlands, China, Japan, India, South Korea, Australia, Indonesia, South Africa, Saudi Arabia, UAE, Turkey, Israel, Brazil, Argentina, Chile

  • Increasing number of pet ownership is the driving factor this market.

The Pet Care market vendors should focus on grabbing business opportunities from the Application segment as it accounted for the largest market share in the base year.
RIA - Research AI Assistant
Ask RIA