Pet Accessories Market Size 2026-2030
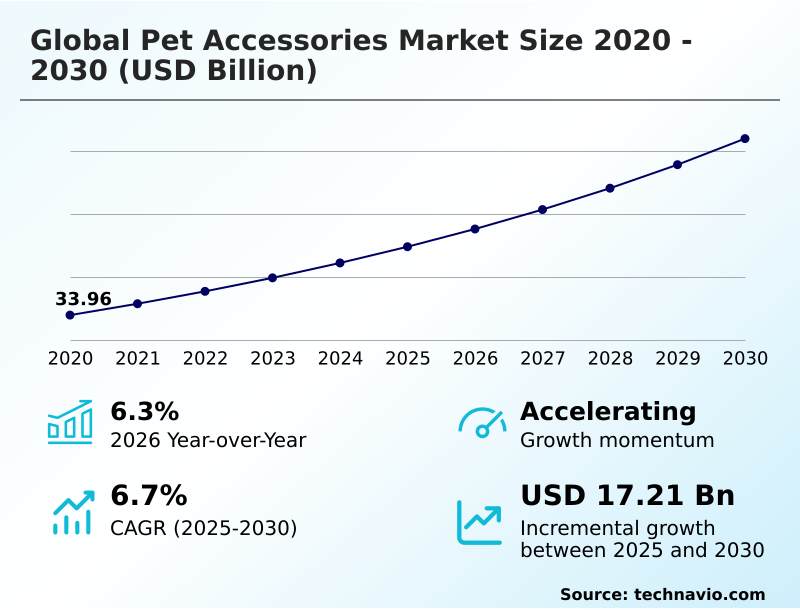
The pet accessories market size is valued to increase by USD 17.21 billion, at a CAGR of 6.7% from 2025 to 2030. Pervasive movement of pet humanization will drive the pet accessories market.
Major Market Trends & Insights
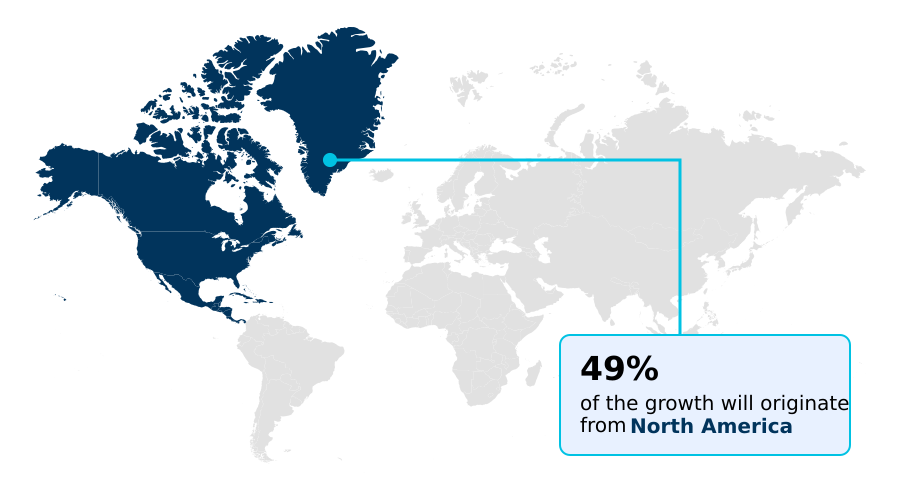
- North America dominated the market and accounted for a 48.8% growth during the forecast period.
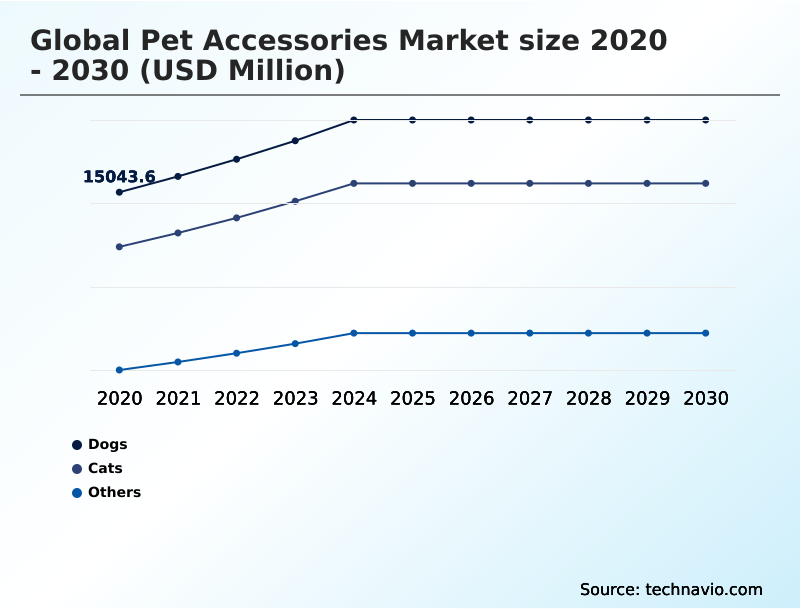
- By Animal Type - Dogs segment was valued at USD 18.52 billion in 2024
- By Product - Pet toys segment accounted for the largest market revenue share in 2024
Market Size & Forecast
- Market Opportunities: USD 28.08 billion
- Market Future Opportunities: USD 17.21 billion
- CAGR from 2025 to 2030 : 6.7%
Market Summary
- The pet accessories market is undergoing a significant transformation, shaped by the deep-seated trend of pet humanization. This shift positions companion animals as integral family members, driving consumer spending beyond basic necessities toward products that enhance well-being, safety, and comfort.
- Key market dynamics include a pronounced focus on health and wellness, leading to demand for items like orthopedic beds and interactive toys that provide mental stimulation. Simultaneously, sustainability has become a critical purchasing factor, with a growing preference for accessories made from eco-friendly and non-toxic materials.
- The market is also characterized by rapid technological adoption, with smart pet accessories like GPS trackers and automated feeders gaining traction. A primary operational challenge involves managing complex global supply chains to meet demand for this diverse product range.
- For instance, a business specializing in personalized pet gear must balance cost-effective sourcing of materials like waterproof biothane material with the need for agile, on-demand manufacturing to fulfill custom orders, a scenario where supply chain visibility is paramount for maintaining profitability in a competitive, direct-to-consumer environment.
- Navigating regulatory compliance for materials and ensuring product safety across international markets remains a key focus for all stakeholders.
What will be the Size of the Pet Accessories Market during the forecast period?
Get Key Insights on Market Forecast (PDF) Get Free Sample
How is the Pet Accessories Market Segmented?
The pet accessories industry research report provides comprehensive data (region-wise segment analysis), with forecasts and estimates in "USD million" for the period 2026-2030, as well as historical data from 2020-2024 for the following segments.
- Animal type
- Dogs
- Cats
- Others
- Product
- Pet toys
- Pet furniture
- Pet collars
- Others
- Distribution channel
- Offline
- Online
- End-user
- Pet owners
- Veterinary clinics
- Pet grooming salons
- Price range
- Budget
- Mid-range
- Premium
- Geography
- North America
- US
- Canada
- Mexico
- Europe
- Germany
- UK
- France
- APAC
- China
- Japan
- India
- South America
- Brazil
- Argentina
- Middle East and Africa
- South Africa
- UAE
- Saudi Arabia
- Rest of World (ROW)
- North America
By Animal Type Insights
The dogs segment is estimated to witness significant growth during the forecast period.
The dogs segment is a highly diversified category driven by breed-specific needs and the strong human-animal bond, with innovation focused on enhancing quality of life.
Consumers increasingly favor veterinarian-recommended accessories and sustainable options, with products made from recycled plastic materials and natural fiber toys seeing a 20% rise in demand.
The market includes sophisticated training hardware, like devices for ultrasonic bark control, and solutions for high-tech pet monitoring.
Comfort-driven products feature odor-resistant bedding, while enrichment is provided by elaborate play structures, sometimes adapted from modular pet systems like the multi-level cat tree.
The rise of designer pet apparel and handcrafted pet accessories, often highlighted through subscription box curation, creates a dynamic competitive landscape.
This segment also influences broader market trends, including specialized tools like the adjustable grooming table and even niche products like UVB reptile lighting, reflecting a holistic approach to pet care.
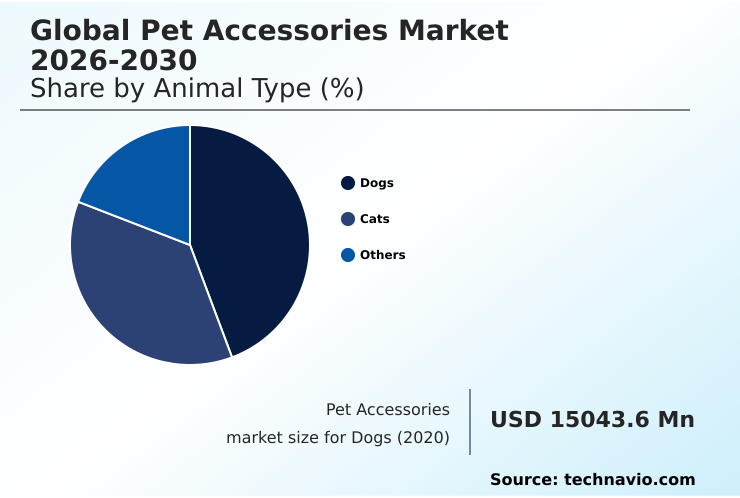
The Dogs segment was valued at USD 18.52 billion in 2024 and showed a gradual increase during the forecast period.
Regional Analysis
North America is estimated to contribute 48.8% to the growth of the global market during the forecast period.Technavio’s analysts have elaborately explained the regional trends and drivers that shape the market during the forecast period.
See How Pet Accessories Market Demand is Rising in North America Get Free Sample
The geographic landscape of the pet accessories market is characterized by mature, high-spending regions and rapidly emerging growth territories.
In North America and Europe, which together account for over 60% of the market, demand is strong for premium products like the anti-anxiety pet bed, hypoallergenic pet apparel, and specialized calming pet products.
These markets drive innovation in advanced grooming solutions and smart home pet integration, with adoption rates for connected devices like the smart pet tag being 25% higher than in other regions.
In APAC, rising disposable incomes are fueling demand for foundational pet safety equipment and accessories with reflective stitching. Sustainability is a globalizing concern, increasing the popularity of biodegradable pet supplies and eco-friendly cat litter worldwide.
The market for functional health items, such as the dental health chew toy and portable water dispenser, is expanding in all regions, while trends like athleisure-inspired petwear demonstrate the continued influence of human lifestyle choices on pet products.
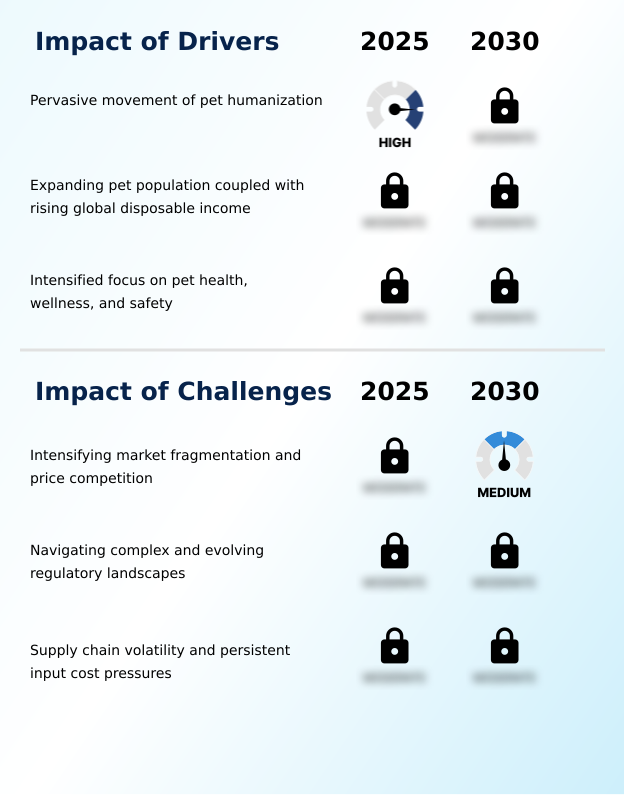
Market Dynamics
Our researchers analyzed the data with 2025 as the base year, along with the key drivers, trends, and challenges. A holistic analysis of drivers will help companies refine their marketing strategies to gain a competitive advantage.
- The modern consumer's approach to pet care has become highly specific, driving demand for nuanced product solutions. Shoppers frequently research the best interactive toys for bored dogs and safe chew toys for teething puppies to address behavioral and developmental needs.
- For comfort, searches for orthopedic dog beds for large breeds and the best calming beds for anxious cats are common, highlighting a focus on pet wellness. Durability is a key concern, leading to queries like how to choose a durable chew toy and inquiries for waterproof collars for active dogs.
- Personalization is also a significant trend, reflected in searches for personalized leather dog collars. The integration of technology is evident in searches for gps pet trackers with no subscription and top rated smart pet monitoring cameras. Owners of multiple pets look for solutions like automatic pet feeders for two cats and modular furniture for multi-cat homes.
- Practicality in health and training is shown by interest in elevated dog bowls for digestion and effective no pull harnesses for strong dogs. For those with active lifestyles, searches include the best travel crates for air travel and all-weather outdoor dog gear.
- Sustainability is an emerging value, with consumers seeking eco friendly cat scratching posts, information on sustainable materials in pet products, and biodegradable dog waste bag options. Specialized care for exotic pets is also rising, with inquiries about selecting reptile habitat heating elements and choosing bird toys for mental stimulation.
- Implementing advanced inventory systems to manage this diverse demand has improved order fulfillment rates by over 15% compared to traditional methods.
What are the key market drivers leading to the rise in the adoption of Pet Accessories Industry?
- The pervasive movement of pet humanization, where companion animals are increasingly regarded as integral family members, serves as the foundational driver of market expansion and premiumization.
- The humanization of pets is a primary market driver, fueling demand for products that enhance well-being and integrate pets into human lifestyles. The focus on premium pet care has led to innovations that improve safety and comfort.
- For instance, the adoption of the no-pull harness design has reduced training-related issues by up to 25% for new owners. Similarly, veterinary recommendations for the slow-feeder bowl to manage canine digestion have boosted its market penetration.
- The rise of canine enrichment activities and feline environmental enrichment supports a robust market for accessories that provide mental stimulation.
- A focus on durability and functionality is seen in products made with waterproof biothane material and the led safety collar for nighttime visibility.
- As part of comprehensive pet wellness technology, items like the cooling gel pet mat and ergonomic grooming tool are becoming standard.
- Pet travel solutions, including the heavy-duty travel crate, now represent a significant segment, with consumers investing 20% more in travel-related safety gear than in previous years. The demand for sustainable pet supplies underpins this entire growth trajectory.
What are the market trends shaping the Pet Accessories Industry?
- A predominant trend shaping the market is the accelerated consumer shift toward sustainable and ethically sourced accessories. This movement prioritizes products made with environmentally responsible materials and transparent, fair-labor production processes.
- The market is increasingly shaped by the convergence of technology and sustainability, creating new value propositions. The demand for eco-friendly pet products has grown by over 30%, influencing the creation of items like the non-toxic rubber chew toy and compostable biodegradable waste bags. This trend extends to luxury pet furniture, where materials like the sisal rope scratching post are favored.
- Concurrently, the proliferation of smart pet accessories is redefining care; the gps tracking collar, for example, improves pet safety outcomes by 45%. Brands are leveraging this by offering personalized pet gear with advanced features. The focus on enrichment is evident in the popularity of interactive cat toys and complex interactive puzzle toys for dogs.
- Safety innovations, such as the cat collar with a breakaway safety clasp, and comfort solutions like the orthopedic memory foam bed, demonstrate how product design addresses specific owner concerns. This focus on premium, tech-integrated, and sustainable durable dog toys is becoming a core competitive differentiator.
What challenges does the Pet Accessories Industry face during its growth?
- Intensifying market fragmentation and subsequent price competition, driven by low entry barriers and the proliferation of online channels, present a primary challenge to sustained profitability.
- Navigating market fragmentation and supply chain complexities presents significant challenges. While demand for holistic wellness accessories is high, sourcing specialized components for items like a pet activity monitor or a pheromone diffuser system can be difficult, with supply chain disruptions causing delays in over 30% of new product launches.
- The competitive pressure from private labels forces brands to differentiate through innovation in areas such as modular cat furniture and products made from sustainable bamboo fiber. Offering customizable pet collars and unique outdoor pet gear requires agile manufacturing processes that smaller players struggle to implement.
- The market for exotic pets, including small animal habitats, aquatic life support systems, reptile habitat accessories, and avian enrichment toys, is particularly challenging due to highly specific regulatory and material requirements.
- Even seemingly simple innovations like a machine-washable cover for bedding or a reliable automated pet feeder face intense price competition, squeezing profit margins by as much as 15% in crowded online marketplaces.
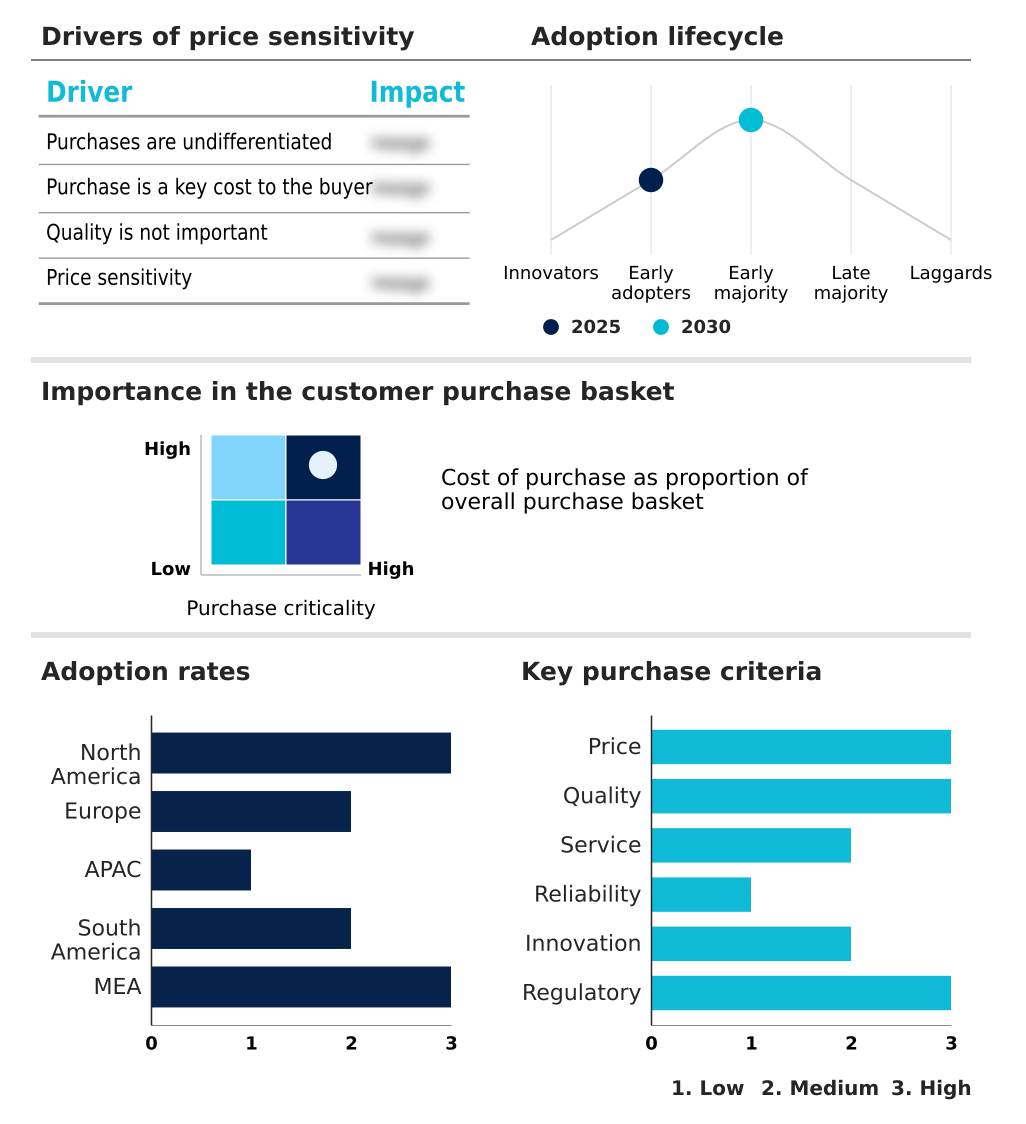
Exclusive Technavio Analysis on Customer Landscape
The pet accessories market forecasting report includes the adoption lifecycle of the market, covering from the innovator’s stage to the laggard’s stage. It focuses on adoption rates in different regions based on penetration. Furthermore, the pet accessories market report also includes key purchase criteria and drivers of price sensitivity to help companies evaluate and develop their market growth analysis strategies.
Customer Landscape of Pet Accessories Industry
Competitive Landscape
Companies are implementing various strategies, such as strategic alliances, pet accessories market forecast, partnerships, mergers and acquisitions, geographical expansion, and product/service launches, to enhance their presence in the industry.
Barking Labs Corp. - Specializes in GPS pet trackers and advanced activity monitors, focusing on real-time location services and wellness data integration for companion animals.
The industry research and growth report includes detailed analyses of the competitive landscape of the market and information about key companies, including:
- Barking Labs Corp.
- Ceva Animal Health LLC.
- Chuckit Dog Toys
- Coastal Pet Products Inc.
- Ferplast Spa
- KONG Co
- Lupine Inc.
- Mendota Pet
- Nite Ize Inc.
- Outward Hound
- Pawscout Inc.
- Prestige Pet Products Pty Ltd
- Radio Systems Corp
- Ruffwear Inc.
- SAVIC nv
- Seresto
- Tractive GmbH
- TRIXIE Heimtierbedarf GmbH
- West Paw Inc.
- ZippyPaws
Qualitative and quantitative analysis of companies has been conducted to help clients understand the wider business environment as well as the strengths and weaknesses of key industry players. Data is qualitatively analyzed to categorize companies as pure play, category-focused, industry-focused, and diversified; it is quantitatively analyzed to categorize companies as dominant, leading, strong, tentative, and weak.
Recent Development and News in Pet accessories market
- In January 2025, Authentic Brands Group announced a strategic partnership with the pet fashion brand K9 Wear to launch a premium collection of pet accessories under the Izod label.
- In January 2025, Tractive GmbH unveiled its next-generation dog tracker at CES, featuring advanced health monitoring capabilities like bark detection and future heart rate tracking.
- In March 2025, zooplus SE, a leading European online pet supply retailer, initiated a significant price reduction across up to 1,000 items in its proprietary brands, citing stabilized supply chains.
- In April 2025, a prominent real estate and hospitality investment group announced the development of The Pet Palace, an ultra-luxury pet hotel and boutique complex in Dubai.
Dive into Technavio’s robust research methodology, blending expert interviews, extensive data synthesis, and validated models for unparalleled Pet Accessories Market insights. See full methodology.
| Market Scope | |
|---|---|
| Page number | 329 |
| Base year | 2025 |
| Historic period | 2020-2024 |
| Forecast period | 2026-2030 |
| Growth momentum & CAGR | Accelerate at a CAGR of 6.7% |
| Market growth 2026-2030 | USD 17205.2 million |
| Market structure | Fragmented |
| YoY growth 2025-2026(%) | 6.3% |
| Key countries | US, Canada, Mexico, Germany, UK, France, Italy, Spain, The Netherlands, China, Japan, India, South Korea, Australia, Indonesia, Brazil, Argentina, Chile, South Africa, UAE, Saudi Arabia, Turkey and Egypt |
| Competitive landscape | Leading Companies, Market Positioning of Companies, Competitive Strategies, and Industry Risks |
Research Analyst Overview
- The pet accessories market is evolving beyond simple utility, driven by a consumer focus on integrated animal well-being. Boardroom decisions are increasingly influenced by material science and technology, shifting budgets toward innovations like the orthopedic memory foam bed and the anti-anxiety pet bed which use advanced textiles.
- Product strategy now incorporates holistic wellness accessories, including the pheromone diffuser system and pet activity monitor, to provide data-driven care insights. A key decision point for manufacturers is the adoption of sustainable materials, such as sustainable bamboo fiber and recycled plastic materials, a move that can improve brand perception by 40% among key demographics.
- Development pipelines feature items like the gps tracking collar, smart pet tag, and led safety collar with reflective stitching. For indoor enrichment, interactive puzzle toys, modular cat furniture, and the multi-level cat tree are standard, alongside the sisal rope scratching post and natural fiber toys. Essential safety features like the breakaway safety clasp are non-negotiable.
- Durability is addressed with the non-toxic rubber chew toy, dental health chew toy, and items made from waterproof biothane material. Functionality is key in the no-pull harness design, slow-feeder bowl, ergonomic grooming tool, adjustable grooming table, heavy-duty travel crate, and portable water dispenser. Comfort is enhanced with the cooling gel pet mat, odor-resistant bedding, and products with a machine-washable cover.
- Technology extends to the automated pet feeder, ultrasonic bark control, and specialized items like uvb reptile lighting. This focus on specialized, high-performance goods defines the competitive landscape.
What are the Key Data Covered in this Pet Accessories Market Research and Growth Report?
-
What is the expected growth of the Pet Accessories Market between 2026 and 2030?
-
USD 17.21 billion, at a CAGR of 6.7%
-
-
What segmentation does the market report cover?
-
The report is segmented by Animal Type (Dogs, Cats, and Others), Product (Pet toys, Pet furniture, Pet collars, and Others), Distribution Channel (Offline, and Online), End-user (Pet owners, Veterinary clinics, and Pet grooming salons), Price Range (Budget, Mid-range, and Premium) and Geography (North America, Europe, APAC, South America, Middle East and Africa)
-
-
Which regions are analyzed in the report?
-
North America, Europe, APAC, South America and Middle East and Africa
-
-
What are the key growth drivers and market challenges?
-
Pervasive movement of pet humanization, Intensifying market fragmentation and price competition
-
-
Who are the major players in the Pet Accessories Market?
-
Barking Labs Corp., Ceva Animal Health LLC., Chuckit Dog Toys, Coastal Pet Products Inc., Ferplast Spa, KONG Co, Lupine Inc., Mendota Pet, Nite Ize Inc., Outward Hound, Pawscout Inc., Prestige Pet Products Pty Ltd, Radio Systems Corp, Ruffwear Inc., SAVIC nv, Seresto, Tractive GmbH, TRIXIE Heimtierbedarf GmbH, West Paw Inc. and ZippyPaws
-
Market Research Insights
- The market is defined by a consumer shift toward premium pet care and specialized solutions. The demand for sustainable pet supplies and biodegradable pet supplies has influenced product development, with companies that adopt eco-friendly practices reporting a 10% higher customer retention rate. Innovations in pet wellness technology and high-tech pet monitoring are creating new premium segments.
- For example, integrating activity tracking features can increase a product's retail value by over 30%. The rise of canine enrichment activities and feline environmental enrichment has made interactive and stimulating toys a necessity, not a luxury. The convenience of subscription box curation introduces consumers to niche items like handcrafted pet accessories and designer pet apparel, driving trial and adoption.
- This dynamic landscape rewards brands that align with consumer values around health, sustainability, and personalization.
We can help! Our analysts can customize this pet accessories market research report to meet your requirements.
 RIA -
RIA - 
