Europe Road Freight Transportation Market Size 2025-2029
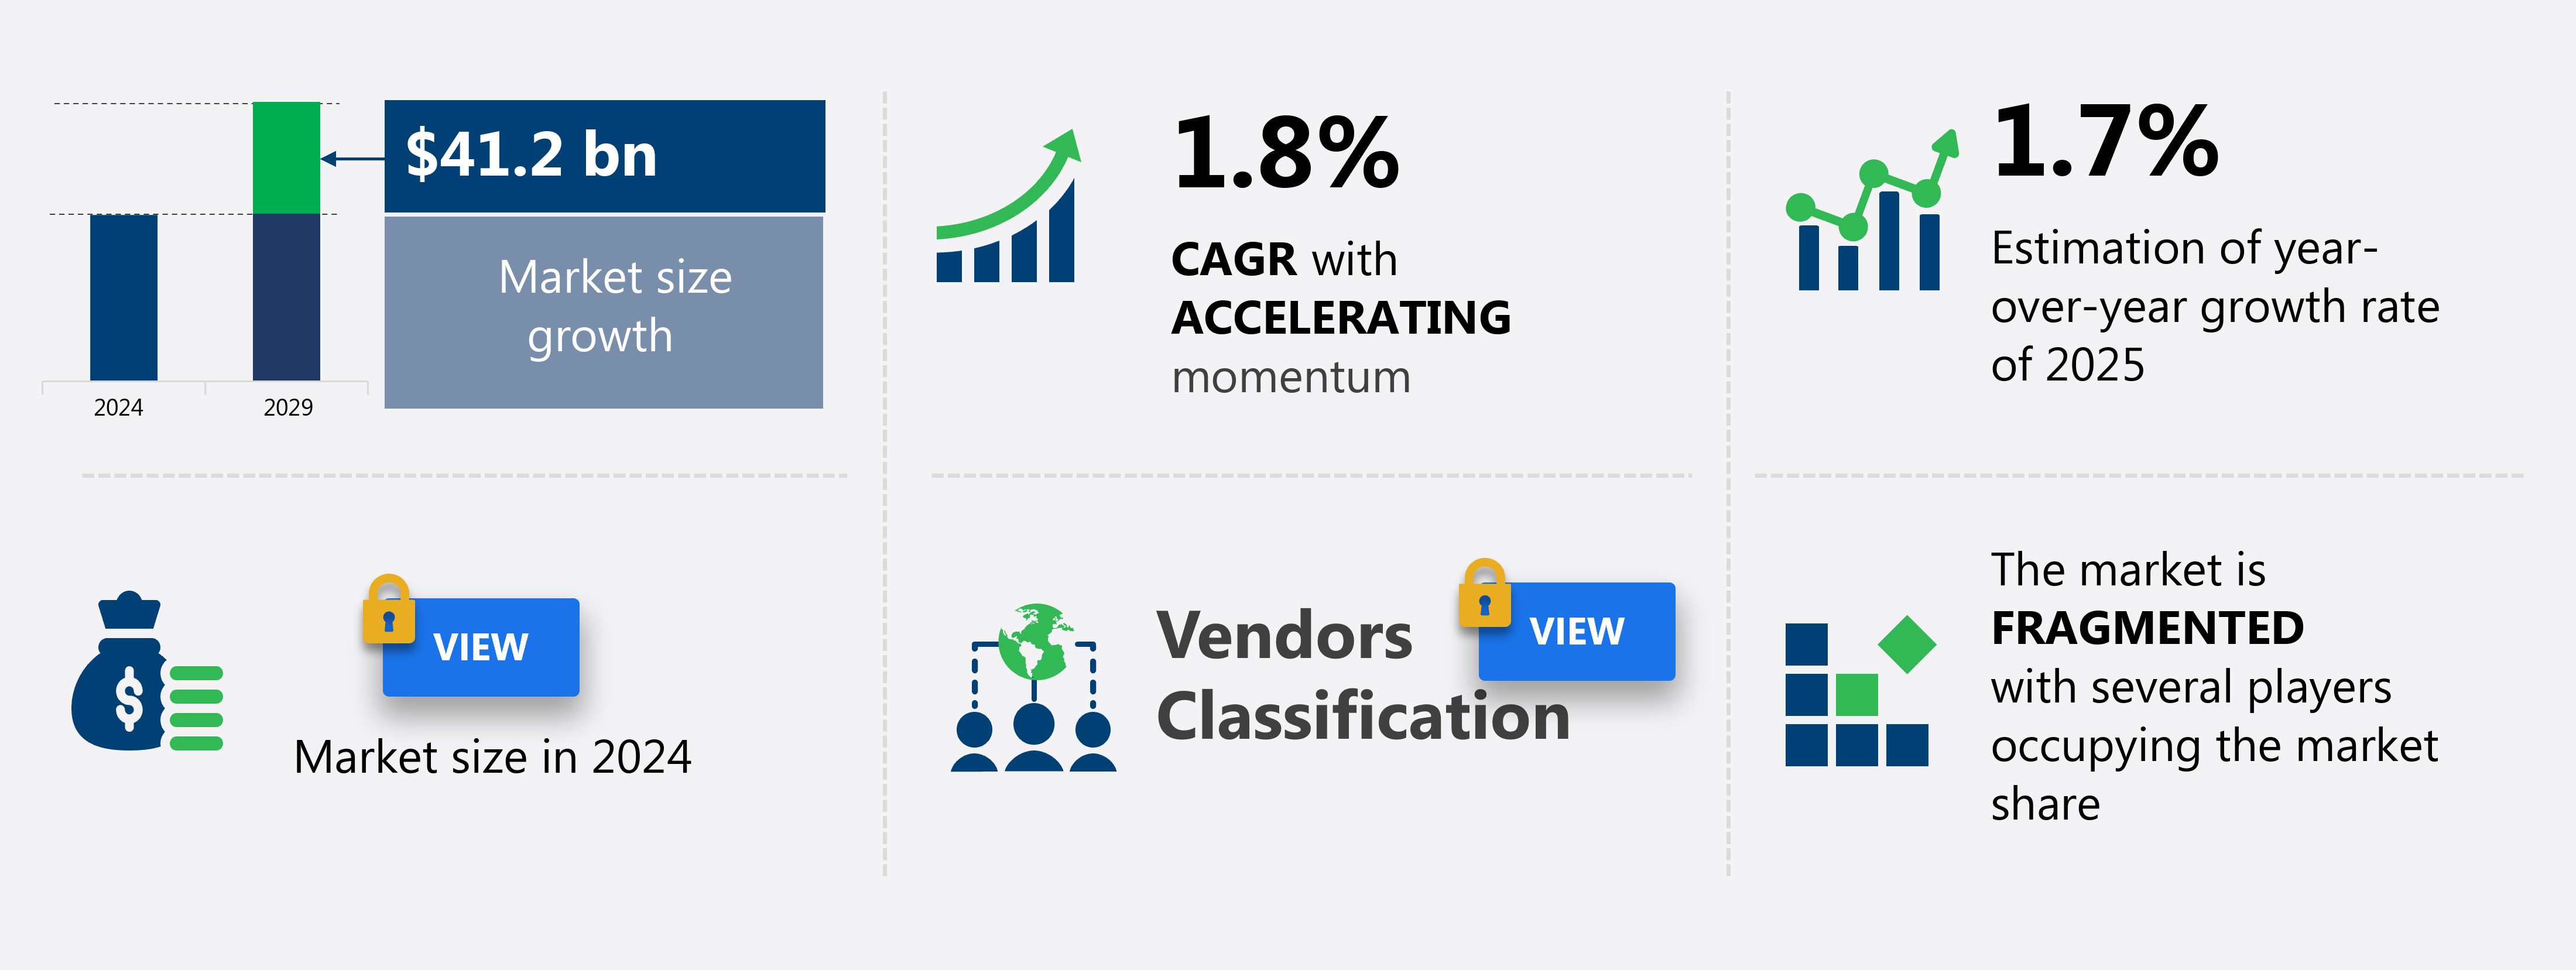
The Europe road freight transportation market size is forecast to increase by USD 41.2 billion at a CAGR of 1.8% between 2024 and 2029.
- The European road freight transportation market is characterized by its significant role in intermodal transportation and the ongoing digital transformation. Road freight remains a cornerstone of logistics networks due to its flexibility, efficiency, and extensive coverage. However, this market faces increasing competitive pressure and higher operational costs, which necessitate continuous improvement and innovation. The digital transformation in road freight transportation is reshaping business models and operations. Advanced technologies, such as real-time tracking, route optimization, and predictive analytics, enable carriers to enhance service quality, reduce costs, and improve customer satisfaction. Furthermore, the integration of digital platforms and automation tools facilitates seamless collaboration between shippers, carriers, and consignees, creating a more efficient and interconnected logistics ecosystem.
- Despite these opportunities, road freight transportation faces challenges that require strategic navigation. Competitive pricing puts pressure on margins, necessitating cost optimization and productivity enhancements. Additionally, regulatory compliance and environmental concerns, such as emissions regulations and fuel taxes, add to the operational burden. To capitalize on the market's potential and navigate these challenges effectively, companies must focus on digitalization, operational efficiency, and sustainable transformation practices.
What will be the size of the Europe Road Freight Transportation Market during the forecast period?
Explore in-depth regional segment analysis with market size data - historical 2019-2023 and forecasts 2025-2029 - in the full report.
Request Free Sample
- In Europe's international freight market, delivery timeliness and customer service remain top priorities for businesses. E-commerce logistics has driven significant growth, leading to increased capacity planning and delivery optimization. Cost optimization is also crucial, with companies exploring carbon offsetting and digital freight marketplaces for real-time pricing. Driver training and fleet telematics ensure operational efficiency, while risk management and disruption management are essential for supply chain resilience. Cross-border shipping faces challenges due to customs clearance, but advancements in digital technologies like blockchain and smart contracts streamline the process. Sustainability initiatives, such as electric truck infrastructure and battery technology, are gaining traction, with geolocation services and route planning key to reducing carbon emissions.
- Freight insurance, logistics optimization, and data analytics are other critical areas of focus. Autonomous trucking and dynamic pricing are emerging trends, with artificial intelligence and smart contracts shaping the future of freight forwarding platforms. Supply chain visibility is paramount, with multimodal transport and order fulfillment relying on inventory management and delivery reliability. Customs clearance and charging stations are essential components of the electric truck infrastructure, ensuring seamless transportation and reducing the carbon footprint.
How is this market segmented?
The market research report provides comprehensive data (region-wise segment analysis), with forecasts and estimates in "USD billion" for the period 2025-2029, as well as historical data from 2019-2023 for the following segments.
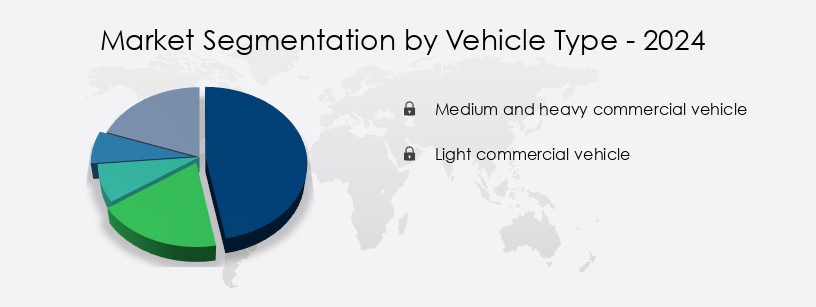
- Vehicle Type
- Medium and heavy commercial vehicle
- Light commercial vehicle
- Product
- Food and beverages
- Metals and mining
- Dangerous goods
- Agriculture
- Others
- End-User
- Agriculture
- Fishing
- Forestry
- Construction
- Manufacturing
- Pipe
- Destination
- Domestic
- International
- Container Type
- Containerized
- Non-Containerized
- Geography
- Europe
- France
- Germany
- Spain
- UK
- Europe
By Vehicle Type Insights
The medium and heavy commercial vehicle segment is estimated to witness significant growth during the forecast period.
The European road freight transportation market is characterized by the significant role of medium and heavy commercial vehicles, which cater to diverse cargo needs. Leading manufacturers like Volvo, DAF Trucks, and Mercedes-Benz dominate this sector, offering advanced models with increased payload capacity, improved fuel efficiency, and emissions compliance. The market is driven by the e-commerce sector's growth, necessitating efficient logistics solutions. However, challenges include the development of alternative fuel infrastructure and driver shortages. Sustainability is a growing priority, with electric and hybrid vehicles gaining traction to meet stringent environmental regulations. Innovations such as real-time tracking, digital freight platforms, and route optimization contribute to operational efficiency and safety.
The market is also witnessing the integration of rail freight, intermodal transportation, and sea freight to reduce carbon emissions. Logistics services, freight forwarding, and freight consolidation play crucial roles in managing complex supply chains. Temperature-controlled transport, hazardous goods transport, and last-mile delivery are other essential services. The market is further shaped by the adoption of transportation management systems, delivery scheduling, and emissions reduction strategies. Digital freight brokerage and third-party logistics facilitate efficient load matching and freight rate negotiations. The future of the market lies in the integration of autonomous vehicles, shipping containers, and pallet networks for oversized cargo transport.
Electric trucks and intermodal terminals are also poised to play significant roles in the evolving landscape.
The Medium and heavy commercial vehicle segment was valued at USD billion in 2019 and showed a gradual increase during the forecast period.
Market Dynamics
Our researchers analyzed the data with 2024 as the base year, along with the key drivers, trends, and challenges. A holistic analysis of drivers will help companies refine their marketing strategies to gain a competitive advantage.
What are the Europe Road Freight Transportation Market market drivers leading to the rise in adoption of the Industry?
- The significance of road freight in intermodal transportation is pivotal, driving market growth through its efficient and cost-effective capabilities in transporting goods over long distances.
- Road freight transportation plays a significant role in Europe's intermodal logistics network, connecting various modes of transportation for the movement of goods. The European road freight market is characterized by the extensive use of trucks for transporting various types of cargo, including full truckloads, box trucks, refrigerated trucks, pallet networks, and oversized cargo. Labor costs are a critical factor influencing the European road freight transportation market. The increasing labor costs have led to the adoption of digital freight brokerage platforms and third-party logistics providers to optimize operations and reduce costs. Additionally, the emergence of advanced technologies, such as autonomous vehicles and shipping containers, is transforming the European road freight transportation landscape.
- Autonomous vehicles are expected to revolutionize the road freight transportation industry by reducing labor costs and increasing efficiency. Shipping containers are also gaining popularity due to their ability to transport large volumes of cargo over long distances. Pallet networks and full truckload services cater to different market segments based on cargo size and delivery requirements. The European road freight transportation market is a dynamic and evolving industry driven by various factors, including labor costs, technological advancements, and changing market demands. Road freight transportation continues to be a critical component of Europe's intermodal logistics network, enabling the efficient and cost-effective movement of goods across the continent.
What are the Europe Road Freight Transportation Market market trends shaping the Industry?
- The digital transformation in road freight transportation is an emerging market trend. This sector is increasingly adopting advanced technologies to enhance efficiency, reduce costs, and improve customer service.
- The European road freight transportation market is undergoing digital transformation, significantly impacting supply chain management. Heavy-duty vehicles are being integrated with advanced technologies like artificial intelligence (AI), the Internet of Things (IoT), data analytics, and blockchain. These technologies enhance efficiency, transparency, and responsiveness. Real-time tracking and remote monitoring of trucks and trailers are made possible through the IoT. Digital freight platforms facilitate load matching and freight consolidation, optimizing resource allocation and reducing empty miles. Freight forwarding and logistics services are streamlined, ensuring timely and cost-effective deliveries.
- Refrigerated transport and air freight operations also benefit from digitalization, enabling real-time temperature monitoring and seamless communication among stakeholders. Fuel costs, a significant concern in the industry, can be managed more effectively through data analytics and predictive insights. Overall, the digital transformation of road freight transportation in Europe is revolutionizing the industry, making it more efficient, transparent, and responsive.
How does Europe Road Freight Transportation Market market faces challenges face during its growth?
- The competitive pricing pressures and elevated operational costs associated with road freight transportation pose a significant challenge to the industry's growth trajectory.
- The European road freight transportation market faces significant challenges due to volatile fuel prices, which account for a substantial portion of operational expenses. The unpredictability of crude oil prices, as demonstrated by events such as the 2021 Suez Canal blockage, can lead to sudden increases in operational costs for carriers, negatively impacting profitability. This instability makes it difficult for enterprises to create accurate budgets, plan for long-term investments, and offer competitive pricing. To mitigate these challenges, companies are exploring alternative transportation methods, such as intermodal transportation and rail freight, to reduce reliance on road freight and fuel costs.
- Additionally, the adoption of electric vehicles and temperature-controlled transport is gaining traction to decrease carbon emissions and improve sustainability. Fleet management, route optimization, and transportation management systems are essential tools for carriers to minimize expenses and enhance efficiency. The integration of intermodal terminals into the delivery networks can streamline the transportation process, reduce handling costs, and improve overall logistics performance. Driver shortages remain a persistent issue, with the European Union estimating a shortfall of 450,000 drivers by 2030. To address this challenge, carriers are investing in training programs, offering competitive wages, and implementing advanced technologies, such as automated vehicles, to increase productivity and attract new talent.
- The European road freight transportation market is subject to various challenges, including fuel price volatility, driver shortages, and the need for sustainability. To remain competitive, carriers must adapt to these challenges by exploring alternative transportation methods, investing in technology, and focusing on operational efficiency.
Exclusive Europe Road Freight Transportation Market Customer Landscape
The market forecasting report includes the adoption lifecycle of the market, covering from the innovator's stage to the laggard's stage. It focuses on adoption rates in different regions based on penetration. Furthermore, the report also includes key purchase criteria and drivers of price sensitivity to help companies evaluate and develop their market growth analysis strategies.
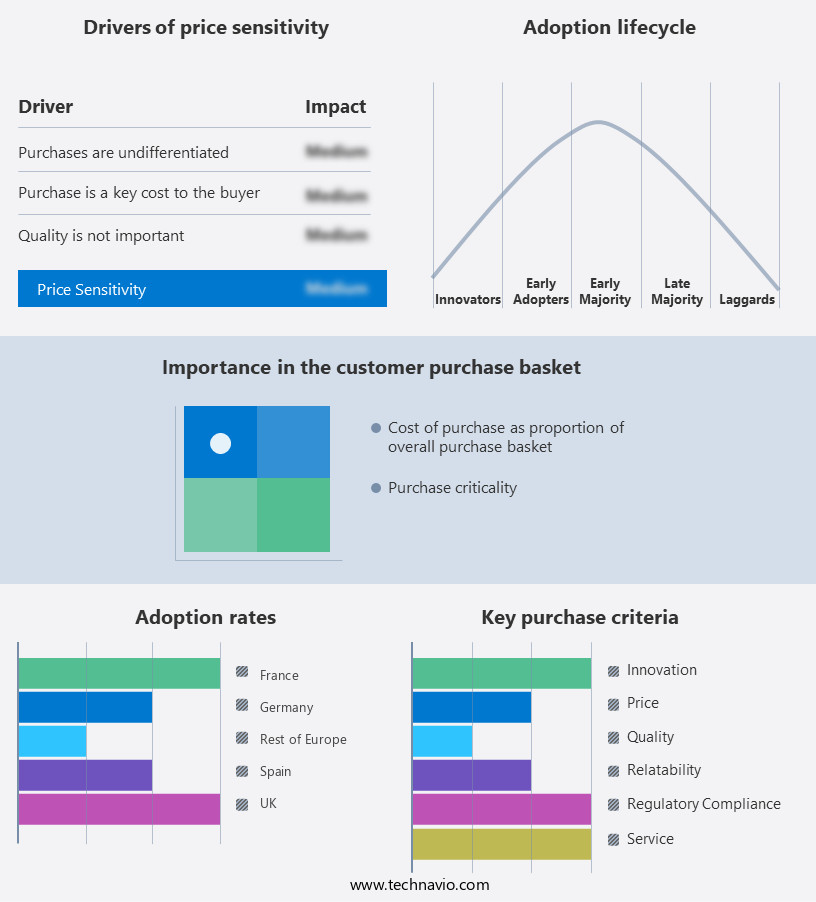
Customer Landscape
Key Companies & Market Insights
Companies are implementing various strategies, such as strategic alliances, market forecast partnerships, mergers and acquisitions, geographical expansion, and product/service launches, to enhance their presence in the market.
The market research and growth report includes detailed analyses of the competitive landscape of the market and information about key companies, including:
- AP Moller Maersk AS
- CEVA Logistics
- DACHSER SE
- DB Schenker
- Deutsche Bahn AG
- Deutsche Post AG
- DSV AS
- Ewals Cargo Care Holdings BV
- FedEx Corp.
- GEODIS
- H.Essers
- Hellmann Worldwide Logistics SE and Co KG
- Kuehne Nagel Management AG
- MARITIMA SURESTE SHIPPING SLU
- Raben Group
- Rhenus SE and Co. KG
- Schneider and Cie. AG
- UAB Girteka Logistics
- XPO Inc.
- Ziegler Group Corp.
Qualitative and quantitative analysis of companies has been conducted to help clients understand the wider business environment as well as the strengths and weaknesses of key market players. Data is qualitatively analyzed to categorize companies as pure play, category-focused, industry-focused, and diversified; it is quantitatively analyzed to categorize companies as dominant, leading, strong, tentative, and weak.
Recent Development and News in Road Freight Transportation Market In Europe
- In March 2023, DB Schenker, a leading global logistics provider, announced the launch of its new multimodal platform, "One Logistics Platform," in Europe. This innovative solution aims to digitize and simplify the logistics process by offering customers a single entry point for road, rail, air, and sea freight services (DB Schenker press release).
- In June 2024, DHL and Maersk, two industry giants, joined forces to form a strategic partnership. This collaboration focuses on integrating DHL's road freight capabilities with Maersk's ocean freight offerings, aiming to provide customers with a seamless end-to-end logistics solution (Reuters).
- In September 2024, Kuehne + Nagel, a global logistics company, completed the acquisition of a significant stake in C.H. Robinson's European overland business. This move strengthens Kuehne + Nagel's position in the European road freight market and expands its network (Wall Street Journal).
- In January 2025, the European Union approved the Green Deal Industrial Plan, which includes a significant investment in alternative fuels infrastructure and the promotion of sustainable road freight transportation. This initiative is expected to boost the adoption of electric and hydrogen trucks in Europe (European Commission press release).
Research Analyst Overview
In Europe's vibrant road freight transportation market, various elements continue to shape and reshape the landscape. Heavy-duty vehicles and truck trailers form the backbone of this sector, with supply chain management ensuring seamless integration and optimal performance. Real-time tracking and digital freight platforms streamline operations, while fuel costs remain a significant factor influencing market dynamics. Load matching, freight forwarding, and freight consolidation are essential services that enhance efficiency and reduce costs. Refrigerated transport and air freight cater to specific sectors, with logistics services and freight exchanges facilitating the movement of goods. Delivery networks, intermodal terminals, and fleet management are integral components of the intricate web of transportation systems.
Electric vehicles, rail freight, and temperature-controlled transport are gaining traction as sustainability concerns and emissions reduction efforts take center stage. Carbon emissions, driver shortages, and route optimization are key challenges that require continuous attention. The integration of electric vehicles, intermodal transportation, and autonomous vehicles is transforming the sector, with safety standards and labor costs shaping the future of the industry. Full truckload, distribution centers, and last mile delivery are critical aspects of the road freight transportation market, with digital freight brokerage, third-party logistics, and pallet networks playing pivotal roles in optimizing operations. The ongoing evolution of this market encompasses various sectors, from box trucks and refrigerated trucks to oversized cargo transport and hazardous goods transport.
The future of road freight transportation in Europe remains dynamic and interconnected, with continuous innovation and adaptation shaping its trajectory.
Dive into Technavio's robust research methodology, blending expert interviews, extensive data synthesis, and validated models for unparalleled Road Freight Transportation Market in Europe insights. See full methodology.
|
Market Scope |
|
|
Report Coverage |
Details |
|
Page number |
183 |
|
Base year |
2024 |
|
Historic period |
2019-2023 |
|
Forecast period |
2025-2029 |
|
Growth momentum & CAGR |
Accelerate at a CAGR of 1.8% |
|
Market growth 2025-2029 |
USD 41.2 billion |
|
Market structure |
Fragmented |
|
YoY growth 2024-2025(%) |
1.7 |
|
Competitive landscape |
Leading Companies, Market Positioning of Companies, Competitive Strategies, and Industry Risks |
What are the Key Data Covered in this Market Research Report?
- CAGR of the market during the forecast period
- Detailed information on factors that will drive the market growth and forecasting between 2025 and 2029
- Precise estimation of the size of the market and its contribution of the market in focus to the parent market
- Accurate predictions about upcoming market growth and trends and changes in consumer behaviour
- Growth of the market across Europe
- Thorough analysis of the market's competitive landscape and detailed information about companies
- Comprehensive analysis of factors that will challenge the growth of market companies
We can help! Our analysts can customize this market research report to meet your requirements Get in touch