Transportation Management Systems Market Analysis, Size, and Forecast 2026-2030: North America (US, Canada, and Mexico), Europe (Germany, France, and UK), APAC (China, India, and Japan), Middle East and Africa (Saudi Arabia, UAE, and South Africa), South America (Brazil and Colombia), and Rest of World (ROW)

Transportation Management Systems Market Analysis, Size, and Forecast 2026-2030:
North America (US, Canada, and Mexico), Europe (Germany, France, and UK), APAC (China, India, and Japan), Middle East and Africa (Saudi Arabia, UAE, and South Africa), South America (Brazil and Colombia), and Rest of World (ROW)

Published: Mar 2026 305 Pages SKU: IRTNTR43299

Market Overview at a Glance

$5.48 B
Market Opportunity
12.1%
CAGR 2025 - 2030
36.7%
North America Growth
$3.99 B
On-premises segment 2024

Transportation Management Systems Market Size 2026-2030

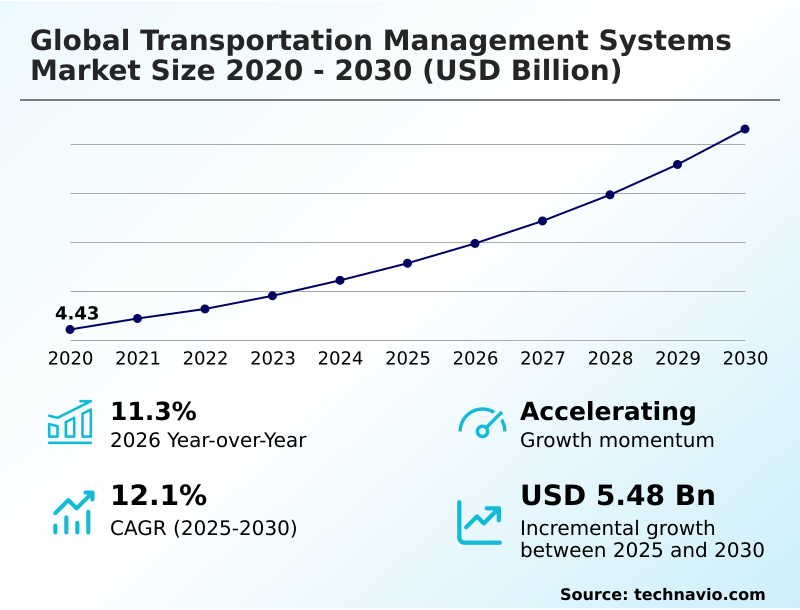
The transportation management systems market size is valued to increase by USD 5.48 billion, at a CAGR of 12.1% from 2025 to 2030. Increasing adoption of AI and machine learning for predictive logistics will drive the transportation management systems market.

Major Market Trends & Insights

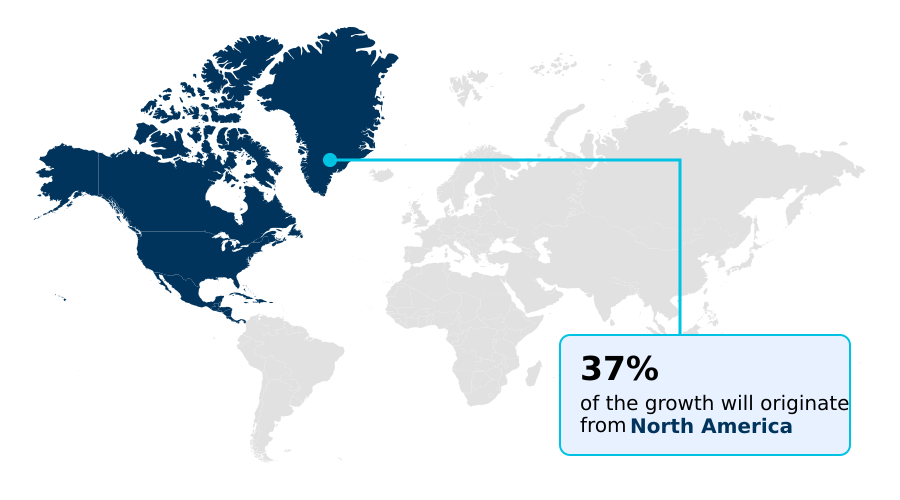
  • North America dominated the market and accounted for a 36.7% growth during the forecast period.
  • By Solution - On-premises segment was valued at USD 3.99 billion in 2024
  • By Mode of Transportation - Roadways segment accounted for the largest market revenue share in 2024

Market Size & Forecast

  • Market Opportunities: USD 8.19 billion
  • Market Future Opportunities: USD 5.48 billion
  • CAGR from 2025 to 2030 : 12.1%

Market Summary

  • The transportation management systems market is undergoing a significant transformation, driven by the need for enhanced visibility and digital integration in increasingly complex logistics networks. The adoption of cloud native tms architecture is accelerating, offering companies greater scalability and reduced operational overhead.
  • As businesses grapple with volatile fuel costs and dynamic trade policies, the demand for advanced analytics and automated workflows has become critical. For instance, a global manufacturing firm can leverage a modern TMS to optimize multimodal shipping routes in real time, balancing carrier costs with delivery timelines to maintain service-level agreements.
  • This involves integrating real time shipment visibility with predictive insights to mitigate the impact of port congestion or weather disruptions. Furthermore, the push for greater environmental responsibility is influencing logistics strategies, with organizations using TMS to facilitate better load consolidation and backhaul optimization strategies to reduce carbon emissions.
  • The integration of AI and machine learning enables the processing of vast operational datasets, providing the predictive intelligence necessary for building more resilient and sustainable supply chains. These sophisticated management tools are no longer just operational aids but have become strategic assets for navigating the complexities of the modern global economy and achieving competitive advantage.

What will be the Size of the Transportation Management Systems Market during the forecast period?

Get Key Insights on Market Forecast (PDF) Request Free Sample

How is the Transportation Management Systems Market Segmented?

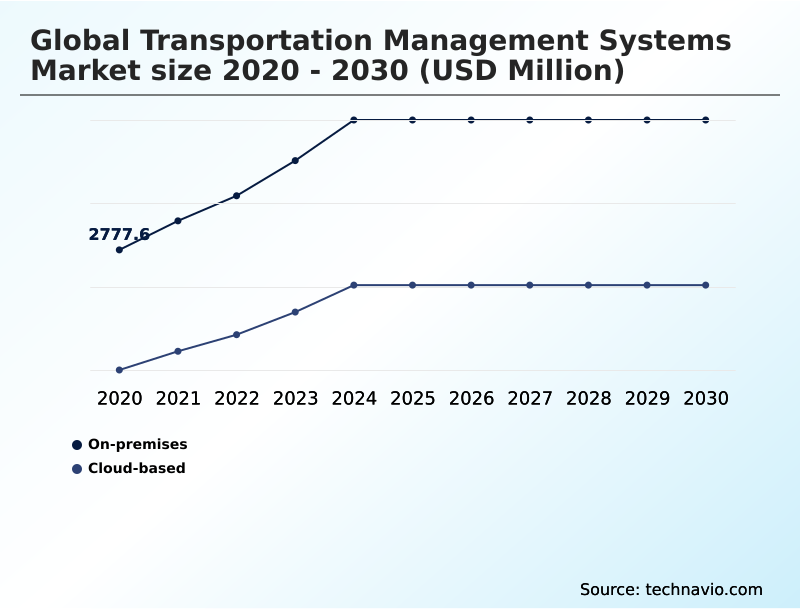
The transportation management systems industry research report provides comprehensive data (region-wise segment analysis), with forecasts and estimates in "USD million" for the period 2026-2030, as well as historical data from 2020-2024 for the following segments.

  • Solution
    • On-premises
    • Cloud-based
  • Mode of transportation
    • Roadways
    • Airways
    • Railways
  • End-user
    • Manufacturing
    • Logistics
    • Retail and E-commerce
    • Government organizations
    • Others
  • Geography
    • North America
      • US
      • Canada
      • Mexico
    • Europe
      • Germany
      • France
      • UK
    • APAC
      • China
      • India
      • Japan
    • Middle East and Africa
      • Saudi Arabia
      • UAE
      • South Africa
    • South America
      • Brazil
      • Colombia
    • Rest of World (ROW)

By Solution Insights

The on-premises segment is estimated to witness significant growth during the forecast period.

On-premises solutions remain a vital component for enterprises requiring maximum data security and customized infrastructure, offering total administrative control over the software environment.

These deployments support deep integrations with legacy systems, creating cohesive supply chain execution platforms that enable a resilient supply chain design.

Organizations leverage these systems for complex last mile delivery optimization and intermodal transfer synchronization, managed by logistics operations agents that ensure seamless information flow.

While the transition to cloud is prevalent, on-premises systems provide unmatched stability for high-volume transactions, with some users reporting a 15% improvement in error detection by using customized telematics and sensor integration.

This approach supports unique business logic and what if scenario planning for smart city logistics, ensuring that system modifications align with strategic operational goals and support autonomous logistics execution.

Request Free Sample

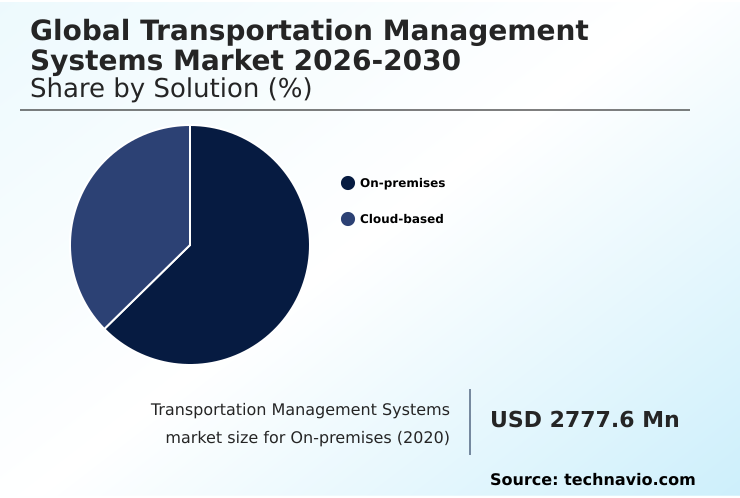
The On-premises segment was valued at USD 3.99 billion in 2024 and showed a gradual increase during the forecast period.

Request Free Sample

Regional Analysis

North America is estimated to contribute 36.7% to the growth of the global market during the forecast period.Technavio’s analysts have elaborately explained the regional trends and drivers that shape the market during the forecast period.

See How Transportation Management Systems Market Demand is Rising in North America Request Free Sample

The geographic landscape of the transportation management systems market is characterized by varying levels of digital maturity, with North America leading in the adoption of cloud native tms architecture and advanced fleet management solutions.

In this region, end to end supply chain visibility is paramount, with companies leveraging digital freight matching to improve carrier selection and asset utilization.

The focus on efficiency is driving a 35% increase in the use of automated dispatching systems for less than truckload shipping, which reduces manual errors.

In contrast, APAC is the fastest-growing market, where the focus is on scaling operations and managing complex cross-border trade with tools like digital air waybills and automated clearance processes.

Europe emphasizes sustainability and regulatory compliance, where integrated integrated freight cost management is crucial.

Across all regions, the demand for platforms enabling multimodal shipment planning and real time asset tracking underscores a global move toward more connected and intelligent logistics networks.

Market Dynamics

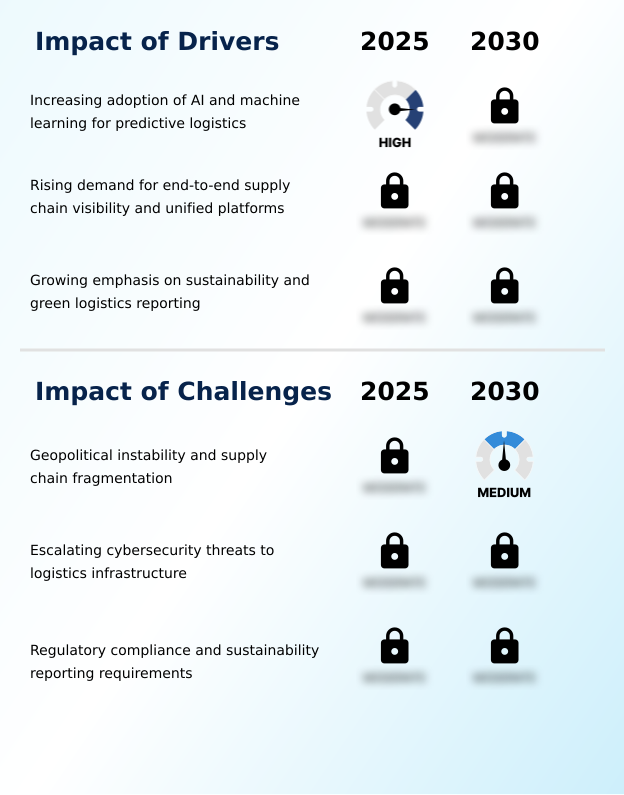
Our researchers analyzed the data with 2025 as the base year, along with the key drivers, trends, and challenges. A holistic analysis of drivers will help companies refine their marketing strategies to gain a competitive advantage.

  • The evolution of transportation management systems is increasingly focused on addressing highly specific operational pain points. For shippers, managing complex multimodal shipment logistics is no longer a manual process but one driven by platforms that offer deep analytical capabilities.
  • A key area of innovation is in optimizing last mile delivery networks, where advanced algorithms can reduce fuel consumption by over 15% compared to static routing models. This is achieved by integrating ai for predictive logistics, which anticipates delays and suggests alternative paths.
  • The concept of a unified platform for supply chain visibility has become a strategic imperative, unifying transportation and warehouse data to create a single source of truth. This integration is crucial for effective agentic orchestration for autonomous logistics and supports real time exception handling in transportation.
  • Furthermore, tms implementation for green logistics and sustainability reporting in transportation management are now core requirements, not optional features. Businesses are adopting cloud native tms architecture benefits to support tms support for autonomous vehicle fleets and facilitate multi enterprise supply chain connectivity.
  • Simultaneously, mitigating cybersecurity risks in logistics has become a top priority, alongside navigating the geopolitical impact on supply chain networks. The automation of back-office functions like automating freight audit and payment and leveraging real time trade intelligence compliance frees up resources for more strategic tasks, such as enhancing carrier collaboration via tms and improving fleet management with telematics.
  • Ultimately, managing freight spend with tms through predictive analytics for freight rates and integrating iot for shipment visibility provides a significant competitive advantage.

What are the key market drivers leading to the rise in the adoption of Transportation Management Systems Industry?

  • The increasing adoption of AI and machine learning for predictive logistics is a key driver propelling market growth.

  • The primary market driver is the critical need for comprehensive, real-time data to manage complex global logistics, pushing the adoption of advanced analytical tools.
  • The integration of autonomous logistics network modeling and energy efficient routing algorithms is helping businesses reduce fuel costs by up to 15%.
  • Demand for platforms featuring an inventory twin platform and yard management unification is surging, as these tools eliminate operational silos and improve asset utilization.
  • Green logistics initiatives are also compelling the adoption of systems with embedded greenhouse gas measurement and carbon tracking integration, with some achieving a 10% reduction in overall emissions.
  • The shift toward autonomous agent capabilities for tasks like automated freight procurement and real time exception handling streamlines workflows. Moreover, iot enabled shipment visibility and predictive market rate insights empower organizations to make smarter, data-driven decisions for predictive backhaul optimization.

What are the market trends shaping the Transportation Management Systems Industry?

  • Advancements in agentic logistics orchestration and autonomous decision support are key upcoming trends. These innovations are reshaping how transportation networks are managed and optimized.

  • Market trends are defined by a convergence of agentic logistics orchestration and holistic visibility, moving organizations toward predictive operations. The adoption of a unified control tower architecture has enabled a 30% reduction in information latency between warehouse and transport divisions.
  • Innovations in autonomous decision support and predictive logistics execution are central, with intelligent automation in logistics improving forecast accuracy by over 25%. Key advancements include platforms that offer multi modal synchronization as a native feature, providing a single source of truth data model.
  • This is complemented by a strong focus on sustainability, where integrated carbon tracking and sustainability tracking metrics are no longer optional. The use of logistics network modeling and what if scenario planning allows for proactive risk management, creating more resilient and efficient supply chains through a unified logistics platform.

What challenges does the Transportation Management Systems Industry face during its growth?

  • Geopolitical instability and supply chain fragmentation present a key challenge affecting industry growth and operational continuity.

  • Navigating market challenges requires advanced digital capabilities to counter geopolitical instability and escalating cyber threats. The reliance on real time shipment visibility is critical, yet fragmented data systems hinder a unified response, with disruptions causing lead time variability of over 25% in affected regions.
  • To combat this, businesses are adopting intelligent orchestration engines for dynamic route optimization and ai driven freight planning. However, the complexity of real time trade intelligence and regulatory compliance creates significant administrative burdens. Implementing automated freight audit and automated carrier tendering can improve efficiency, but requires clean data.
  • Furthermore, enhancing cybersecurity within a versionless software architecture is a persistent challenge, as a single breach can halt operations entirely. Tools offering a cognitive logistics loop and automated milestone monitoring help mitigate risks, but the threat landscape demands constant vigilance and investment.

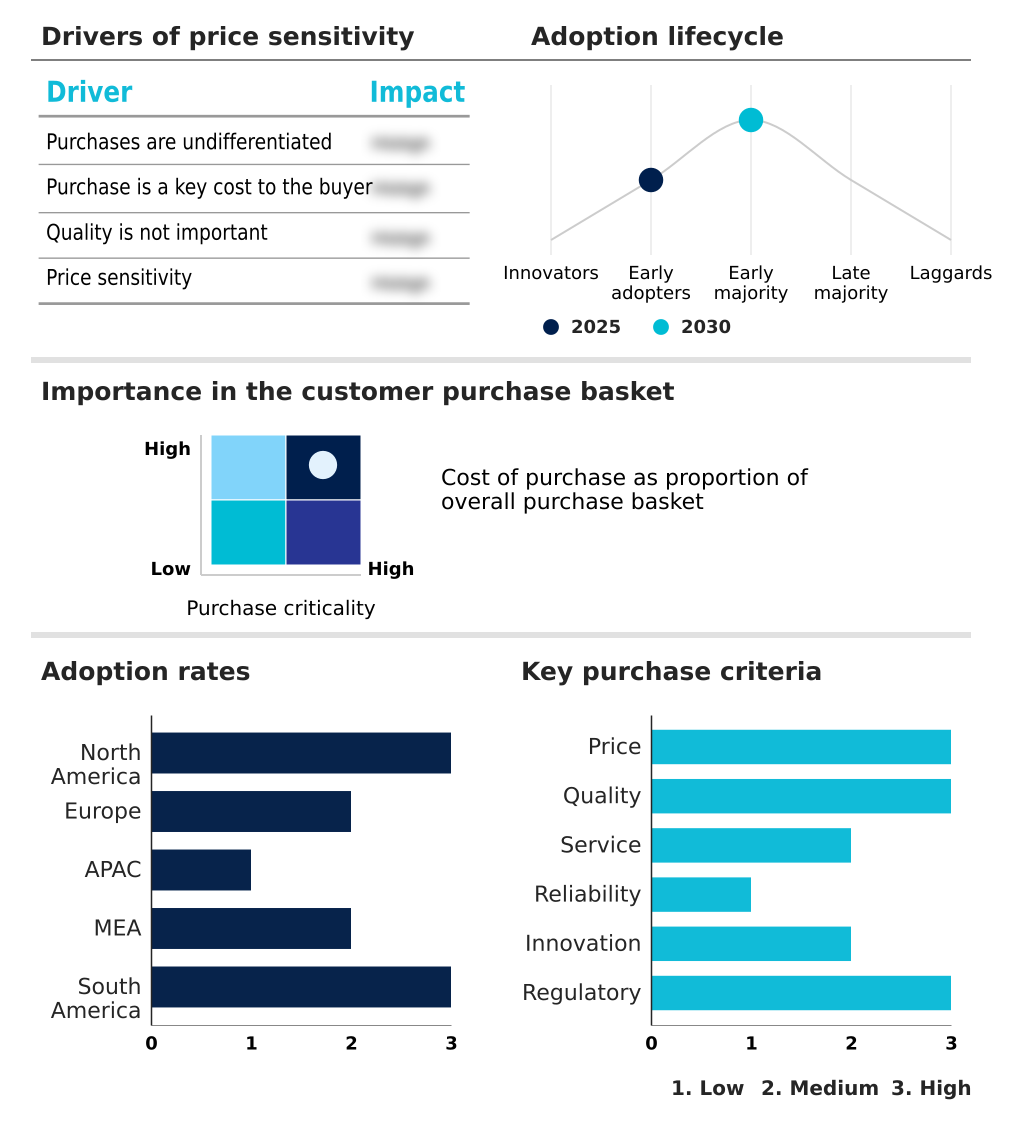
Exclusive Technavio Analysis on Customer Landscape

The transportation management systems market forecasting report includes the adoption lifecycle of the market, covering from the innovator’s stage to the laggard’s stage. It focuses on adoption rates in different regions based on penetration. Furthermore, the transportation management systems market report also includes key purchase criteria and drivers of price sensitivity to help companies evaluate and develop their market growth analysis strategies.

Customer Landscape of Transportation Management Systems Industry

Competitive Landscape

Companies are implementing various strategies, such as strategic alliances, transportation management systems market forecast, partnerships, mergers and acquisitions, geographical expansion, and product/service launches, to enhance their presence in the industry.

Alpega SA NV - Key offerings include cloud-based modular systems for planning, execution, freight settlement, and analytics, featuring machine learning-based routing to optimize logistics networks.

The industry research and growth report includes detailed analyses of the competitive landscape of the market and information about key companies, including:

  • Alpega SA NV
  • Blue Yonder Group Inc.
  • Descartes Systems Group Inc.
  • E2open Parent Holdings Inc.
  • Elemica Inc.
  • FreightPOP
  • Generix Group
  • Infor Inc.
  • IntelliTrans
  • Koerber AG
  • Logility SCS Inc.
  • Magaya Corp.
  • Manhattan Associates Inc.
  • Oracle Corp.
  • RateLinx
  • SAP SE
  • Shipwell
  • Softeon
  • Trimble Inc.
  • Uber Freight

Qualitative and quantitative analysis of companies has been conducted to help clients understand the wider business environment as well as the strengths and weaknesses of key industry players. Data is qualitatively analyzed to categorize companies as pure play, category-focused, industry-focused, and diversified; it is quantitatively analyzed to categorize companies as dominant, leading, strong, tentative, and weak.

Recent Development and News in Transportation management systems market

  • In November 2024, Blue Yonder suffered a significant ransomware attack, causing major disruptions to its managed services hosted environment for several retail and consumer goods companies.
  • In March 2025, Descartes Systems Group acquired 3GTMS for approximately USD 115 million to strengthen its cloud-native transportation management offerings and optimize over-the-road domestic shipments.
  • In March 2025, Manhattan Associates announced the integration of generative AI and yard management unification into its cloud-native platform to help companies resolve complex transportation challenges.
  • In April 2025, Oracle introduced advanced AI innovations within its transportation management platform, providing autonomous logistics network modeling and what-if scenario planning capabilities.

Dive into Technavio’s robust research methodology, blending expert interviews, extensive data synthesis, and validated models for unparalleled Transportation Management Systems Market insights. See full methodology.

Market Scope
Page number 305
Base year 2025
Historic period 2020-2024
Forecast period 2026-2030
Growth momentum & CAGR Accelerate at a CAGR of 12.1%
Market growth 2026-2030 USD 5483.4 million
Market structure Fragmented
YoY growth 2025-2026(%) 11.3%
Key countries US, Canada, Mexico, Germany, France, UK, The Netherlands, Italy, Spain, China, India, Japan, South Korea, Australia, Singapore, Saudi Arabia, UAE, South Africa, Egypt, Turkey, Brazil, Colombia and Chile
Competitive landscape Leading Companies, Market Positioning of Companies, Competitive Strategies, and Industry Risks

Request Free Sample

Research Analyst Overview

  • The transportation management systems market is advancing beyond simple execution tools to become the central nervous system for modern supply chains. The shift toward agentic logistics orchestration and autonomous decision support allows for proactive management rather than reactive problem-solving.
  • A key trend influencing boardroom strategy is the integration of sustainability tracking metrics and integrated carbon tracking, which directly impacts environmental, social, and governance reporting mandates. Platforms now offer autonomous logistics network modeling and energy efficient routing algorithms to balance costs with corporate sustainability goals.
  • Technologies facilitating multi modal synchronization and a unified control tower architecture provide end to end supply chain visibility, which is critical for building a resilient supply chain design. For instance, businesses using predictive logistics execution have reported up to a 20% improvement in on-time delivery rates.
  • This evolution is driven by the need for greater agility, with solutions offering real time exception handling, automated freight procurement, and ai driven freight planning becoming standard. These capabilities, including yard management unification and dynamic route optimization, empower organizations to navigate disruptions and optimize performance continuously.

What are the Key Data Covered in this Transportation Management Systems Market Research and Growth Report?

  • What is the expected growth of the Transportation Management Systems Market between 2026 and 2030?

    • USD 5.48 billion, at a CAGR of 12.1%

  • What segmentation does the market report cover?

    • The report is segmented by Solution (On-premises, and Cloud-based), Mode of Transportation (Roadways, Airways, and Railways), End-user (Manufacturing, Logistics, Retail and E-commerce, Government organizations, and Others) and Geography (North America, Europe, APAC, Middle East and Africa, South America)

  • Which regions are analyzed in the report?

    • North America, Europe, APAC, Middle East and Africa and South America

  • What are the key growth drivers and market challenges?

    • Increasing adoption of AI and machine learning for predictive logistics, Geopolitical instability and supply chain fragmentation

  • Who are the major players in the Transportation Management Systems Market?

    • Alpega SA NV, Blue Yonder Group Inc., Descartes Systems Group Inc., E2open Parent Holdings Inc., Elemica Inc., FreightPOP, Generix Group, Infor Inc., IntelliTrans, Koerber AG, Logility SCS Inc., Magaya Corp., Manhattan Associates Inc., Oracle Corp., RateLinx, SAP SE, Shipwell, Softeon, Trimble Inc. and Uber Freight

Market Research Insights

  • The dynamics of the transportation management systems market are defined by a move toward intelligent automation and unified data models. Real time visibility platforms are becoming standard, with adoption rates increasing by over 40% among mid-sized enterprises in the last two years.
  • The integration of a single source of truth data model allows for enhanced intelligent automation in logistics, leading to a 25% reduction in decision-making latency for shipment rerouting. Green logistics initiatives are also gaining traction, with platforms offering carbon tracking integration to help businesses align with regulatory mandates, improving compliance reporting efficiency by up to 30%.
  • These systems are evolving from siloed tools into a central unified logistics platform, enabling cohesive management of transportation, warehousing, and inventory. This shift toward autonomous agent capabilities and a cognitive logistics loop is foundational for building agile, cost-effective, and resilient supply chains.

We can help! Our analysts can customize this transportation management systems market research report to meet your requirements.

Get in touch

1. Executive Summary

1.1 Market overview

Executive Summary - Chart on Market Overview
Executive Summary - Data Table on Market Overview
Executive Summary - Chart on Global Market Characteristics
Executive Summary - Chart on Market by Geography
Executive Summary - Chart on Market Segmentation by Solution
Executive Summary - Chart on Market Segmentation by Mode of Transportation
Executive Summary - Chart on Market Segmentation by End-user
Executive Summary - Chart on Incremental Growth
Executive Summary - Data Table on Incremental Growth
Executive Summary - Chart on Company Market Positioning

2. Technavio Analysis

2.1 Analysis of price sensitivity, lifecycle, customer purchase basket, adoption rates, and purchase criteria

2.2 Criticality of inputs and Factors of differentiation

Chart on Overview on criticality of inputs and factors of differentiation

2.3 Factors of disruption

Chart on Overview on factors of disruption

2.4 Impact of drivers and challenges

Chart on Impact of drivers and challenges in 2025 and 2030

3. Market Landscape

3.1 Market ecosystem

Chart on Parent Market
Data Table on - Parent Market

3.2 Market characteristics

Chart on Market characteristics analysis

3.3 Value chain analysis

Chart on Value chain analysis

4. Market Sizing

4.1 Market definition

Data Table on Offerings of companies included in the market definition

4.2 Market segment analysis

Market segments

4.3 Market size 2025

4.4 Market outlook: Forecast for 2025-2030

Chart on Global - Market size and forecast 2025-2030 ($ million)
Data Table on Global - Market size and forecast 2025-2030 ($ million)
Chart on Global Market: Year-over-year growth 2025-2030 (%)
Data Table on Global Market: Year-over-year growth 2025-2030 (%)

5. Historic Market Size

5.1 Global Transportation Management Systems Market 2020 - 2024

Historic Market Size - Data Table on Global Transportation Management Systems Market 2020 - 2024 ($ million)

5.2 Solution segment analysis 2020 - 2024

Historic Market Size - Solution Segment 2020 - 2024 ($ million)

5.3 Mode of Transportation segment analysis 2020 - 2024

Historic Market Size - Mode of Transportation Segment 2020 - 2024 ($ million)

5.4 End-user segment analysis 2020 - 2024

Historic Market Size - End-user Segment 2020 - 2024 ($ million)

5.5 Geography segment analysis 2020 - 2024

Historic Market Size - Geography Segment 2020 - 2024 ($ million)

5.6 Country segment analysis 2020 - 2024

Historic Market Size - Country Segment 2020 - 2024 ($ million)

6. Qualitative Analysis

6.1 Impact of AI on Global Transportation Management Systems (TMS) Market

6.2 Impact of Geopolitical Conflicts on Global Transportation Management Systems (TMS) Market

7. Five Forces Analysis

7.1 Five forces summary

Five forces analysis - Comparison between 2025 and 2030

7.2 Bargaining power of buyers

Bargaining power of buyers - Impact of key factors 2025 and 2030

7.3 Bargaining power of suppliers

Bargaining power of suppliers - Impact of key factors in 2025 and 2030

7.4 Threat of new entrants

Threat of new entrants - Impact of key factors in 2025 and 2030

7.5 Threat of substitutes

Threat of substitutes - Impact of key factors in 2025 and 2030

7.6 Threat of rivalry

Threat of rivalry - Impact of key factors in 2025 and 2030

7.7 Market condition

Chart on Market condition - Five forces 2025 and 2030

8. Market Segmentation by Solution

8.1 Market segments

Chart on Solution - Market share 2025-2030 (%)
Data Table on Solution - Market share 2025-2030 (%)

8.2 Comparison by Solution

Chart on Comparison by Solution
Data Table on Comparison by Solution

8.3 On-premises - Market size and forecast 2025-2030

Chart on On-premises - Market size and forecast 2025-2030 ($ million)
Data Table on On-premises - Market size and forecast 2025-2030 ($ million)
Chart on On-premises - Year-over-year growth 2025-2030 (%)
Data Table on On-premises - Year-over-year growth 2025-2030 (%)

8.4 Cloud-based - Market size and forecast 2025-2030

Chart on Cloud-based - Market size and forecast 2025-2030 ($ million)
Data Table on Cloud-based - Market size and forecast 2025-2030 ($ million)
Chart on Cloud-based - Year-over-year growth 2025-2030 (%)
Data Table on Cloud-based - Year-over-year growth 2025-2030 (%)

8.5 Market opportunity by Solution

Market opportunity by Solution ($ million)
Data Table on Market opportunity by Solution ($ million)

9. Market Segmentation by Mode of Transportation

9.1 Market segments

Chart on Mode of Transportation - Market share 2025-2030 (%)
Data Table on Mode of Transportation - Market share 2025-2030 (%)

9.2 Comparison by Mode of Transportation

Chart on Comparison by Mode of Transportation
Data Table on Comparison by Mode of Transportation

9.3 Roadways - Market size and forecast 2025-2030

Chart on Roadways - Market size and forecast 2025-2030 ($ million)
Data Table on Roadways - Market size and forecast 2025-2030 ($ million)
Chart on Roadways - Year-over-year growth 2025-2030 (%)
Data Table on Roadways - Year-over-year growth 2025-2030 (%)

9.4 Airways - Market size and forecast 2025-2030

Chart on Airways - Market size and forecast 2025-2030 ($ million)
Data Table on Airways - Market size and forecast 2025-2030 ($ million)
Chart on Airways - Year-over-year growth 2025-2030 (%)
Data Table on Airways - Year-over-year growth 2025-2030 (%)

9.5 Railways - Market size and forecast 2025-2030

Chart on Railways - Market size and forecast 2025-2030 ($ million)
Data Table on Railways - Market size and forecast 2025-2030 ($ million)
Chart on Railways - Year-over-year growth 2025-2030 (%)
Data Table on Railways - Year-over-year growth 2025-2030 (%)

9.6 Market opportunity by Mode of Transportation

Market opportunity by Mode of Transportation ($ million)
Data Table on Market opportunity by Mode of Transportation ($ million)

10. Market Segmentation by End-user

10.1 Market segments

Chart on End-user - Market share 2025-2030 (%)
Data Table on End-user - Market share 2025-2030 (%)

10.2 Comparison by End-user

Chart on Comparison by End-user
Data Table on Comparison by End-user

10.3 Manufacturing - Market size and forecast 2025-2030

Chart on Manufacturing - Market size and forecast 2025-2030 ($ million)
Data Table on Manufacturing - Market size and forecast 2025-2030 ($ million)
Chart on Manufacturing - Year-over-year growth 2025-2030 (%)
Data Table on Manufacturing - Year-over-year growth 2025-2030 (%)

10.4 Logistics - Market size and forecast 2025-2030

Chart on Logistics - Market size and forecast 2025-2030 ($ million)
Data Table on Logistics - Market size and forecast 2025-2030 ($ million)
Chart on Logistics - Year-over-year growth 2025-2030 (%)
Data Table on Logistics - Year-over-year growth 2025-2030 (%)

10.5 Retail and E-commerce - Market size and forecast 2025-2030

Chart on Retail and E-commerce - Market size and forecast 2025-2030 ($ million)
Data Table on Retail and E-commerce - Market size and forecast 2025-2030 ($ million)
Chart on Retail and E-commerce - Year-over-year growth 2025-2030 (%)
Data Table on Retail and E-commerce - Year-over-year growth 2025-2030 (%)

10.6 Government organizations - Market size and forecast 2025-2030

Chart on Government organizations - Market size and forecast 2025-2030 ($ million)
Data Table on Government organizations - Market size and forecast 2025-2030 ($ million)
Chart on Government organizations - Year-over-year growth 2025-2030 (%)
Data Table on Government organizations - Year-over-year growth 2025-2030 (%)

10.7 Others - Market size and forecast 2025-2030

Chart on Others - Market size and forecast 2025-2030 ($ million)
Data Table on Others - Market size and forecast 2025-2030 ($ million)
Chart on Others - Year-over-year growth 2025-2030 (%)
Data Table on Others - Year-over-year growth 2025-2030 (%)

10.8 Market opportunity by End-user

Market opportunity by End-user ($ million)
Data Table on Market opportunity by End-user ($ million)

11. Customer Landscape

11.1 Customer landscape overview

Analysis of price sensitivity, lifecycle, customer purchase basket, adoption rates, and purchase criteria

12. Geographic Landscape

12.1 Geographic segmentation

Chart on Market share by geography 2025-2030 (%)
Data Table on Market share by geography 2025-2030 (%)

12.2 Geographic comparison

Chart on Geographic comparison
Data Table on Geographic comparison

12.3 North America - Market size and forecast 2025-2030

Chart on North America - Market size and forecast 2025-2030 ($ million)
Data Table on North America - Market size and forecast 2025-2030 ($ million)
Chart on North America - Year-over-year growth 2025-2030 (%)
Data Table on North America - Year-over-year growth 2025-2030 (%)
Chart on Regional Comparison - North America
Data Table on Regional Comparison - North America

12.3.1 US - Market size and forecast 2025-2030

Chart on US - Market size and forecast 2025-2030 ($ million)
Data Table on US - Market size and forecast 2025-2030 ($ million)
Chart on US - Year-over-year growth 2025-2030 (%)
Data Table on US - Year-over-year growth 2025-2030 (%)

12.3.2 Canada - Market size and forecast 2025-2030

Chart on Canada - Market size and forecast 2025-2030 ($ million)
Data Table on Canada - Market size and forecast 2025-2030 ($ million)
Chart on Canada - Year-over-year growth 2025-2030 (%)
Data Table on Canada - Year-over-year growth 2025-2030 (%)

12.3.3 Mexico - Market size and forecast 2025-2030

Chart on Mexico - Market size and forecast 2025-2030 ($ million)
Data Table on Mexico - Market size and forecast 2025-2030 ($ million)
Chart on Mexico - Year-over-year growth 2025-2030 (%)
Data Table on Mexico - Year-over-year growth 2025-2030 (%)

12.4 Europe - Market size and forecast 2025-2030

Chart on Europe - Market size and forecast 2025-2030 ($ million)
Data Table on Europe - Market size and forecast 2025-2030 ($ million)
Chart on Europe - Year-over-year growth 2025-2030 (%)
Data Table on Europe - Year-over-year growth 2025-2030 (%)
Chart on Regional Comparison - Europe
Data Table on Regional Comparison - Europe

12.4.1 Germany - Market size and forecast 2025-2030

Chart on Germany - Market size and forecast 2025-2030 ($ million)
Data Table on Germany - Market size and forecast 2025-2030 ($ million)
Chart on Germany - Year-over-year growth 2025-2030 (%)
Data Table on Germany - Year-over-year growth 2025-2030 (%)

12.4.2 France - Market size and forecast 2025-2030

Chart on France - Market size and forecast 2025-2030 ($ million)
Data Table on France - Market size and forecast 2025-2030 ($ million)
Chart on France - Year-over-year growth 2025-2030 (%)
Data Table on France - Year-over-year growth 2025-2030 (%)

12.4.3 UK - Market size and forecast 2025-2030

Chart on UK - Market size and forecast 2025-2030 ($ million)
Data Table on UK - Market size and forecast 2025-2030 ($ million)
Chart on UK - Year-over-year growth 2025-2030 (%)
Data Table on UK - Year-over-year growth 2025-2030 (%)

12.4.4 The Netherlands - Market size and forecast 2025-2030

Chart on The Netherlands - Market size and forecast 2025-2030 ($ million)
Data Table on The Netherlands - Market size and forecast 2025-2030 ($ million)
Chart on The Netherlands - Year-over-year growth 2025-2030 (%)
Data Table on The Netherlands - Year-over-year growth 2025-2030 (%)

12.4.5 Italy - Market size and forecast 2025-2030

Chart on Italy - Market size and forecast 2025-2030 ($ million)
Data Table on Italy - Market size and forecast 2025-2030 ($ million)
Chart on Italy - Year-over-year growth 2025-2030 (%)
Data Table on Italy - Year-over-year growth 2025-2030 (%)

12.4.6 Spain - Market size and forecast 2025-2030

Chart on Spain - Market size and forecast 2025-2030 ($ million)
Data Table on Spain - Market size and forecast 2025-2030 ($ million)
Chart on Spain - Year-over-year growth 2025-2030 (%)
Data Table on Spain - Year-over-year growth 2025-2030 (%)

12.5 APAC - Market size and forecast 2025-2030

Chart on APAC - Market size and forecast 2025-2030 ($ million)
Data Table on APAC - Market size and forecast 2025-2030 ($ million)
Chart on APAC - Year-over-year growth 2025-2030 (%)
Data Table on APAC - Year-over-year growth 2025-2030 (%)
Chart on Regional Comparison - APAC
Data Table on Regional Comparison - APAC

12.5.1 China - Market size and forecast 2025-2030

Chart on China - Market size and forecast 2025-2030 ($ million)
Data Table on China - Market size and forecast 2025-2030 ($ million)
Chart on China - Year-over-year growth 2025-2030 (%)
Data Table on China - Year-over-year growth 2025-2030 (%)

12.5.2 India - Market size and forecast 2025-2030

Chart on India - Market size and forecast 2025-2030 ($ million)
Data Table on India - Market size and forecast 2025-2030 ($ million)
Chart on India - Year-over-year growth 2025-2030 (%)
Data Table on India - Year-over-year growth 2025-2030 (%)

12.5.3 Japan - Market size and forecast 2025-2030

Chart on Japan - Market size and forecast 2025-2030 ($ million)
Data Table on Japan - Market size and forecast 2025-2030 ($ million)
Chart on Japan - Year-over-year growth 2025-2030 (%)
Data Table on Japan - Year-over-year growth 2025-2030 (%)

12.5.4 South Korea - Market size and forecast 2025-2030

Chart on South Korea - Market size and forecast 2025-2030 ($ million)
Data Table on South Korea - Market size and forecast 2025-2030 ($ million)
Chart on South Korea - Year-over-year growth 2025-2030 (%)
Data Table on South Korea - Year-over-year growth 2025-2030 (%)

12.5.5 Australia - Market size and forecast 2025-2030

Chart on Australia - Market size and forecast 2025-2030 ($ million)
Data Table on Australia - Market size and forecast 2025-2030 ($ million)
Chart on Australia - Year-over-year growth 2025-2030 (%)
Data Table on Australia - Year-over-year growth 2025-2030 (%)

12.5.6 Singapore - Market size and forecast 2025-2030

Chart on Singapore - Market size and forecast 2025-2030 ($ million)
Data Table on Singapore - Market size and forecast 2025-2030 ($ million)
Chart on Singapore - Year-over-year growth 2025-2030 (%)
Data Table on Singapore - Year-over-year growth 2025-2030 (%)

12.6 Middle East and Africa - Market size and forecast 2025-2030

Chart on Middle East and Africa - Market size and forecast 2025-2030 ($ million)
Data Table on Middle East and Africa - Market size and forecast 2025-2030 ($ million)
Chart on Middle East and Africa - Year-over-year growth 2025-2030 (%)
Data Table on Middle East and Africa - Year-over-year growth 2025-2030 (%)
Chart on Regional Comparison - Middle East and Africa
Data Table on Regional Comparison - Middle East and Africa

12.6.1 Saudi Arabia - Market size and forecast 2025-2030

Chart on Saudi Arabia - Market size and forecast 2025-2030 ($ million)
Data Table on Saudi Arabia - Market size and forecast 2025-2030 ($ million)
Chart on Saudi Arabia - Year-over-year growth 2025-2030 (%)
Data Table on Saudi Arabia - Year-over-year growth 2025-2030 (%)

12.6.2 UAE - Market size and forecast 2025-2030

Chart on UAE - Market size and forecast 2025-2030 ($ million)
Data Table on UAE - Market size and forecast 2025-2030 ($ million)
Chart on UAE - Year-over-year growth 2025-2030 (%)
Data Table on UAE - Year-over-year growth 2025-2030 (%)

12.6.3 South Africa - Market size and forecast 2025-2030

Chart on South Africa - Market size and forecast 2025-2030 ($ million)
Data Table on South Africa - Market size and forecast 2025-2030 ($ million)
Chart on South Africa - Year-over-year growth 2025-2030 (%)
Data Table on South Africa - Year-over-year growth 2025-2030 (%)

12.6.4 Egypt - Market size and forecast 2025-2030

Chart on Egypt - Market size and forecast 2025-2030 ($ million)
Data Table on Egypt - Market size and forecast 2025-2030 ($ million)
Chart on Egypt - Year-over-year growth 2025-2030 (%)
Data Table on Egypt - Year-over-year growth 2025-2030 (%)

12.6.5 Turkey - Market size and forecast 2025-2030

Chart on Turkey - Market size and forecast 2025-2030 ($ million)
Data Table on Turkey - Market size and forecast 2025-2030 ($ million)
Chart on Turkey - Year-over-year growth 2025-2030 (%)
Data Table on Turkey - Year-over-year growth 2025-2030 (%)

12.7 South America - Market size and forecast 2025-2030

Chart on South America - Market size and forecast 2025-2030 ($ million)
Data Table on South America - Market size and forecast 2025-2030 ($ million)
Chart on South America - Year-over-year growth 2025-2030 (%)
Data Table on South America - Year-over-year growth 2025-2030 (%)
Chart on Regional Comparison - South America
Data Table on Regional Comparison - South America

12.7.1 Brazil - Market size and forecast 2025-2030

Chart on Brazil - Market size and forecast 2025-2030 ($ million)
Data Table on Brazil - Market size and forecast 2025-2030 ($ million)
Chart on Brazil - Year-over-year growth 2025-2030 (%)
Data Table on Brazil - Year-over-year growth 2025-2030 (%)

12.7.2 Colombia - Market size and forecast 2025-2030

Chart on Colombia - Market size and forecast 2025-2030 ($ million)
Data Table on Colombia - Market size and forecast 2025-2030 ($ million)
Chart on Colombia - Year-over-year growth 2025-2030 (%)
Data Table on Colombia - Year-over-year growth 2025-2030 (%)

12.7.3 Chile - Market size and forecast 2025-2030

Chart on Chile - Market size and forecast 2025-2030 ($ million)
Data Table on Chile - Market size and forecast 2025-2030 ($ million)
Chart on Chile - Year-over-year growth 2025-2030 (%)
Data Table on Chile - Year-over-year growth 2025-2030 (%)

12.8 Market opportunity by geography

Market opportunity by geography ($ million)
Data Tables on Market opportunity by geography ($ million)

13. Drivers, Challenges, and Opportunity

13.1 Market drivers

Increasing adoption of AI and machine learning for predictive logistics
Rising demand for end-to-end supply chain visibility and unified platforms
Growing emphasis on sustainability and green logistics reporting

13.2 Market challenges

Geopolitical instability and supply chain fragmentation
Escalating cybersecurity threats to logistics infrastructure
Regulatory compliance and sustainability reporting requirements

13.3 Impact of drivers and challenges

Impact of drivers and challenges in 2025 and 2030

13.4 Market opportunities

Advancements in agentic logistics orchestration and autonomous decision support
Innovations in unified control tower architectures and multi modal synchronization
Advancements in sustainability tracking and fleet integration

14. Competitive Landscape

14.1 Overview

14.2

Overview on criticality of inputs and factors of differentiation

14.3 Landscape disruption

Overview on factors of disruption

14.4 Industry risks

Impact of key risks on business

15. Competitive Analysis

15.1 Companies profiled

Companies covered

15.2 Company ranking index

15.3 Market positioning of companies

Matrix on companies position and classification

15.4 Alpega SA NV

Alpega SA NV - Overview
Alpega SA NV - Product / Service
Alpega SA NV - Key offerings
SWOT

15.5 Descartes Systems Group Inc.

Descartes Systems Group Inc. - Overview
Descartes Systems Group Inc. - Business segments
Descartes Systems Group Inc. - Key offerings
Descartes Systems Group Inc. - Segment focus
SWOT

15.6 E2open Parent Holdings Inc.

E2open Parent Holdings Inc. - Overview
E2open Parent Holdings Inc. - Business segments
E2open Parent Holdings Inc. - Key news
E2open Parent Holdings Inc. - Key offerings
E2open Parent Holdings Inc. - Segment focus
SWOT

15.7 Elemica Inc.

Elemica Inc. - Overview
Elemica Inc. - Product / Service
Elemica Inc. - Key offerings
SWOT

15.8 Generix Group

Generix Group - Overview
Generix Group - Product / Service
Generix Group - Key offerings
SWOT

15.9 Infor Inc.

Infor Inc. - Overview
Infor Inc. - Product / Service
Infor Inc. - Key news
Infor Inc. - Key offerings
SWOT

15.10 Koerber AG

Koerber AG - Overview
Koerber AG - Product / Service
Koerber AG - Key offerings
SWOT

15.11 Logility SCS Inc.

Logility SCS Inc. - Overview
Logility SCS Inc. - Product / Service
Logility SCS Inc. - Key offerings
SWOT

15.12 Magaya Corp.

Magaya Corp. - Overview
Magaya Corp. - Product / Service
Magaya Corp. - Key offerings
SWOT

15.13 Manhattan Associates Inc.

Manhattan Associates Inc. - Overview
Manhattan Associates Inc. - Business segments
Manhattan Associates Inc. - Key news
Manhattan Associates Inc. - Key offerings
Manhattan Associates Inc. - Segment focus
SWOT

15.14 Oracle Corp.

Oracle Corp. - Overview
Oracle Corp. - Business segments
Oracle Corp. - Key news
Oracle Corp. - Key offerings
Oracle Corp. - Segment focus
SWOT

15.15 SAP SE

SAP SE - Overview
SAP SE - Business segments
SAP SE - Key news
SAP SE - Key offerings
SAP SE - Segment focus
SWOT

15.16 Softeon

Softeon - Overview
Softeon - Product / Service
Softeon - Key offerings
SWOT

15.17 Trimble Inc.

Trimble Inc. - Overview
Trimble Inc. - Business segments
Trimble Inc. - Key news
Trimble Inc. - Key offerings
Trimble Inc. - Segment focus
SWOT

15.18 Uber Freight

Uber Freight - Overview
Uber Freight - Product / Service
Uber Freight - Key offerings
SWOT

16. Appendix

16.1 Scope of the report

Market definition
Objectives
Notes and caveats

16.2 Inclusions and exclusions checklist

Inclusions checklist
Exclusions checklist

16.3 Currency conversion rates for US$

16.4 Research methodology

16.5 Data procurement

Information sources

16.6 Data validation

16.7 Validation techniques employed for market sizing

16.8 Data synthesis

16.9 360 degree market analysis

16.10 List of abbreviations

Research Methodology

Technavio presents a detailed picture of the market by way of study, synthesis, and summation of data from multiple sources. The analysts have presented the various facets of the market with a particular focus on identifying the key industry influencers. The data thus presented is comprehensive, reliable, and the result of extensive research, both primary and secondary.

INFORMATION SOURCES

Primary sources

  • Manufacturers and suppliers
  • Channel partners
  • Industry experts
  • Strategic decision makers

Secondary sources

  • Industry journals and periodicals
  • Government data
  • Financial reports of key industry players
  • Historical data
  • Press releases

DATA ANALYSIS

Data Synthesis

  • Collation of data
  • Estimation of key figures
  • Analysis of derived insights

Data Validation

  • Triangulation with data models
  • Reference against proprietary databases
  • Corroboration with industry experts

REPORT WRITING

Qualitative

  • Market drivers
  • Market challenges
  • Market trends
  • Five forces analysis

Quantitative

  • Market size and forecast
  • Market segmentation
  • Geographical insights
  • Competitive landscape

Interested in this report?

Get your sample now to see our research methodology and insights!

Download Now

Frequently Asked Questions

Transportation Management Systems market growth will increase by USD 5483.4 million during 2026-2030.

The Transportation Management Systems market is expected to grow at a CAGR of 12.1% during 2026-2030.

Transportation Management Systems market is segmented by Solution (On-premises, Cloud-based) Mode of transportation (Roadways, Airways, Railways) End-user (Manufacturing, Logistics, Retail and E-commerce, Government organizations, Others)

Alpega SA NV, Blue Yonder Group Inc., Descartes Systems Group Inc., E2open Parent Holdings Inc., Elemica Inc., FreightPOP, Generix Group, Infor Inc., IntelliTrans, Koerber AG, Logility SCS Inc., Magaya Corp., Manhattan Associates Inc., Oracle Corp., RateLinx, SAP SE, Shipwell, Softeon, Trimble Inc., Uber Freight are a few of the key vendors in the Transportation Management Systems market.

North America will register the highest growth rate of 36.7% among the other regions. Therefore, the Transportation Management Systems market in North America is expected to garner significant business opportunities for the vendors during the forecast period.

US, Canada, Mexico, Germany, France, UK, The Netherlands, Italy, Spain, China, India, Japan, South Korea, Australia, Singapore, Saudi Arabia, UAE, South Africa, Egypt, Turkey, Brazil, Colombia, Chile

  • Increasing adoption of AI and machine learning for predictive logistics is the driving factor this market.

The Transportation Management Systems market vendors should focus on grabbing business opportunities from the Solution segment as it accounted for the largest market share in the base year.