Public Transportation Market Analysis, Size, and Forecast 2026-2030: APAC (India, Japan, and China), North America (US, Mexico, and Canada), Europe (Germany, France, and UK), South America (Brazil, Argentina, and Colombia), Middle East and Africa (South Africa, Saudi Arabia, and UAE), and Rest of World (ROW)

Public Transportation Market Analysis, Size, and Forecast 2026-2030:
APAC (India, Japan, and China), North America (US, Mexico, and Canada), Europe (Germany, France, and UK), South America (Brazil, Argentina, and Colombia), Middle East and Africa (South Africa, Saudi Arabia, and UAE), and Rest of World (ROW)

Published: Mar 2026 288 Pages SKU: IRTNTR71131

Market Overview at a Glance

$121.4 B
Market Opportunity
6.6%
CAGR 2025 - 2030
34.8%
APAC Growth
$190.8 B
Bus segment 2024

Public Transportation Market Size 2026-2030

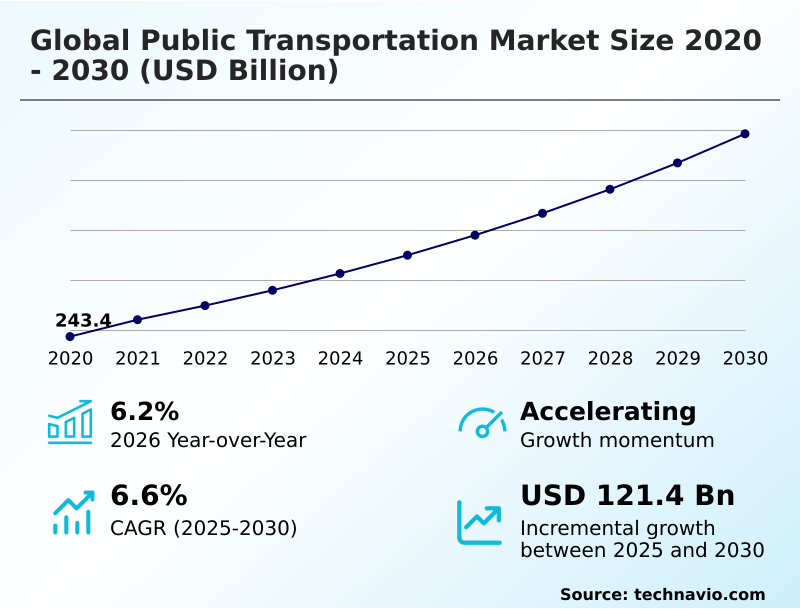
The public transportation market size is valued to increase by USD 121.4 billion, at a CAGR of 6.6% from 2025 to 2030. Acceleration of decarbonization and zero-emission mandates will drive the public transportation market.

Major Market Trends & Insights

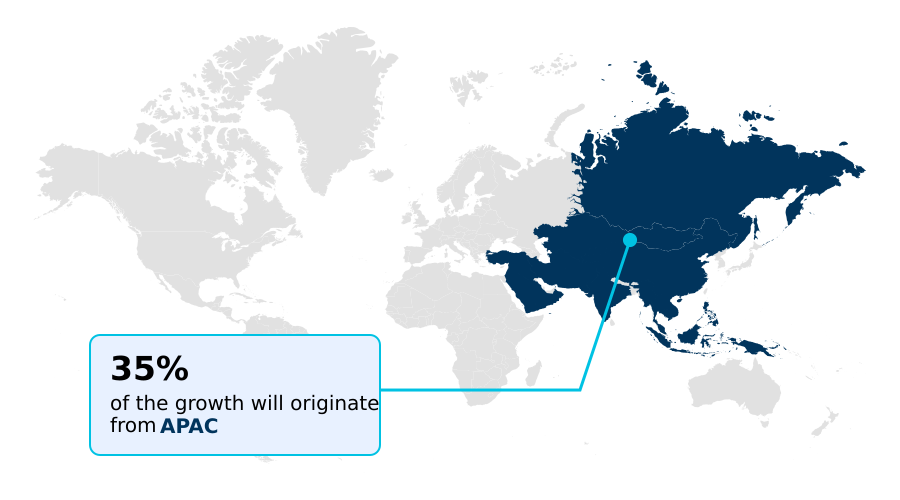
  • APAC dominated the market and accounted for a 34.8% growth during the forecast period.
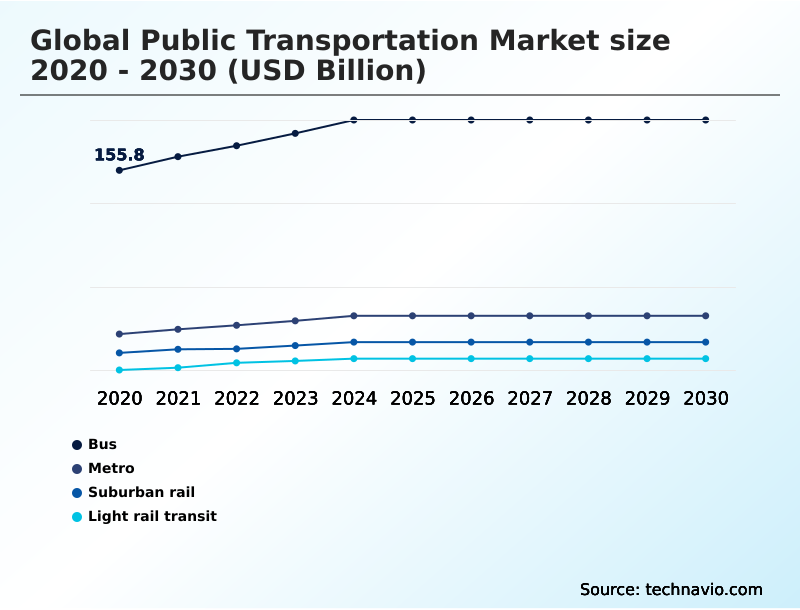
  • By Type - Bus segment was valued at USD 190.8 billion in 2024
  • By Distribution Channel - Offline segment accounted for the largest market revenue share in 2024

Market Size & Forecast

  • Market Opportunities: USD 202.8 billion
  • Market Future Opportunities: USD 121.4 billion
  • CAGR from 2025 to 2030 : 6.6%

Market Summary

  • The public transportation market is navigating a period of profound transformation, defined by the dual imperatives of sustainability and technological integration. A primary focus is the systemic electrification of transit fleets and rail networks, driven by zero-emission bus mandates aimed at achieving national carbon-neutrality targets.
  • Concurrently, the sector is experiencing rapid digitalization through the adoption of mobility-as-a-service platforms, which leverage real-time data integration to enhance operational efficiency. For instance, transit agencies are implementing intelligent fleet management systems that use predictive analytics to optimize routing and maintenance schedules, leading to significant reductions in operational downtime and improvements in service reliability.
  • However, this progress is tempered by persistent challenges, including a structural human capital deficit and the emergence of a fiscal cliff as traditional revenue streams decline. The need to fund high capital expenditure for modernization while addressing workforce retention creates a complex strategic environment for operators navigating the future of urban mobility.

What will be the Size of the Public Transportation Market during the forecast period?

Get Key Insights on Market Forecast (PDF) Request Free Sample

How is the Public Transportation Market Segmented?

The public transportation industry research report provides comprehensive data (region-wise segment analysis), with forecasts and estimates in "USD billion" for the period 2026-2030, as well as historical data from 2020-2024 for the following segments.

  • Type
    • Bus
    • Metro
    • Suburban rail
    • Light rail transit
  • Distribution channel
    • Offline
    • Online
  • Powertrain type
    • Diesel fleets
    • Hybrid transit vehicles
    • Battery-electric buses
  • Geography
    • APAC
      • India
      • Japan
      • China
    • North America
      • US
      • Mexico
      • Canada
    • Europe
      • Germany
      • France
      • UK
    • South America
      • Brazil
      • Argentina
      • Colombia
    • Middle East and Africa
      • South Africa
      • Saudi Arabia
      • UAE
    • Rest of World (ROW)

By Type Insights

The bus segment is estimated to witness significant growth during the forecast period.

The bus segment is undergoing a structural shift toward full electrification, driven by urban air quality goals and stringent decarbonization mandates.

This transition involves not just the replacement of aging fleets but also the strategic deployment of advanced energy management systems to support large-scale charging operations.

The integration of digital fleet management tools allows operators to monitor battery health and optimize schedules, while innovations like onboard diagnostics and electric drivetrains enhance performance.

The proliferation of electric buses is also supported by civil depot upgrades and the expansion of behind-the-meter power infrastructure.

As a result of these concerted efforts, some major urban fleets have already achieved approximately 20% zero-emission vehicle integration, improving life-cycle costs and urban mobility planning.

Request Free Sample

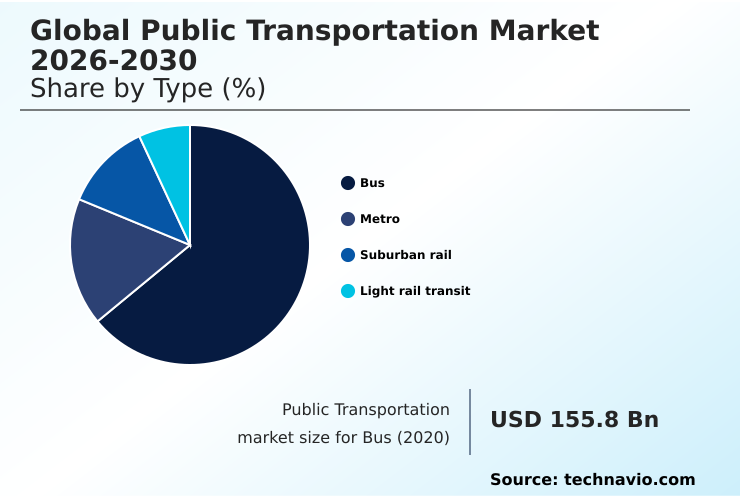
The Bus segment was valued at USD 190.8 billion in 2024 and showed a gradual increase during the forecast period.

Request Free Sample

Regional Analysis

APAC is estimated to contribute 34.8% to the growth of the global market during the forecast period.Technavio’s analysts have elaborately explained the regional trends and drivers that shape the market during the forecast period.

See How Public Transportation Market Demand is Rising in APAC Request Free Sample

The geographic landscape is marked by divergent regional strategies for modernization. In APAC, the focus is on large-scale infrastructure, with metro networks in some nations surpassing 1,000 kilometers in operational length.

This expansion is supported by a commitment to sovereign infrastructure and the use of localized digital control systems.

In Europe, the priority is decarbonization and interoperability, with initiatives aiming to double rail traffic and ensure over 75% of new city bus registrations are zero-emission.

North America is pivoting toward cost-effective bus rapid transit and physical hardening of legacy assets.

Meanwhile, South America is emerging as a leader in electric bus adoption, and the Middle East is leveraging sovereign wealth to build technologically advanced, AI-driven transit hubs with integrated software-integrated sensors.

These regional approaches highlight a global shift toward resilient, data-driven, and sustainable mobility.

Market Dynamics

Our researchers analyzed the data with 2025 as the base year, along with the key drivers, trends, and challenges. A holistic analysis of drivers will help companies refine their marketing strategies to gain a competitive advantage.

  • The future of the sector is being shaped by a complex interplay of strategic planning and technological adoption. Effective climate resilience in transport infrastructure planning is now a baseline requirement, compelling agencies to re-evaluate legacy assets. The economic impact of regional rail corridor expansion is significant, encouraging investment in integrated networks.
  • Concurrently, the mobility-as-a-service platform user experience is becoming a key differentiator, driven by the security protocols of account-based ticketing and the convenience of open-loop payment adoption in transit. Behind the scenes, AI predictive maintenance for rail operations is delivering measurable efficiency gains, with some operators seeing double-digit reductions in service disruptions compared to those using traditional methods.
  • This is complemented by the benefits of intelligent fleet management software for optimizing routes. However, significant hurdles remain, including the challenges of electric bus fleet transition and the need for effective transit operator workforce retention strategies. The deployment of high-capacity automated rail systems and adherence to cross-border rail network interoperability standards are critical for managing urban density.
  • Success will depend on balancing sustainable funding models for public transport with the investment needed for innovations like biometric payment interfaces in public transport and leveraging real-time data for transport optimization.

What are the key market drivers leading to the rise in the adoption of Public Transportation Industry?

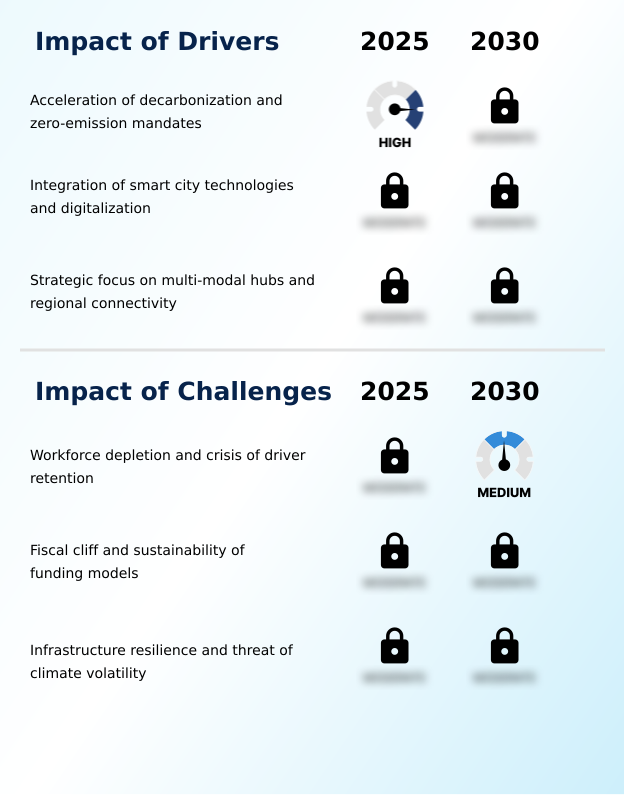
  • The acceleration of decarbonization efforts and the implementation of stringent zero-emission mandates are significant drivers propelling market growth.

  • Market growth is primarily driven by a global decarbonization commitment and the integration of smart city technologies. Stringent zero-emission bus mandates are compelling operators to transition toward battery-electric alternatives, a shift supported by substantial public investment.
  • For example, strategic funding initiatives are directing nearly 77% of their resources toward rail infrastructure upgrades to reduce fossil fuel reliance. Furthermore, the rapid digitalization of transit systems enhances the passenger experience through seamless multi-modal transfers.
  • The adoption of unified mobility applications is a key part of digital-first strategies, with some national rail networks achieving over 95% electrification coverage, significantly lowering long-term life-cycle costs and supporting carbon-neutrality targets.

What are the market trends shaping the Public Transportation Industry?

  • A defining market trend is the massive expansion of high-capacity automated rail. This is coupled with a strategic focus on developing sovereign infrastructure to manage extreme urban density.

  • Key market trends are centered on the expansion of high-capacity rail and the digitalization of passenger services. The aggressive pursuit of automated train operations and advanced signaling reflects a global strategy to manage urban density and enhance technological interoperability.
  • This push for modernization is delivering tangible outcomes, with some modern light rail vehicles now achieving up to 95% recyclability for rolling stock components. Concurrently, the sector is rapidly adopting smart ticketing initiatives and fare collection hardware that support contactless bank cards.
  • This digital transformation is creating a more seamless travel ecosystem, underscored by the expansion of metro networks, which have surpassed 1,000 kilometers in certain regions. The focus on high-frequency services is reshaping urban mobility.

What challenges does the Public Transportation Industry face during its growth?

  • A critical challenge affecting industry growth is the ongoing workforce depletion and the crisis in operator recruitment and retention.

  • The market faces critical challenges related to financial sustainability and infrastructure resilience. A widening fiscal cliff, driven by declining traditional revenue streams, creates a significant revenue deficit that hampers investment in modernization. This is compounded by the high capital expenditure required for green transitions.
  • Simultaneously, infrastructure degradation from extreme weather is a growing concern, with analyses indicating that nearly 75% of rail assets in some regions are exposed to heightened climate risks. The convergence of physical and cyber risks further strains resources, forcing agencies to balance maintenance with the need for physical hardening of assets.
  • These persistent issues threaten to undermine long-term sustainability goals and operational continuity without new funding models and a focus on workplace security measures.

Exclusive Technavio Analysis on Customer Landscape

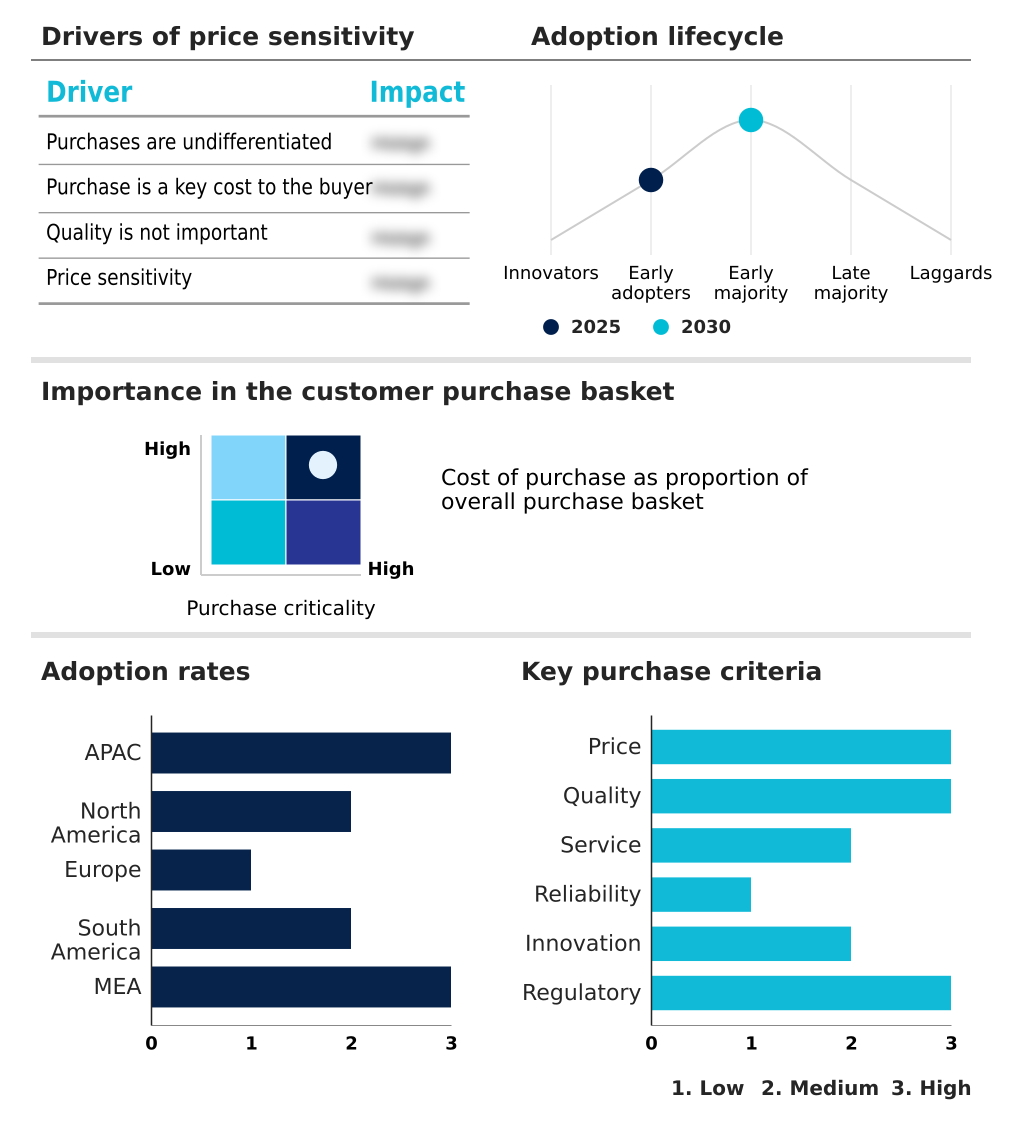
The public transportation market forecasting report includes the adoption lifecycle of the market, covering from the innovator’s stage to the laggard’s stage. It focuses on adoption rates in different regions based on penetration. Furthermore, the public transportation market report also includes key purchase criteria and drivers of price sensitivity to help companies evaluate and develop their market growth analysis strategies.

Customer Landscape of Public Transportation Industry

Competitive Landscape

Companies are implementing various strategies, such as strategic alliances, public transportation market forecast, partnerships, mergers and acquisitions, geographical expansion, and product/service launches, to enhance their presence in the industry.

Bay Area Rapid Transit - Operations feature integrated heavy rail, airport express, and light rail systems, establishing a comprehensive and reliable rapid transit network for high-capacity urban mobility.

The industry research and growth report includes detailed analyses of the competitive landscape of the market and information about key companies, including:

  • Bay Area Rapid Transit
  • BC Transit Corp
  • Chicago Transit Authority
  • Deutsche Bahn AG
  • East Japan Railway Co.
  • FirstGroup plc
  • London and Partners Ltd.
  • Massachusetts Bay Transportation
  • Metro de Madrid SA
  • Metrolink
  • Metropolitan Transportation
  • MTR Corp. Ltd.
  • San Diego Metropolitan Transit
  • Seoul Tourism Organization
  • Sin U Lian Group
  • SNCF Group
  • STIB
  • Transdev Group SA
  • Washington Metropolitan

Qualitative and quantitative analysis of companies has been conducted to help clients understand the wider business environment as well as the strengths and weaknesses of key industry players. Data is qualitatively analyzed to categorize companies as pure play, category-focused, industry-focused, and diversified; it is quantitatively analyzed to categorize companies as dominant, leading, strong, tentative, and weak.

Recent Development and News in Public transportation market

  • In May, 2025, the United States Federal Transit Administration released its fiscal year 2026 budget estimates, requesting over fourteen billion dollars in formula grants to sustain core transit programs amid changing revenue models.
  • In August, 2025, the city of Santiago de Chile advanced its fleet electrification goals by adding 176 electric buses to its network, progressing toward its target of incorporating 1,800 zero-emission vehicles.
  • In September, 2025, the European Union finalized projects for constructing and upgrading multimodal passenger hubs in cities like Marseille and Bolzano, designed to integrate high-speed rail, metro, and bus services.
  • In November, 2025, Metro Transit in St. Louis announced the installation of state-of-the-art fare validators and a new mobile application to support contactless payments and fare capping for passengers.

Dive into Technavio’s robust research methodology, blending expert interviews, extensive data synthesis, and validated models for unparalleled Public Transportation Market insights. See full methodology.

Market Scope
Page number 288
Base year 2025
Historic period 2020-2024
Forecast period 2026-2030
Growth momentum & CAGR Accelerate at a CAGR of 6.6%
Market growth 2026-2030 USD 121.4 billion
Market structure Fragmented
YoY growth 2025-2026(%) 6.2%
Key countries India, Japan, China, South Korea, Australia, Indonesia, US, Mexico, Canada, Germany, Russia, France, UK, Spain, The Netherlands, Brazil, Argentina, Colombia, South Africa, Saudi Arabia, UAE, Egypt and Nigeria
Competitive landscape Leading Companies, Market Positioning of Companies, Competitive Strategies, and Industry Risks

Request Free Sample

Research Analyst Overview

  • The public transportation market is in a period of critical infrastructure revitalization, where strategic decisions on capital expenditure are paramount. Boardroom-level discussions are weighing the long-term life-cycle costs of systemic electrification against the immediate demands of rail infrastructure upgrades.
  • The transition is complex, involving not just the adoption of battery-electric alternatives and hydrogen-powered alternatives, but also the deployment of advanced energy management and digital control systems. Modernization extends to the passenger interface with account-based ticketing, QR-based ticketing, and biometric-ready interfaces becoming standard.
  • Operationally, the integration of intelligent fleet management, predictive analytics, and predictive maintenance has proven to reduce rolling stock failures by over 30%. This shift toward data-driven operations relies on advanced signaling, software-integrated sensors for real-time object detection, and vehicle-to-everything communication.
  • However, this technological push is challenged by the need for physical resilience against threats like track washouts and the necessity for flood defenses, alongside managing issues like congestion pricing and value-capture taxes. Success requires balancing innovation—from fare capping and open-loop payment systems to automated safety systems—with the practicalities of maintaining aging assets and addressing risks like the fiscal cliff.

What are the Key Data Covered in this Public Transportation Market Research and Growth Report?

  • What is the expected growth of the Public Transportation Market between 2026 and 2030?

    • USD 121.4 billion, at a CAGR of 6.6%

  • What segmentation does the market report cover?

    • The report is segmented by Type (Bus, Metro, Suburban rail, and Light rail transit), Distribution Channel (Offline, and Online), Powertrain Type (Diesel fleets, Hybrid transit vehicles, and Battery-electric buses) and Geography (APAC, North America, Europe, South America, Middle East and Africa)

  • Which regions are analyzed in the report?

    • APAC, North America, Europe, South America and Middle East and Africa

  • What are the key growth drivers and market challenges?

    • Acceleration of decarbonization and zero-emission mandates, Workforce depletion and crisis of driver retention

  • Who are the major players in the Public Transportation Market?

    • Bay Area Rapid Transit, BC Transit Corp, Chicago Transit Authority, Deutsche Bahn AG, East Japan Railway Co., FirstGroup plc, London and Partners Ltd., Massachusetts Bay Transportation, Metro de Madrid SA, Metrolink, Metropolitan Transportation, MTR Corp. Ltd., San Diego Metropolitan Transit, Seoul Tourism Organization, Sin U Lian Group, SNCF Group, STIB, Transdev Group SA and Washington Metropolitan

Market Research Insights

  • Market dynamics are shaped by a strategic push for passenger experience enhancement, where digitalization initiatives are delivering tangible results. The integration of unified mobility applications and digital-first strategies has improved service accessibility, while real-time data integration allows for more responsive operations, contributing to highway congestion reduction.
  • For example, the deployment of cooperative intelligent transport systems has been shown to improve traffic flow efficiency by over 15% in some corridors. However, agencies face a significant fiscal cliff, as the capital expenditure needed for modernization strains traditional revenue streams. This financial pressure is compounded by the human capital deficit, which affects service reliability.
  • Despite these issues, the focus on regional economic growth through better connectivity and the adoption of seamless multi-modal transfers continues to drive the sector forward, with some electrified networks reporting over 90% coverage.

We can help! Our analysts can customize this public transportation market research report to meet your requirements.

Get in touch

1. Executive Summary

1.1 Market overview

Executive Summary - Chart on Market Overview
Executive Summary - Data Table on Market Overview
Executive Summary - Chart on Global Market Characteristics
Executive Summary - Chart on Market by Geography
Executive Summary - Chart on Market Segmentation by Type
Executive Summary - Chart on Market Segmentation by Distribution Channel
Executive Summary - Chart on Market Segmentation by Powertrain Type
Executive Summary - Chart on Incremental Growth
Executive Summary - Data Table on Incremental Growth
Executive Summary - Chart on Company Market Positioning

2. Technavio Analysis

2.1 Analysis of price sensitivity, lifecycle, customer purchase basket, adoption rates, and purchase criteria

2.2 Criticality of inputs and Factors of differentiation

Chart on Overview on criticality of inputs and factors of differentiation

2.3 Factors of disruption

Chart on Overview on factors of disruption

2.4 Impact of drivers and challenges

Chart on Impact of drivers and challenges in 2025 and 2030

3. Market Landscape

3.1 Market ecosystem

Chart on Parent Market
Data Table on - Parent Market

3.2 Market characteristics

Chart on Market characteristics analysis

3.3 Value chain analysis

Chart on Value chain analysis

4. Market Sizing

4.1 Market definition

Data Table on Offerings of companies included in the market definition

4.2 Market segment analysis

Market segments

4.3 Market size 2025

4.4 Market outlook: Forecast for 2025-2030

Chart on Global - Market size and forecast 2025-2030 ($ billion)
Data Table on Global - Market size and forecast 2025-2030 ($ billion)
Chart on Global Market: Year-over-year growth 2025-2030 (%)
Data Table on Global Market: Year-over-year growth 2025-2030 (%)

5. Historic Market Size

5.1 Global Public Transportation Market 2020 - 2024

Historic Market Size - Data Table on Global Public Transportation Market 2020 - 2024 ($ billion)

5.2 Type segment analysis 2020 - 2024

Historic Market Size - Type Segment 2020 - 2024 ($ billion)

5.3 Distribution Channel segment analysis 2020 - 2024

Historic Market Size - Distribution Channel Segment 2020 - 2024 ($ billion)

5.4 Powertrain Type segment analysis 2020 - 2024

Historic Market Size - Powertrain Type Segment 2020 - 2024 ($ billion)

5.5 Geography segment analysis 2020 - 2024

Historic Market Size - Geography Segment 2020 - 2024 ($ billion)

5.6 Country segment analysis 2020 - 2024

Historic Market Size - Country Segment 2020 - 2024 ($ billion)

6. Qualitative Analysis

6.1 Impact of AI on Global Public Transportation Market

7. Five Forces Analysis

7.1 Five forces summary

Five forces analysis - Comparison between 2025 and 2030

7.2 Bargaining power of buyers

Bargaining power of buyers - Impact of key factors 2025 and 2030

7.3 Bargaining power of suppliers

Bargaining power of suppliers - Impact of key factors in 2025 and 2030

7.4 Threat of new entrants

Threat of new entrants - Impact of key factors in 2025 and 2030

7.5 Threat of substitutes

Threat of substitutes - Impact of key factors in 2025 and 2030

7.6 Threat of rivalry

Threat of rivalry - Impact of key factors in 2025 and 2030

7.7 Market condition

Chart on Market condition - Five forces 2025 and 2030

8. Market Segmentation by Type

8.1 Market segments

Chart on Type - Market share 2025-2030 (%)
Data Table on Type - Market share 2025-2030 (%)

8.2 Comparison by Type

Chart on Comparison by Type
Data Table on Comparison by Type

8.3 Bus - Market size and forecast 2025-2030

Chart on Bus - Market size and forecast 2025-2030 ($ billion)
Data Table on Bus - Market size and forecast 2025-2030 ($ billion)
Chart on Bus - Year-over-year growth 2025-2030 (%)
Data Table on Bus - Year-over-year growth 2025-2030 (%)

8.4 Metro - Market size and forecast 2025-2030

Chart on Metro - Market size and forecast 2025-2030 ($ billion)
Data Table on Metro - Market size and forecast 2025-2030 ($ billion)
Chart on Metro - Year-over-year growth 2025-2030 (%)
Data Table on Metro - Year-over-year growth 2025-2030 (%)

8.5 Suburban rail - Market size and forecast 2025-2030

Chart on Suburban rail - Market size and forecast 2025-2030 ($ billion)
Data Table on Suburban rail - Market size and forecast 2025-2030 ($ billion)
Chart on Suburban rail - Year-over-year growth 2025-2030 (%)
Data Table on Suburban rail - Year-over-year growth 2025-2030 (%)

8.6 Light rail transit - Market size and forecast 2025-2030

Chart on Light rail transit - Market size and forecast 2025-2030 ($ billion)
Data Table on Light rail transit - Market size and forecast 2025-2030 ($ billion)
Chart on Light rail transit - Year-over-year growth 2025-2030 (%)
Data Table on Light rail transit - Year-over-year growth 2025-2030 (%)

8.7 Market opportunity by Type

Market opportunity by Type ($ billion)
Data Table on Market opportunity by Type ($ billion)

9. Market Segmentation by Distribution Channel

9.1 Market segments

Chart on Distribution Channel - Market share 2025-2030 (%)
Data Table on Distribution Channel - Market share 2025-2030 (%)

9.2 Comparison by Distribution Channel

Chart on Comparison by Distribution Channel
Data Table on Comparison by Distribution Channel

9.3 Offline - Market size and forecast 2025-2030

Chart on Offline - Market size and forecast 2025-2030 ($ billion)
Data Table on Offline - Market size and forecast 2025-2030 ($ billion)
Chart on Offline - Year-over-year growth 2025-2030 (%)
Data Table on Offline - Year-over-year growth 2025-2030 (%)

9.4 Online - Market size and forecast 2025-2030

Chart on Online - Market size and forecast 2025-2030 ($ billion)
Data Table on Online - Market size and forecast 2025-2030 ($ billion)
Chart on Online - Year-over-year growth 2025-2030 (%)
Data Table on Online - Year-over-year growth 2025-2030 (%)

9.5 Market opportunity by Distribution Channel

Market opportunity by Distribution Channel ($ billion)
Data Table on Market opportunity by Distribution Channel ($ billion)

10. Market Segmentation by Powertrain Type

10.1 Market segments

Chart on Powertrain Type - Market share 2025-2030 (%)
Data Table on Powertrain Type - Market share 2025-2030 (%)

10.2 Comparison by Powertrain Type

Chart on Comparison by Powertrain Type
Data Table on Comparison by Powertrain Type

10.3 Diesel fleets - Market size and forecast 2025-2030

Chart on Diesel fleets - Market size and forecast 2025-2030 ($ billion)
Data Table on Diesel fleets - Market size and forecast 2025-2030 ($ billion)
Chart on Diesel fleets - Year-over-year growth 2025-2030 (%)
Data Table on Diesel fleets - Year-over-year growth 2025-2030 (%)

10.4 Hybrid transit vehicles - Market size and forecast 2025-2030

Chart on Hybrid transit vehicles - Market size and forecast 2025-2030 ($ billion)
Data Table on Hybrid transit vehicles - Market size and forecast 2025-2030 ($ billion)
Chart on Hybrid transit vehicles - Year-over-year growth 2025-2030 (%)
Data Table on Hybrid transit vehicles - Year-over-year growth 2025-2030 (%)

10.5 Battery-electric buses - Market size and forecast 2025-2030

Chart on Battery-electric buses - Market size and forecast 2025-2030 ($ billion)
Data Table on Battery-electric buses - Market size and forecast 2025-2030 ($ billion)
Chart on Battery-electric buses - Year-over-year growth 2025-2030 (%)
Data Table on Battery-electric buses - Year-over-year growth 2025-2030 (%)

10.6 Market opportunity by Powertrain Type

Market opportunity by Powertrain Type ($ billion)
Data Table on Market opportunity by Powertrain Type ($ billion)

11. Customer Landscape

11.1 Customer landscape overview

Analysis of price sensitivity, lifecycle, customer purchase basket, adoption rates, and purchase criteria

12. Geographic Landscape

12.1 Geographic segmentation

Chart on Market share by geography 2025-2030 (%)
Data Table on Market share by geography 2025-2030 (%)

12.2 Geographic comparison

Chart on Geographic comparison
Data Table on Geographic comparison

12.3 APAC - Market size and forecast 2025-2030

Chart on APAC - Market size and forecast 2025-2030 ($ billion)
Data Table on APAC - Market size and forecast 2025-2030 ($ billion)
Chart on APAC - Year-over-year growth 2025-2030 (%)
Data Table on APAC - Year-over-year growth 2025-2030 (%)
Chart on Regional Comparison - APAC
Data Table on Regional Comparison - APAC

12.3.1 India - Market size and forecast 2025-2030

Chart on India - Market size and forecast 2025-2030 ($ billion)
Data Table on India - Market size and forecast 2025-2030 ($ billion)
Chart on India - Year-over-year growth 2025-2030 (%)
Data Table on India - Year-over-year growth 2025-2030 (%)

12.3.2 Japan - Market size and forecast 2025-2030

Chart on Japan - Market size and forecast 2025-2030 ($ billion)
Data Table on Japan - Market size and forecast 2025-2030 ($ billion)
Chart on Japan - Year-over-year growth 2025-2030 (%)
Data Table on Japan - Year-over-year growth 2025-2030 (%)

12.3.3 China - Market size and forecast 2025-2030

Chart on China - Market size and forecast 2025-2030 ($ billion)
Data Table on China - Market size and forecast 2025-2030 ($ billion)
Chart on China - Year-over-year growth 2025-2030 (%)
Data Table on China - Year-over-year growth 2025-2030 (%)

12.3.4 South Korea - Market size and forecast 2025-2030

Chart on South Korea - Market size and forecast 2025-2030 ($ billion)
Data Table on South Korea - Market size and forecast 2025-2030 ($ billion)
Chart on South Korea - Year-over-year growth 2025-2030 (%)
Data Table on South Korea - Year-over-year growth 2025-2030 (%)

12.3.5 Australia - Market size and forecast 2025-2030

Chart on Australia - Market size and forecast 2025-2030 ($ billion)
Data Table on Australia - Market size and forecast 2025-2030 ($ billion)
Chart on Australia - Year-over-year growth 2025-2030 (%)
Data Table on Australia - Year-over-year growth 2025-2030 (%)

12.3.6 Indonesia - Market size and forecast 2025-2030

Chart on Indonesia - Market size and forecast 2025-2030 ($ billion)
Data Table on Indonesia - Market size and forecast 2025-2030 ($ billion)
Chart on Indonesia - Year-over-year growth 2025-2030 (%)
Data Table on Indonesia - Year-over-year growth 2025-2030 (%)

12.4 North America - Market size and forecast 2025-2030

Chart on North America - Market size and forecast 2025-2030 ($ billion)
Data Table on North America - Market size and forecast 2025-2030 ($ billion)
Chart on North America - Year-over-year growth 2025-2030 (%)
Data Table on North America - Year-over-year growth 2025-2030 (%)
Chart on Regional Comparison - North America
Data Table on Regional Comparison - North America

12.4.1 US - Market size and forecast 2025-2030

Chart on US - Market size and forecast 2025-2030 ($ billion)
Data Table on US - Market size and forecast 2025-2030 ($ billion)
Chart on US - Year-over-year growth 2025-2030 (%)
Data Table on US - Year-over-year growth 2025-2030 (%)

12.4.2 Mexico - Market size and forecast 2025-2030

Chart on Mexico - Market size and forecast 2025-2030 ($ billion)
Data Table on Mexico - Market size and forecast 2025-2030 ($ billion)
Chart on Mexico - Year-over-year growth 2025-2030 (%)
Data Table on Mexico - Year-over-year growth 2025-2030 (%)

12.4.3 Canada - Market size and forecast 2025-2030

Chart on Canada - Market size and forecast 2025-2030 ($ billion)
Data Table on Canada - Market size and forecast 2025-2030 ($ billion)
Chart on Canada - Year-over-year growth 2025-2030 (%)
Data Table on Canada - Year-over-year growth 2025-2030 (%)

12.5 Europe - Market size and forecast 2025-2030

Chart on Europe - Market size and forecast 2025-2030 ($ billion)
Data Table on Europe - Market size and forecast 2025-2030 ($ billion)
Chart on Europe - Year-over-year growth 2025-2030 (%)
Data Table on Europe - Year-over-year growth 2025-2030 (%)
Chart on Regional Comparison - Europe
Data Table on Regional Comparison - Europe

12.5.1 Germany - Market size and forecast 2025-2030

Chart on Germany - Market size and forecast 2025-2030 ($ billion)
Data Table on Germany - Market size and forecast 2025-2030 ($ billion)
Chart on Germany - Year-over-year growth 2025-2030 (%)
Data Table on Germany - Year-over-year growth 2025-2030 (%)

12.5.2 Russia - Market size and forecast 2025-2030

Chart on Russia - Market size and forecast 2025-2030 ($ billion)
Data Table on Russia - Market size and forecast 2025-2030 ($ billion)
Chart on Russia - Year-over-year growth 2025-2030 (%)
Data Table on Russia - Year-over-year growth 2025-2030 (%)

12.5.3 France - Market size and forecast 2025-2030

Chart on France - Market size and forecast 2025-2030 ($ billion)
Data Table on France - Market size and forecast 2025-2030 ($ billion)
Chart on France - Year-over-year growth 2025-2030 (%)
Data Table on France - Year-over-year growth 2025-2030 (%)

12.5.4 UK - Market size and forecast 2025-2030

Chart on UK - Market size and forecast 2025-2030 ($ billion)
Data Table on UK - Market size and forecast 2025-2030 ($ billion)
Chart on UK - Year-over-year growth 2025-2030 (%)
Data Table on UK - Year-over-year growth 2025-2030 (%)

12.5.5 Spain - Market size and forecast 2025-2030

Chart on Spain - Market size and forecast 2025-2030 ($ billion)
Data Table on Spain - Market size and forecast 2025-2030 ($ billion)
Chart on Spain - Year-over-year growth 2025-2030 (%)
Data Table on Spain - Year-over-year growth 2025-2030 (%)

12.5.6 The Netherlands - Market size and forecast 2025-2030

Chart on The Netherlands - Market size and forecast 2025-2030 ($ billion)
Data Table on The Netherlands - Market size and forecast 2025-2030 ($ billion)
Chart on The Netherlands - Year-over-year growth 2025-2030 (%)
Data Table on The Netherlands - Year-over-year growth 2025-2030 (%)

12.6 South America - Market size and forecast 2025-2030

Chart on South America - Market size and forecast 2025-2030 ($ billion)
Data Table on South America - Market size and forecast 2025-2030 ($ billion)
Chart on South America - Year-over-year growth 2025-2030 (%)
Data Table on South America - Year-over-year growth 2025-2030 (%)
Chart on Regional Comparison - South America
Data Table on Regional Comparison - South America

12.6.1 Brazil - Market size and forecast 2025-2030

Chart on Brazil - Market size and forecast 2025-2030 ($ billion)
Data Table on Brazil - Market size and forecast 2025-2030 ($ billion)
Chart on Brazil - Year-over-year growth 2025-2030 (%)
Data Table on Brazil - Year-over-year growth 2025-2030 (%)

12.6.2 Argentina - Market size and forecast 2025-2030

Chart on Argentina - Market size and forecast 2025-2030 ($ billion)
Data Table on Argentina - Market size and forecast 2025-2030 ($ billion)
Chart on Argentina - Year-over-year growth 2025-2030 (%)
Data Table on Argentina - Year-over-year growth 2025-2030 (%)

12.6.3 Colombia - Market size and forecast 2025-2030

Chart on Colombia - Market size and forecast 2025-2030 ($ billion)
Data Table on Colombia - Market size and forecast 2025-2030 ($ billion)
Chart on Colombia - Year-over-year growth 2025-2030 (%)
Data Table on Colombia - Year-over-year growth 2025-2030 (%)

12.7 Middle East and Africa - Market size and forecast 2025-2030

Chart on Middle East and Africa - Market size and forecast 2025-2030 ($ billion)
Data Table on Middle East and Africa - Market size and forecast 2025-2030 ($ billion)
Chart on Middle East and Africa - Year-over-year growth 2025-2030 (%)
Data Table on Middle East and Africa - Year-over-year growth 2025-2030 (%)
Chart on Regional Comparison - Middle East and Africa
Data Table on Regional Comparison - Middle East and Africa

12.7.1 South Africa - Market size and forecast 2025-2030

Chart on South Africa - Market size and forecast 2025-2030 ($ billion)
Data Table on South Africa - Market size and forecast 2025-2030 ($ billion)
Chart on South Africa - Year-over-year growth 2025-2030 (%)
Data Table on South Africa - Year-over-year growth 2025-2030 (%)

12.7.2 Saudi Arabia - Market size and forecast 2025-2030

Chart on Saudi Arabia - Market size and forecast 2025-2030 ($ billion)
Data Table on Saudi Arabia - Market size and forecast 2025-2030 ($ billion)
Chart on Saudi Arabia - Year-over-year growth 2025-2030 (%)
Data Table on Saudi Arabia - Year-over-year growth 2025-2030 (%)

12.7.3 UAE - Market size and forecast 2025-2030

Chart on UAE - Market size and forecast 2025-2030 ($ billion)
Data Table on UAE - Market size and forecast 2025-2030 ($ billion)
Chart on UAE - Year-over-year growth 2025-2030 (%)
Data Table on UAE - Year-over-year growth 2025-2030 (%)

12.7.4 Egypt - Market size and forecast 2025-2030

Chart on Egypt - Market size and forecast 2025-2030 ($ billion)
Data Table on Egypt - Market size and forecast 2025-2030 ($ billion)
Chart on Egypt - Year-over-year growth 2025-2030 (%)
Data Table on Egypt - Year-over-year growth 2025-2030 (%)

12.7.5 Nigeria - Market size and forecast 2025-2030

Chart on Nigeria - Market size and forecast 2025-2030 ($ billion)
Data Table on Nigeria - Market size and forecast 2025-2030 ($ billion)
Chart on Nigeria - Year-over-year growth 2025-2030 (%)
Data Table on Nigeria - Year-over-year growth 2025-2030 (%)

12.8 Market opportunity by geography

Market opportunity by geography ($ billion)
Data Tables on Market opportunity by geography ($ billion)

13. Drivers, Challenges, and Opportunity

13.1 Market drivers

Acceleration of decarbonization and zero-emission mandates
Integration of smart city technologies and digitalization
Strategic focus on multi-modal hubs and regional connectivity

13.2 Market challenges

Workforce depletion and crisis of driver retention
Fiscal cliff and sustainability of funding models
Infrastructure resilience and threat of climate volatility

13.3 Impact of drivers and challenges

Impact of drivers and challenges in 2025 and 2030

13.4 Market opportunities

Massive expansion of high-capacity automated rail and sovereign infrastructure
Digitalization and smart ticketing ecosystems
Integration of AI and predictive analytics for operational optimization in public transportation

14. Competitive Landscape

14.1 Overview

14.2

Overview on criticality of inputs and factors of differentiation

14.3 Landscape disruption

Overview on factors of disruption

14.4 Industry risks

Impact of key risks on business

15. Competitive Analysis

15.1 Companies profiled

Companies covered

15.2 Company ranking index

15.3 Market positioning of companies

Matrix on companies position and classification

15.4 Chicago Transit Authority

Chicago Transit Authority - Overview
Chicago Transit Authority - Product / Service
Chicago Transit Authority - Key offerings
SWOT

15.5 Deutsche Bahn AG

Deutsche Bahn AG - Overview
Deutsche Bahn AG - Product / Service
Deutsche Bahn AG - Key offerings
SWOT

15.6 East Japan Railway Co.

East Japan Railway Co. - Overview
East Japan Railway Co. - Product / Service
East Japan Railway Co. - Key offerings
SWOT

15.7 FirstGroup plc

FirstGroup plc - Overview
FirstGroup plc - Product / Service
FirstGroup plc - Key offerings
SWOT

15.8 Massachusetts Bay Transportation

Massachusetts Bay Transportation - Overview
Massachusetts Bay Transportation - Product / Service
Massachusetts Bay Transportation - Key offerings
SWOT

15.9 Metro de Madrid SA

Metro de Madrid SA - Overview
Metro de Madrid SA - Product / Service
Metro de Madrid SA - Key offerings
SWOT

15.10 Metrolink

Metrolink - Overview
Metrolink - Product / Service
Metrolink - Key offerings
SWOT

15.11 Metropolitan Transportation

Metropolitan Transportation - Overview
Metropolitan Transportation - Product / Service
Metropolitan Transportation - Key offerings
SWOT

15.12 MTR Corp. Ltd.

MTR Corp. Ltd. - Overview
MTR Corp. Ltd. - Business segments
MTR Corp. Ltd. - Key news
MTR Corp. Ltd. - Key offerings
MTR Corp. Ltd. - Segment focus
SWOT

15.13 Seoul Tourism Organization

Seoul Tourism Organization - Overview
Seoul Tourism Organization - Product / Service
Seoul Tourism Organization - Key offerings
SWOT

15.14 Sin U Lian Group

Sin U Lian Group - Overview
Sin U Lian Group - Product / Service
Sin U Lian Group - Key offerings
SWOT

15.15 SNCF Group

SNCF Group - Overview
SNCF Group - Product / Service
SNCF Group - Key offerings
SWOT

15.16 STIB

STIB - Overview
STIB - Product / Service
STIB - Key offerings
SWOT

15.17 Transdev Group SA

Transdev Group SA - Overview
Transdev Group SA - Product / Service
Transdev Group SA - Key offerings
SWOT

15.18 Washington Metropolitan

Washington Metropolitan - Overview
Washington Metropolitan - Product / Service
Washington Metropolitan - Key offerings
SWOT

16. Appendix

16.1 Scope of the report

Market definition
Objectives
Notes and caveats

16.2 Inclusions and exclusions checklist

Inclusions checklist
Exclusions checklist

16.3 Currency conversion rates for US$

16.4 Research methodology

16.5 Data procurement

Information sources

16.6 Data validation

16.7 Validation techniques employed for market sizing

16.8 Data synthesis

16.9 360 degree market analysis

16.10 List of abbreviations

Research Methodology

Technavio presents a detailed picture of the market by way of study, synthesis, and summation of data from multiple sources. The analysts have presented the various facets of the market with a particular focus on identifying the key industry influencers. The data thus presented is comprehensive, reliable, and the result of extensive research, both primary and secondary.

INFORMATION SOURCES

Primary sources

  • Manufacturers and suppliers
  • Channel partners
  • Industry experts
  • Strategic decision makers

Secondary sources

  • Industry journals and periodicals
  • Government data
  • Financial reports of key industry players
  • Historical data
  • Press releases

DATA ANALYSIS

Data Synthesis

  • Collation of data
  • Estimation of key figures
  • Analysis of derived insights

Data Validation

  • Triangulation with data models
  • Reference against proprietary databases
  • Corroboration with industry experts

REPORT WRITING

Qualitative

  • Market drivers
  • Market challenges
  • Market trends
  • Five forces analysis

Quantitative

  • Market size and forecast
  • Market segmentation
  • Geographical insights
  • Competitive landscape

Interested in this report?

Get your sample now to see our research methodology and insights!

Download Now

Frequently Asked Questions

Public Transportation market growth will increase by USD 121.4 billion during 2026-2030.

The Public Transportation market is expected to grow at a CAGR of 6.6% during 2026-2030.

Public Transportation market is segmented by Type (Bus, Metro, Suburban rail, Light rail transit) Distribution channel (Offline, Online) Powertrain type (Diesel fleets, Hybrid transit vehicles, Battery-electric buses)

Bay Area Rapid Transit, BC Transit Corp, Chicago Transit Authority, Deutsche Bahn AG, East Japan Railway Co., FirstGroup plc, London and Partners Ltd., Massachusetts Bay Transportation, Metro de Madrid SA, Metrolink, Metropolitan Transportation, MTR Corp. Ltd., San Diego Metropolitan Transit, Seoul Tourism Organization, Sin U Lian Group, SNCF Group, STIB, Transdev Group SA, Washington Metropolitan are a few of the key vendors in the Public Transportation market.

APAC will register the highest growth rate of 34.8% among the other regions. Therefore, the Public Transportation market in APAC is expected to garner significant business opportunities for the vendors during the forecast period.

India, Japan, China, South Korea, Australia, Indonesia, US, Mexico, Canada, Germany, Russia, France, UK, Spain, The Netherlands, Brazil, Argentina, Colombia, South Africa, Saudi Arabia, UAE, Egypt, Nigeria

  • Acceleration of decarbonization and zero-emission mandates is the driving factor this market.

The Public Transportation market vendors should focus on grabbing business opportunities from the Type segment as it accounted for the largest market share in the base year.