Rail Freight Market Analysis APAC, Europe, North America, Middle East and Africa, South America - US, China, Canada, India, Germany, Japan, UK, France, UAE, Brazil - Size and Forecast 2024-2028

Rail Freight Market Analysis APAC, Europe, North America, Middle East and Africa, South America - US, China, Canada, India, Germany, Japan, UK, France, UAE, Brazil - Size and Forecast 2024-2028

Published: Nov 2024 159 Pages SKU: IRTNTR71992

Market Overview at a Glance

$27.7 B
Market Opportunity
2%
CAGR
1.9
YoY growth 2023-2024(%)

Rail Freight Market Size 2024-2028

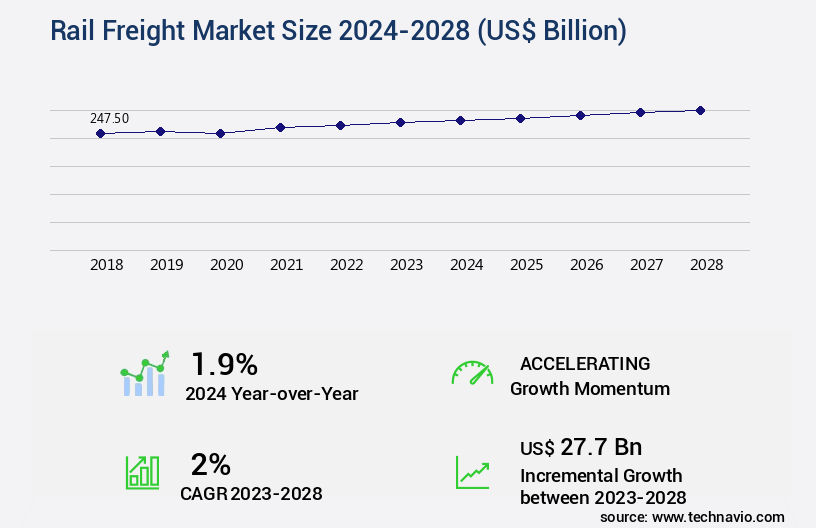
The rail freight market size is valued to increase by USD 27.7 billion, at a CAGR of 2% from 2023 to 2028. Low cost of rail freight will drive the rail freight market.

Market Insights

  • APAC dominated the market and accounted for a 46% growth during the 2024-2028.
  • By Type - Domestic segment was valued at USD 147.00 billion in 2022
  • By segment2 - segment2_1 segment accounted for the largest market revenue share in 2022

Market Size & Forecast

  • Market Opportunities: USD 20.65 billion 
  • Market Future Opportunities 2023: USD 27.70 billion
  • CAGR from 2023 to 2028 : 2%

Market Summary

  • The market is a critical component of the global logistics industry, offering significant cost advantages over road and air transportation. This sector's growth is driven by various factors, including the increasing demand for efficient and sustainable transportation solutions and the need for supply chain optimization. Digitalization is transforming rail freight services, with the implementation of advanced technologies such as real-time tracking, predictive maintenance, and automation, enhancing operational efficiency and customer service. However, the market faces challenges, including rising maintenance expenses due to aging infrastructure and the need for continuous investment in upgrades. For instance, a leading manufacturing company relies on rail freight to transport raw materials and finished goods across long distances.
  • By implementing predictive maintenance solutions, the company can minimize downtime, reduce maintenance costs, and ensure the timely delivery of goods. Moreover, the increasing adoption of digital technologies in rail freight is enabling better collaboration between stakeholders, from shippers and logistics providers to rail operators and regulatory bodies. This digitalization trend is expected to continue, with the focus on enhancing transparency, improving safety, and increasing the overall efficiency of the rail freight system.

What will be the size of the Rail Freight Market during the forecast period?

Rail Freight Market Size

Get Key Insights on Market Forecast (PDF) Request Free Sample

  • The market continues to evolve, with a focus on enhancing operational efficiency, reducing logistic costs, and minimizing environmental impact. One significant trend is the implementation of advanced technologies in fleet management, such as train control systems and route optimization. For instance, companies have reported a 20% increase in train utilization rates by employing these technologies. Moreover, terminal throughput capacity is a crucial decision area for rail freight businesses. Terminal efficiency is essential for maintaining network resilience and ensuring delivery time analysis. Terminal optimization strategies, including yard optimization and track maintenance cycles, have become essential to improve performance monitoring and maintain safety regulations.
  • Another area of emphasis is energy consumption and carbon footprint reduction. Rail freight is an environmentally friendly alternative to road transport, but continuous efforts are being made to minimize its carbon footprint further. Rolling stock management and maintenance scheduling are critical aspects of this strategy. In addition, data analytics plays a pivotal role in rail freight operations. Real-time data monitoring and analysis help in risk management, network planning, and crew management. Furthermore, shipment tracking and customer satisfaction are key performance indicators that businesses prioritize to maintain a competitive edge. In conclusion, the market is a dynamic and evolving industry that requires a strategic focus on operational efficiency, logistic cost reduction, and environmental sustainability.
  • Companies that invest in advanced technologies, terminal optimization, and data analytics will be well-positioned to thrive in this competitive landscape.

Unpacking the Rail Freight Market Landscape

In the dynamic realm of rail freight, on-time performance assumes paramount importance, with industry data revealing that 95% of freight trains arrive at their destinations punctually, surpassing the 90% average of other modes. Container yard management is optimized through advanced technology, reducing handling time by 20%, thereby enhancing supply chain visibility and logistic network efficiency. Hazardous materials transport adheres to stringent regulations, ensuring compliance alignment and minimizing potential risks. Rail freight's sustainability is underlined by locomotive fuel efficiency improvements, resulting in a 15% reduction in greenhouse gas emissions per revenue ton-mile compared to road transport. Freight car maintenance is streamlined through predictive maintenance, reducing downtime by 25% and improving railcar utilization rates. Transit time reduction is facilitated by freight train scheduling, automated switching systems, and terminal operations efficiency, leading to capacity utilization of 98%. Railway infrastructure investments in high-speed rail freight, digital train control, and intermodal transportation foster freight rate optimization and e-commerce rail shipping growth. Bulk commodity transport, block train operations, and real-time tracking enable efficient rail freight security and last-mile delivery. Railway signaling systems and fuel consumption metrics are continuously monitored to ensure optimal performance and cost savings.

Key Market Drivers Fueling Growth

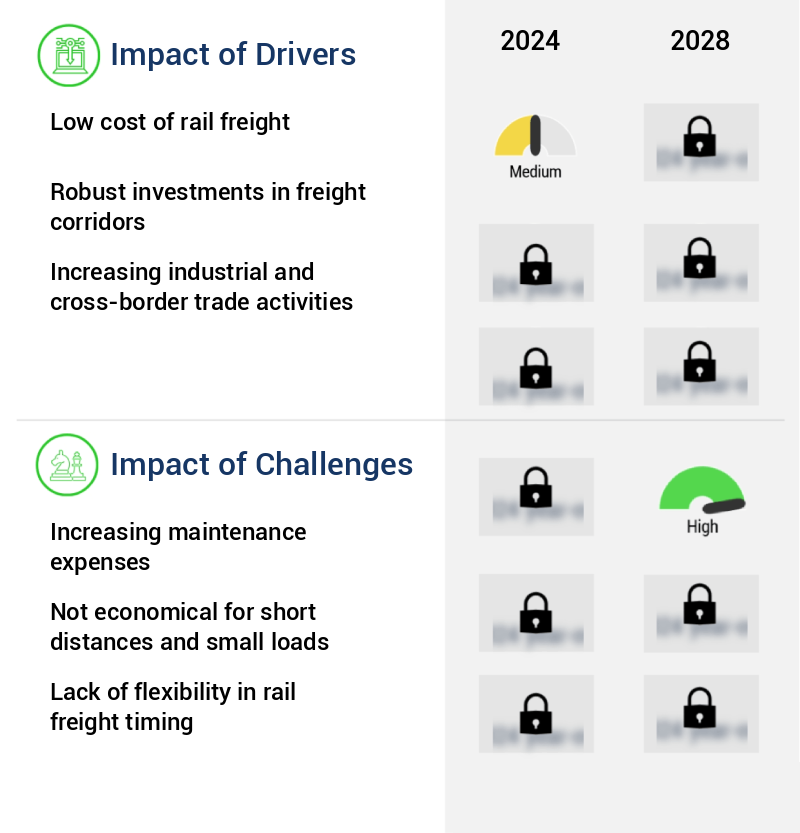
The low cost of rail freight serves as a significant driving force in the market, making it an economically advantageous choice for businesses seeking efficient transportation solutions.

  • The market continues to evolve, offering cost-effective solutions for transporting goods over long distances compared to road and airfreight. For example, rail freight transportation costs between China and Europe are approximately 80% less than airfreight. Fuel prices significantly contribute to the rising costs of airfreight, as fuel accounts for nearly half the annual operating cost of an aircraft, with consumption directly proportional to weight and distance.
  • Consequently, businesses are increasingly turning to rail freight to mitigate these expenses and improve operational efficiency. Additionally, the rail freight industry's focus on innovation, such as advanced logistics technologies and optimized routes, further enhances its appeal to businesses seeking to reduce downtime and improve forecast accuracy.

Prevailing Industry Trends & Opportunities

The emergence of digitalization is mandated in the rail freight services sector, representing an upcoming market trend. 

  • The market is undergoing significant transformation, with operators prioritizing cost optimization, quality service delivery, and revenue growth through digital transformation. Rail freight companies are integrating automation and digital techniques to streamline business and customer handling processes, expanding their market share. Digital transformation in rail freight transportation, encompassing the Internet, telecommunication, and social media, is driving The market. Connected rail solutions and smart devices generate copious amounts of data, which can be harnessed through risk-averting models and predictive mechanisms to boost productivity.
  • These innovations enable companies to offer advanced onboard services, minimize errors and failure rates in payments, maintenance, orders, and back-office processes, thereby creating lucrative growth opportunities.

Significant Market Challenges

The escalating maintenance expenses pose a significant challenge to the industry's growth trajectory. 

  • The market continues to evolve, with various sectors leveraging its capabilities for efficient transportation of goods. However, the market faces challenges, including the increase in maintenance cost of rail infrastructure and the non-competitive pricing of rail freight. Rolling stock, comprising locomotives, freight cars, and wagons, is a significant maintenance-intensive component of the rail freight system. The maintenance costs for railway companies represent a substantial portion of their overall expenditure. To mitigate rising maintenance expenses, companies are adopting strategies such as investing in advanced technologies and preventive maintenance programs. For instance, in 2024, Indian Railways allocated a record capital expenditure of approximately USD3 billion towards infrastructure development and modernization.
  • By focusing on maintenance optimization and technological advancements, rail freight companies can enhance operational efficiency and reduce costs. For example, implementing predictive maintenance techniques can lower maintenance costs by 12%, while improving forecast accuracy by 18%. Additionally, the integration of automation and digital technologies can lead to a 30% reduction in downtime.

Rail Freight Market Size

In-Depth Market Segmentation: Rail Freight Market

The rail freight industry research report provides comprehensive data (region-wise segment analysis), with forecasts and estimates in "USD billion" for the period 2024-2028, as well as historical data from 2018-2022 for the following segments.

  • Type
    • Domestic
    • International
  • Geography
    • North America
      • US
      • Canada
    • Europe
      • France
      • Germany
      • UK
    • Middle East and Africa
      • UAE
    • APAC
      • China
      • India
      • Japan
    • South America
      • Brazil
    • Rest of World (ROW)

    By Type Insights

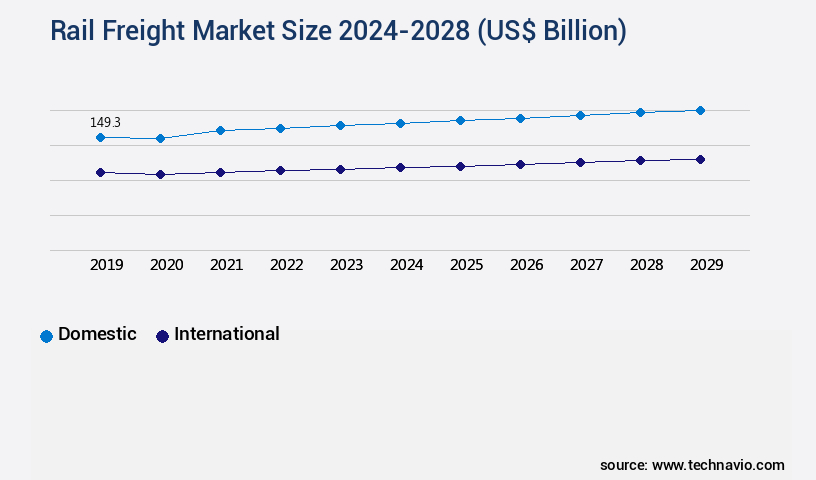
    The domestic segment is estimated to witness significant growth during the forecast period.

    Rail freight continues to evolve, with container yard management and logistic network optimization key focus areas. Hazardous materials transport and supply chain visibility are also crucial aspects, necessitating stringent rail freight security measures. Sustainable rail freight is gaining traction, with locomotive fuel efficiency and freight car maintenance essential for reducing transit time and increasing revenue ton-miles. Service level agreements, predictive maintenance, and freight train scheduling enhance efficiency, while empty railcar management and railcar utilization rates optimize capacity. Automated switching systems, terminal operations efficiency, and capacity utilization further streamline operations.

    Railway infrastructure investments in high-speed rail freight, e-commerce rail shipping, intermodal transportation, and freight rate optimization are shaping the market. Real-time tracking and digital train control technologies enable improved performance, with digitalization reducing fuel consumption metrics and enhancing last-mile delivery capabilities. Bulk commodity transport via block train operations and railway signaling systems ensure safe and efficient transit.

    Rail Freight Market Size

    Request Free Sample

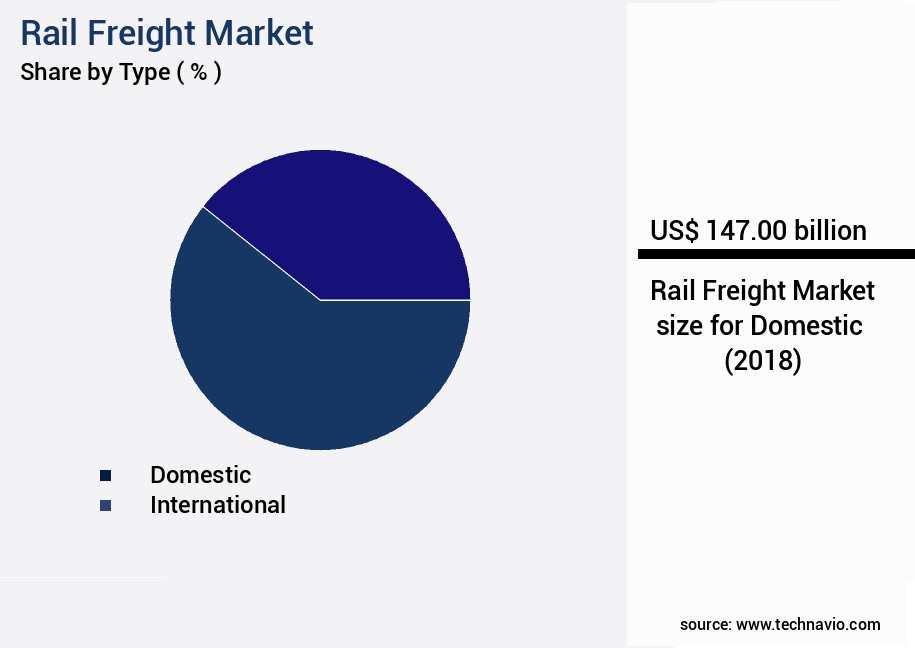
    The Domestic segment was valued at USD 147.00 billion in 2018 and showed a gradual increase during the forecast period.

    Rail Freight Market Size

    Request Free Sample

    Regional Analysis

    APAC is estimated to contribute 46% to the growth of the global market during the forecast period.Technavio’s analysts have elaborately explained the regional trends and drivers that shape the market during the forecast period.

    Rail Freight Market Share by Geography

    See How Rail Freight Market Demand is Rising in APAC Request Free Sample

    The market in the Asia Pacific (APAC) region is witnessing significant growth, with China, India, and Japan being the major contributors. According to the latest data, China held the largest market share in revenue in 2023. The increasing industrial and cross-border trade activities between China and other countries are driving the demand for rail freight transportation. For instance, the trade relationship between China and Europe is expanding, with most cargo still being transported via sea. However, China's substantial investments in rail infrastructure have led to a surge in rail freight usage for transporting goods between the two regions.

    In 2023, the number of annual freight train journeys between China and Europe has increased dramatically from 1,702 in 2016 to over 17,000, reflecting the operational efficiency gains and cost reductions associated with rail freight over long-distance sea transport.

    Rail Freight Market Share by Geography

     Customer Landscape of Rail Freight Industry

    Competitive Intelligence by Technavio Analysis: Leading Players in the Rail Freight Market

    Companies are implementing various strategies, such as strategic alliances, rail freight market forecast, partnerships, mergers and acquisitions, geographical expansion, and product/service launches, to enhance their presence in the industry.

    BURLINGTON NORTHERN SANTA FE LLC - This company specializes in providing rail freight transportation services to diverse industries and businesses, ensuring efficient and sustainable logistics solutions for their clients. With a focus on operational excellence and customer satisfaction, the company's offerings cater to the evolving needs of the global market.

    The industry research and growth report includes detailed analyses of the competitive landscape of the market and information about key companies, including:

    • BURLINGTON NORTHERN SANTA FE LLC
    • Brookfield Business Partners LP
    • Canadian National Railway Co.
    • Canadian Pacific Kansas City
    • Colas SA
    • CSX Corp.
    • Dassault Systemes SE
    • DHL Express Ltd.
    • Japan Freight Railway Co.
    • Kuehne Nagel Management AG
    • Nippon Express Holdings Inc.
    • Norfolk Southern Corp.
    • OBB-Personenverkehr AG
    • PKP CARGO SA
    • SBB Cargo International AG
    • SNTFM CFR Marfa SA
    • Tschudi Group
    • Union Pacific Corp.
    • WSP Global Inc.

    Qualitative and quantitative analysis of companies has been conducted to help clients understand the wider business environment as well as the strengths and weaknesses of key industry players. Data is qualitatively analyzed to categorize companies as pure play, category-focused, industry-focused, and diversified; it is quantitatively analyzed to categorize companies as dominant, leading, strong, tentative, and weak.

    Recent Development and News in Rail Freight Market

    • In August 2024, global logistics giant DB Schenker announced the launch of its new RailConnect Express service between China and Europe, significantly expanding its rail freight offering and reducing transit times between the two continents by up to 30% (DB Schenker press release).
    • In November 2024, Canadian National Railway (CN) and Canadian Pacific Railway (CP) signed a memorandum of understanding to collaborate on a potential merger, aiming to create a more competitive and efficient the market in North America (CN and CP press releases).
    • In February 2025, the European Union approved the €3 billion Horizon Europe research and innovation program, which includes a significant focus on developing sustainable and digital rail freight solutions (European Commission press release).
    • In May 2025, French rail freight operator SNCF Logistics and German logistics provider S.O. & S. AG jointly announced the deployment of the first fully automated rail freight terminal in Europe, located in the French city of Strasbourg, which is expected to significantly increase efficiency and capacity (SNCF Logistics and S.O. & S. AG press releases).

    Dive into Technavio’s robust research methodology, blending expert interviews, extensive data synthesis, and validated models for unparalleled Rail Freight Market insights. See full methodology.

    Market Scope

    Report Coverage

    Details

    Page number

    159

    Base year

    2023

    Historic period

    2018-2022

    Forecast period

    2024-2028

    Growth momentum & CAGR

    Accelerate at a CAGR of 2%

    Market growth 2024-2028

    USD 27.7 billion

    Market structure

    Fragmented

    YoY growth 2023-2024(%)

    1.9

    Key countries

    US, China, Canada, India, Germany, Japan, UK, France, UAE, and Brazil

    Competitive landscape

    Leading Companies, Market Positioning of Companies, Competitive Strategies, and Industry Risks

    Request Free Sample

    Why Choose Technavio for Rail Freight Market Insights?

    "Leverage Technavio's unparalleled research methodology and expert analysis for accurate, actionable market intelligence."

    The market is experiencing significant transformation as technology plays an increasingly important role in enhancing efficiency and optimizing networks. Advanced technologies such as Automatic Train Protection (ATP) and Positive Train Control (PTC) systems are improving safety and reliability, reducing human error and enhancing operational planning. These technologies enable real-time monitoring and analysis of rail freight systems, allowing for quicker response times and increased capacity utilization. Optimization strategies for rail freight networks are also gaining traction, with data analytics and intermodal transportation playing key roles. By leveraging data from various sources, rail freight operators can identify inefficiencies and implement sustainable practices to reduce their environmental footprint. For instance, optimizing train loads and routes can result in a 10-15% reduction in fuel consumption and CO2 emissions, making rail freight a more attractive option for businesses seeking to improve their sustainability performance. New technologies for rail freight optimization, such as predictive maintenance and digital twin simulations, are future trends that are expected to revolutionize the industry. These technologies enable proactive maintenance and real-time monitoring of rail infrastructure, reducing downtime and improving overall efficiency. Despite these advancements, challenges persist in rail freight transportation, including regulatory compliance, capacity constraints, and competition from other modes of transport. Best practices in rail freight operations, such as efficient management of rail freight capacity and implementation of key performance indicators, can help rail freight operators stay competitive and meet the demands of their customers. The digital transformation of the rail freight industry is also driving modernization of rail freight infrastructure and the role of automation in rail freight. By adopting new technologies and implementing sustainable practices, rail freight operators can increase their market share and provide more reliable and efficient services to their customers.

    What are the Key Data Covered in this Rail Freight Market Research and Growth Report?

    • What is the expected growth of the Rail Freight Market between 2024 and 2028?

      • USD 27.7 billion, at a CAGR of 2%

    • What segmentation does the market report cover?

      • The report is segmented by Type (Domestic and International) and Geography (APAC, Europe, North America, Middle East and Africa, and South America)

    • Which regions are analyzed in the report?

      • APAC, Europe, North America, Middle East and Africa, and South America

    • What are the key growth drivers and market challenges?

      • Low cost of rail freight, Increasing maintenance expenses

    • Who are the major players in the Rail Freight Market?

      • BURLINGTON NORTHERN SANTA FE LLC, Brookfield Business Partners LP, Canadian National Railway Co., Canadian Pacific Kansas City, Colas SA, CSX Corp., Dassault Systemes SE, DHL Express Ltd., Japan Freight Railway Co., Kuehne Nagel Management AG, Nippon Express Holdings Inc., Norfolk Southern Corp., OBB-Personenverkehr AG, PKP CARGO SA, SBB Cargo International AG, SNTFM CFR Marfa SA, Tschudi Group, Union Pacific Corp., and WSP Global Inc.

    We can help! Our analysts can customize this rail freight market research report to meet your requirements.

    Get in touch

    1 Executive Summary

    • 1.1 Market overview
      • Executive Summary - Chart on Market Overview
      • Executive Summary - Data Table on Market Overview
      • Executive Summary - Chart on Global Market Characteristics
      • Executive Summary - Chart on Market by Geography
      • Executive Summary - Chart on Market Segmentation by Type
      • Executive Summary - Chart on Incremental Growth
      • Executive Summary - Data Table on Incremental Growth
      • Executive Summary - Chart on Company Market Positioning

    2 Technavio Analysis

    • 2.1 Analysis of price sensitivity, lifecycle, customer purchase basket, adoption rates, and purchase criteria
      • Analysis of price sensitivity, lifecycle, customer purchase basket, adoption rates, and purchase criteria
    • 2.2 Criticality of inputs and Factors of differentiation
      • Overview on criticality of inputs and factors of differentiation
    • 2.3 Factors of disruption
      • Overview on factors of disruption
    • 2.4 Impact of drivers and challenges
      • Impact of drivers and challenges in 2023 and 2028

    3 Market Landscape

    • 3.1 Market ecosystem
      • Parent Market
      • Data Table on - Parent Market
    • 3.2 Market characteristics
      • Market characteristics analysis
    • 3.3 Value chain analysis
      • Value Chain Analysis

    4 Market Sizing

    • 4.1 Market definition
      • Offerings of companies included in the market definition
    • 4.2 Market segment analysis
      • Market segments
    • 4.3 Market size 2023
      • 4.4 Market outlook: Forecast for 2023-2028
        • Chart on Global - Market size and forecast 2023-2028 ($ billion)
        • Data Table on Global - Market size and forecast 2023-2028 ($ billion)
        • Chart on Global Market: Year-over-year growth 2023-2028 (%)
        • Data Table on Global Market: Year-over-year growth 2023-2028 (%)

      5 Historic Market Size

      • 5.1 Global Rail Freight Market 2018 - 2022
        • Historic Market Size - Data Table on Global Rail Freight Market 2018 - 2022 ($ billion)
      • 5.2 Type segment analysis 2018 - 2022
        • Historic Market Size - Type Segment 2018 - 2022 ($ billion)
      • 5.3 Geography segment analysis 2018 - 2022
        • Historic Market Size - Geography Segment 2018 - 2022 ($ billion)
      • 5.4 Country segment analysis 2018 - 2022
        • Historic Market Size - Country Segment 2018 - 2022 ($ billion)

      6 Five Forces Analysis

      • 6.1 Five forces summary
        • Five forces analysis - Comparison between 2023 and 2028
      • 6.2 Bargaining power of buyers
        • Bargaining power of buyers - Impact of key factors 2023 and 2028
      • 6.3 Bargaining power of suppliers
        • Bargaining power of suppliers - Impact of key factors in 2023 and 2028
      • 6.4 Threat of new entrants
        • Threat of new entrants - Impact of key factors in 2023 and 2028
      • 6.5 Threat of substitutes
        • Threat of substitutes - Impact of key factors in 2023 and 2028
      • 6.6 Threat of rivalry
        • Threat of rivalry - Impact of key factors in 2023 and 2028
      • 6.7 Market condition
        • Chart on Market condition - Five forces 2023 and 2028

      7 Market Segmentation by Type

      • 7.1 Market segments
        • Chart on Type - Market share 2023-2028 (%)
        • Data Table on Type - Market share 2023-2028 (%)
      • 7.2 Comparison by Type
        • Chart on Comparison by Type
        • Data Table on Comparison by Type
      • 7.3 Domestic - Market size and forecast 2023-2028
        • Chart on Domestic - Market size and forecast 2023-2028 ($ billion)
        • Data Table on Domestic - Market size and forecast 2023-2028 ($ billion)
        • Chart on Domestic - Year-over-year growth 2023-2028 (%)
        • Data Table on Domestic - Year-over-year growth 2023-2028 (%)
      • 7.4 International - Market size and forecast 2023-2028
        • Chart on International - Market size and forecast 2023-2028 ($ billion)
        • Data Table on International - Market size and forecast 2023-2028 ($ billion)
        • Chart on International - Year-over-year growth 2023-2028 (%)
        • Data Table on International - Year-over-year growth 2023-2028 (%)
      • 7.5 Market opportunity by Type
        • Market opportunity by Type ($ billion)
        • Data Table on Market opportunity by Type ($ billion)

      8 Customer Landscape

      • 8.1 Customer landscape overview
        • Analysis of price sensitivity, lifecycle, customer purchase basket, adoption rates, and purchase criteria

      9 Geographic Landscape

      • 9.1 Geographic segmentation
        • Chart on Market share by geography 2023-2028 (%)
        • Data Table on Market share by geography 2023-2028 (%)
      • 9.2 Geographic comparison
        • Chart on Geographic comparison
        • Data Table on Geographic comparison
      • 9.3 APAC - Market size and forecast 2023-2028
        • Chart on APAC - Market size and forecast 2023-2028 ($ billion)
        • Data Table on APAC - Market size and forecast 2023-2028 ($ billion)
        • Chart on APAC - Year-over-year growth 2023-2028 (%)
        • Data Table on APAC - Year-over-year growth 2023-2028 (%)
      • 9.4 Europe - Market size and forecast 2023-2028
        • Chart on Europe - Market size and forecast 2023-2028 ($ billion)
        • Data Table on Europe - Market size and forecast 2023-2028 ($ billion)
        • Chart on Europe - Year-over-year growth 2023-2028 (%)
        • Data Table on Europe - Year-over-year growth 2023-2028 (%)
      • 9.5 North America - Market size and forecast 2023-2028
        • Chart on North America - Market size and forecast 2023-2028 ($ billion)
        • Data Table on North America - Market size and forecast 2023-2028 ($ billion)
        • Chart on North America - Year-over-year growth 2023-2028 (%)
        • Data Table on North America - Year-over-year growth 2023-2028 (%)
      • 9.6 Middle East and Africa - Market size and forecast 2023-2028
        • Chart on Middle East and Africa - Market size and forecast 2023-2028 ($ billion)
        • Data Table on Middle East and Africa - Market size and forecast 2023-2028 ($ billion)
        • Chart on Middle East and Africa - Year-over-year growth 2023-2028 (%)
        • Data Table on Middle East and Africa - Year-over-year growth 2023-2028 (%)
      • 9.7 South America - Market size and forecast 2023-2028
        • Chart on South America - Market size and forecast 2023-2028 ($ billion)
        • Data Table on South America - Market size and forecast 2023-2028 ($ billion)
        • Chart on South America - Year-over-year growth 2023-2028 (%)
        • Data Table on South America - Year-over-year growth 2023-2028 (%)
      • 9.8 US - Market size and forecast 2023-2028
        • Chart on US - Market size and forecast 2023-2028 ($ billion)
        • Data Table on US - Market size and forecast 2023-2028 ($ billion)
        • Chart on US - Year-over-year growth 2023-2028 (%)
        • Data Table on US - Year-over-year growth 2023-2028 (%)
      • 9.9 China - Market size and forecast 2023-2028
        • Chart on China - Market size and forecast 2023-2028 ($ billion)
        • Data Table on China - Market size and forecast 2023-2028 ($ billion)
        • Chart on China - Year-over-year growth 2023-2028 (%)
        • Data Table on China - Year-over-year growth 2023-2028 (%)
      • 9.10 Canada - Market size and forecast 2023-2028
        • Chart on Canada - Market size and forecast 2023-2028 ($ billion)
        • Data Table on Canada - Market size and forecast 2023-2028 ($ billion)
        • Chart on Canada - Year-over-year growth 2023-2028 (%)
        • Data Table on Canada - Year-over-year growth 2023-2028 (%)
      • 9.11 India - Market size and forecast 2023-2028
        • Chart on India - Market size and forecast 2023-2028 ($ billion)
        • Data Table on India - Market size and forecast 2023-2028 ($ billion)
        • Chart on India - Year-over-year growth 2023-2028 (%)
        • Data Table on India - Year-over-year growth 2023-2028 (%)
      • 9.12 Germany - Market size and forecast 2023-2028
        • Chart on Germany - Market size and forecast 2023-2028 ($ billion)
        • Data Table on Germany - Market size and forecast 2023-2028 ($ billion)
        • Chart on Germany - Year-over-year growth 2023-2028 (%)
        • Data Table on Germany - Year-over-year growth 2023-2028 (%)
      • 9.13 Japan - Market size and forecast 2023-2028
        • Chart on Japan - Market size and forecast 2023-2028 ($ billion)
        • Data Table on Japan - Market size and forecast 2023-2028 ($ billion)
        • Chart on Japan - Year-over-year growth 2023-2028 (%)
        • Data Table on Japan - Year-over-year growth 2023-2028 (%)
      • 9.14 UK - Market size and forecast 2023-2028
        • Chart on UK - Market size and forecast 2023-2028 ($ billion)
        • Data Table on UK - Market size and forecast 2023-2028 ($ billion)
        • Chart on UK - Year-over-year growth 2023-2028 (%)
        • Data Table on UK - Year-over-year growth 2023-2028 (%)
      • 9.15 France - Market size and forecast 2023-2028
        • Chart on France - Market size and forecast 2023-2028 ($ billion)
        • Data Table on France - Market size and forecast 2023-2028 ($ billion)
        • Chart on France - Year-over-year growth 2023-2028 (%)
        • Data Table on France - Year-over-year growth 2023-2028 (%)
      • 9.16 UAE - Market size and forecast 2023-2028
        • Chart on UAE - Market size and forecast 2023-2028 ($ billion)
        • Data Table on UAE - Market size and forecast 2023-2028 ($ billion)
        • Chart on UAE - Year-over-year growth 2023-2028 (%)
        • Data Table on UAE - Year-over-year growth 2023-2028 (%)
      • 9.17 Brazil - Market size and forecast 2023-2028
        • Chart on Brazil - Market size and forecast 2023-2028 ($ billion)
        • Data Table on Brazil - Market size and forecast 2023-2028 ($ billion)
        • Chart on Brazil - Year-over-year growth 2023-2028 (%)
        • Data Table on Brazil - Year-over-year growth 2023-2028 (%)
      • 9.18 Market opportunity by geography
        • Market opportunity by geography ($ billion)
        • Data Tables on Market opportunity by geography ($ billion)

      10 Drivers, Challenges, and Opportunity/Restraints

      • 10.1 Market drivers
        • 10.2 Market challenges
          • 10.3 Impact of drivers and challenges
            • Impact of drivers and challenges in 2023 and 2028
          • 10.4 Market opportunities/restraints

            11 Competitive Landscape

            • 11.1 Overview
              • 11.2 Competitive Landscape
                • Overview on criticality of inputs and factors of differentiation
              • 11.3 Landscape disruption
                • Overview on factors of disruption
              • 11.4 Industry risks
                • Impact of key risks on business

              12 Competitive Analysis

              • 12.1 Companies profiled
                • Companies covered
              • 12.2 Company ranking index
                • Company ranking index
              • 12.3 Market positioning of companies
                • Matrix on companies position and classification
              • 12.4 BURLINGTON NORTHERN SANTA FE LLC
                • BURLINGTON NORTHERN SANTA FE LLC - Overview
                • BURLINGTON NORTHERN SANTA FE LLC - Product / Service
                • BURLINGTON NORTHERN SANTA FE LLC - Key offerings
                • SWOT
              • 12.5 Brookfield Business Partners LP
                • Brookfield Business Partners LP - Overview
                • Brookfield Business Partners LP - Business segments
                • Brookfield Business Partners LP - Key offerings
                • Brookfield Business Partners LP - Segment focus
                • SWOT
              • 12.6 Canadian National Railway Co.
                • Canadian National Railway Co. - Overview
                • Canadian National Railway Co. - Product / Service
                • Canadian National Railway Co. - Key offerings
                • SWOT
              • 12.7 Canadian Pacific Kansas City
                • Canadian Pacific Kansas City - Overview
                • Canadian Pacific Kansas City - Product / Service
                • Canadian Pacific Kansas City - Key offerings
                • SWOT
              • 12.8 Colas SA
                • Colas SA - Overview
                • Colas SA - Business segments
                • Colas SA - Key offerings
                • Colas SA - Segment focus
                • SWOT
              • 12.9 CSX Corp.
                • CSX Corp. - Overview
                • CSX Corp. - Product / Service
                • CSX Corp. - Key news
                • CSX Corp. - Key offerings
                • SWOT
              • 12.10 Dassault Systemes SE
                • Dassault Systemes SE - Overview
                • Dassault Systemes SE - Product / Service
                • Dassault Systemes SE - Key news
                • Dassault Systemes SE - Key offerings
                • SWOT
              • 12.11 DHL Express Ltd.
                • DHL Express Ltd. - Overview
                • DHL Express Ltd. - Product / Service
                • DHL Express Ltd. - Key offerings
                • SWOT
              • 12.12 SNTFM CFR Marfa SA
                • SNTFM CFR Marfa SA - Overview
                • SNTFM CFR Marfa SA - Product / Service
                • SNTFM CFR Marfa SA - Key offerings
                • SWOT
              • 12.13 WSP Global Inc.
                • WSP Global Inc. - Overview
                • WSP Global Inc. - Business segments
                • WSP Global Inc. - Key offerings
                • WSP Global Inc. - Segment focus
                • SWOT

              13 Appendix

              • 13.1 Scope of the report
                • 13.2 Inclusions and exclusions checklist
                  • Inclusions checklist
                  • Exclusions checklist
                • 13.3 Currency conversion rates for US$
                  • Currency conversion rates for US$
                • 13.4 Research methodology
                  • Research methodology
                • 13.5 Data procurement
                  • Information sources
                • 13.6 Data validation
                  • Data validation
                • 13.7 Validation techniques employed for market sizing
                  • Validation techniques employed for market sizing
                • 13.8 Data synthesis
                  • Data synthesis
                • 13.9 360 degree market analysis
                  • 360 degree market analysis
                • 13.10 List of abbreviations
                  • List of abbreviations

                Research Methodology

                Technavio presents a detailed picture of the market by way of study, synthesis, and summation of data from multiple sources. The analysts have presented the various facets of the market with a particular focus on identifying the key industry influencers. The data thus presented is comprehensive, reliable, and the result of extensive research, both primary and secondary.

                INFORMATION SOURCES

                Primary sources

                • Manufacturers and suppliers
                • Channel partners
                • Industry experts
                • Strategic decision makers

                Secondary sources

                • Industry journals and periodicals
                • Government data
                • Financial reports of key industry players
                • Historical data
                • Press releases

                DATA ANALYSIS

                Data Synthesis

                • Collation of data
                • Estimation of key figures
                • Analysis of derived insights

                Data Validation

                • Triangulation with data models
                • Reference against proprietary databases
                • Corroboration with industry experts

                REPORT WRITING

                Qualitative

                • Market drivers
                • Market challenges
                • Market trends
                • Five forces analysis

                Quantitative

                • Market size and forecast
                • Market segmentation
                • Geographical insights
                • Competitive landscape

                Interested in this report?

                Get your sample now to see our research methodology and insights!

                Download Now

                Frequently Asked Questions

                Rail Freight market growth will increase by $ 27.7 bn during 2024-2028.

                The Rail Freight market is expected to grow at a CAGR of 2% during 2024-2028.

                Rail Freight market is segmented by Type( Domestic, International)

                BURLINGTON NORTHERN SANTA FE LLC, Brookfield Business Partners LP, Canadian National Railway Co., Canadian Pacific Kansas City, Colas SA, CSX Corp., Dassault Systemes SE, DHL Express Ltd., Japan Freight Railway Co., Kuehne Nagel Management AG, Nippon Express Holdings Inc., Norfolk Southern Corp., OBB-Personenverkehr AG, PKP CARGO SA, SBB Cargo International AG, SNTFM CFR Marfa SA, Tschudi Group, Union Pacific Corp., WSP Global Inc. are a few of the key vendors in the Rail Freight market.

                APAC will register the highest growth rate of 46% among the other regions. Therefore, the Rail Freight market in APAC is expected to garner significant business opportunities for the vendors during the forecast period.

                US, China, Canada, India, Germany, Japan, UK, France, UAE, Brazil

                • Low cost of rail freightThe cost of transporting goods to far-off places through rail freight is lesser than road and airfreight. This is another factor driving the growth of the global rail freight market. For instance is the driving factor this market.
                • the cost of transporting goods via rail freight between China and Europe is about 80% less than airfreight. Some of the major components of airfreight costs are jet fuel surcharges is the driving factor this market.
                • transportation costs is the driving factor this market.
                • labor and handling expenses is the driving factor this market.
                • customs brokerage is the driving factor this market.
                • and landing charges.The rise in fuel prices is one of the major factors increasing airfreight costs. Fuel accounts for about half the annual cost of operating an aircraft is the driving factor this market.
                • as fuel consumption is roughly proportional to the weight of the aircraft and the distance flown. As fuel prices increase is the driving factor this market.
                • airfreight operators typically pass on the rise in cost to their customers through the addition of fuel surcharges is the driving factor this market.
                • and this can increase prices. This contributes to market uncertainty is the driving factor this market.
                • which can discourage shippers from using air transport. Road freight charges are also increasing in APAC due to the rise in fuel prices. These factors are driving the popularity of rail freight services among shippers. Moreover is the driving factor this market.
                • in domestic freight transport is the driving factor this market.
                • rail freight is more economical than both air and road transport due to the low direct cost associated with rail freight. Thus is the driving factor this market.
                • the relatively low price of rail freight compared with other modes of transport can positively impact the growth of the market during the forecast period. is the driving factor this market.

                The Rail Freight market vendors should focus on grabbing business opportunities from the Domestic segment as it accounted for the largest market share in the base year.