3D Display Market Analysis APAC, North America, Europe, South America, Middle East and Africa - US, China, South Korea, Germany, UK - Size and Forecast 2024-2028

3D Display Market Analysis APAC, North America, Europe, South America, Middle East and Africa - US, China, South Korea, Germany, UK - Size and Forecast 2024-2028

Published: Jul 2024 170 Pages SKU: IRTNTR75208

Market Overview at a Glance

$177.1 B
Market Opportunity
25.2%
CAGR
19.81
YoY growth 2023-2024(%)

3D Display Market Size 2024-2028

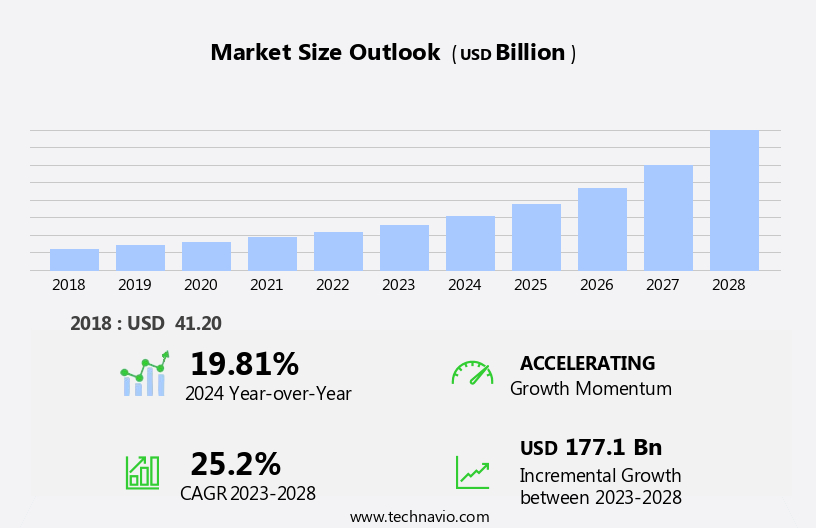
The 3d display market size is forecast to increase by USD 177.1 billion, at a CAGR of 25.2% between 2023 and 2028.

  • The market is experiencing significant growth in various industries, with automotive applications and healthcare being key adopters. The integration of 3D displays in automobiles enhances the driving experience by providing a more immersive and realistic view of the road and environment. In the healthcare sector, 3D displays are increasingly utilized in medical imaging and surgical planning, offering improved accuracy and visualization for medical professionals. However, the high cost associated with 3D display technology poses a significant challenge for market expansion.
  • This obstacle necessitates ongoing research and development efforts to reduce production costs and make 3D displays more accessible and affordable for a broader range of applications and industries. Companies seeking to capitalize on the opportunities presented by the market must focus on innovation and cost reduction strategies to stay competitive and meet the evolving demands of consumers and industries.

What will be the Size of the 3D Display Market during the forecast period?

3D Display Market Size

Explore in-depth regional segment analysis with market size data - historical 2018-2022 and forecasts 2024-2028 - in the full report.  
Request Free Sample

The market continues to evolve, with dynamic advancements in technology shaping its applications across various sectors. 3D tracking technology enhances user experience in entertainment and training, while 3D sensor technology drives the development of head-mounted displays and holographic displays. 3D architectural design offers new perspectives, and 3D market growth is fueled by the integration of 3D mapping and multi-view display. 3D frame rate and display standards optimize viewing, while 3D scanning and 3D depth perception enable precise object recognition and data analysis. Light field display and stereoscopic projection offer immersive experiences, and 3D resolution, convergence, and refresh rate enhance visual quality.

Augmented reality headsets and autostereoscopic displays revolutionize user interaction, and 3D design and modeling facilitate innovative applications. Parallax barrier technology and polarization filters improve 3D visualization, and 3D simulation and animation offer realistic experiences. 3D fatigue and crosstalk are ongoing challenges, while 3D color gamut and contrast enhance content creation. 3D industry trends include voxel display, field of view expansion, and 3D content availability. Depth cues and user interface design optimize the immersive experience, and 3D software development and signage expand consumer adoption. The 3D technology roadmap unfolds with ongoing research and development, shaping the future of 3D applications and market trends.

How is this 3D Display Industry segmented?

The 3d display industry research report provides comprehensive data (region-wise segment analysis), with forecasts and estimates in "USD billion" for the period 2024-2028, as well as historical data from 2018-2022 for the following segments.

  • Type
    • Screen based display
    • Micro display
  • Application
    • Televisions
    • Smartphones
    • Others
  • Geography
    • North America
      • US
    • Europe
      • Germany
      • UK
    • APAC
      • China
      • South Korea
    • Rest of World (ROW)

By Type Insights

The screen based display segment is estimated to witness significant growth during the forecast period.

The market encompasses various technologies, including 3D tracking, sensor technology, and holographic displays, among others. The screen-based display segment leads the market, driven by its widespread adoption in industries such as entertainment, gaming, and education. This segment's growth can be attributed to its ability to deliver an immersive viewing experience, enhancing user engagement and satisfaction. 3D sensors and tracking systems enable depth perception, while head-mounted displays offer a more personalized, interactive experience. 3D architectural design and mapping applications provide innovative solutions for various industries. 3D video capture and processing, along with animation and simulation, are essential components of the 3D content creation process.

3D training and education are becoming increasingly popular, offering a more engaging and effective learning experience. The market is expected to grow, fueled by advancements in 3D technology, such as higher resolution, faster refresh rates, and wider fields of view. 3D rendering, depth cues, and parallax barrier technology contribute to the creation of realistic and immersive 3D visualizations. 3D design, modeling, and navigation are essential for various industries, including healthcare, automotive, and manufacturing. 3D user interfaces and experiences are becoming more common, enhancing the overall user experience. 3D signage and virtual reality headsets offer new opportunities for advertising and entertainment.

The market's future trends include advancements in 3D printing, augmented reality, and immersive experiences. 3D content availability, depth perception, and color gamut are critical factors influencing consumer adoption. 3D technology roadmaps and industry trends indicate continued growth and innovation in this field.

3D Display Market Size

Request Free Sample

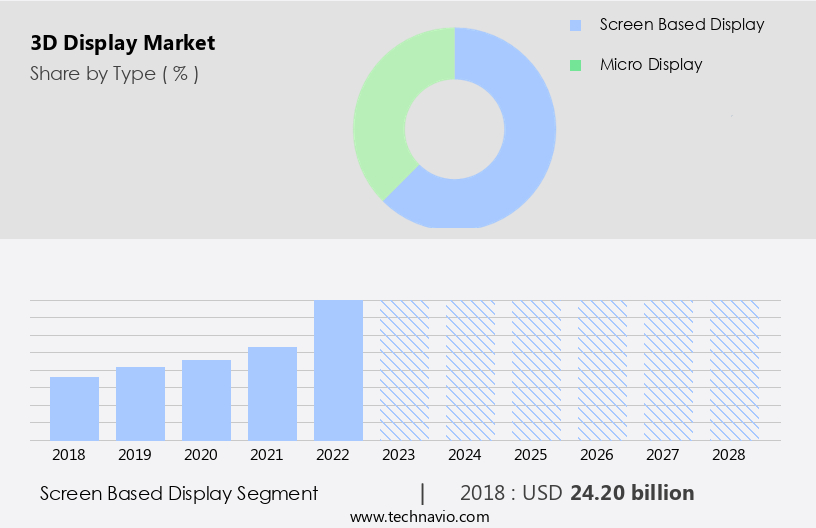
The Screen based display segment was valued at USD 24.20 billion in 2018 and showed a gradual increase during the forecast period.
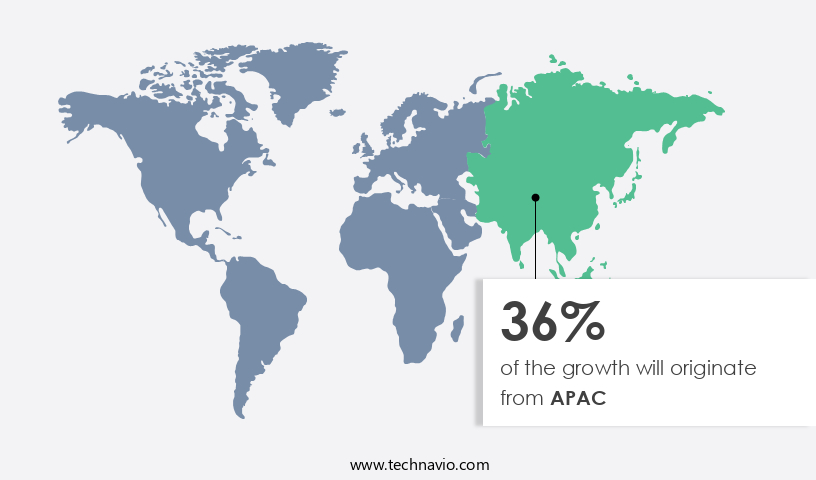
Regional Analysis

APAC is estimated to contribute 36% to the growth of the global market during the forecast period.Technavio's analysts have elaborately explained the regional trends and drivers that shape the market during the forecast period.

3D Display Market Share by Geography

 Request Free Sample

In the dynamic world of technology, the market is witnessing significant advancements, driven by various entities. In the realm of entertainment and interaction, 3D technology offers immersive experiences through movies, video games, and virtual reality. The integration of 3D sensors and tracking systems enhances user experience, enabling interactive applications and real-time 3D mapping. The hardware development sector is pushing the boundaries of 3D display technology through innovations like head-mounted displays, holographic displays, and autostereoscopic displays. These advancements cater to diverse industries, such as architectural design, medical imaging, and education, offering benefits like improved depth perception and enhanced visualization. Moreover, the market growth is fueled by the increasing adoption of 3D technology in various sectors.

For instance, 3D modeling and animation are transforming industries like film, advertising, and product design. Simultaneously, 3D printing and data analysis are revolutionizing manufacturing and research processes. The future trends include advancements in 3D frame rate, resolution, and convergence, ensuring smoother and more realistic viewing experiences. Furthermore, advancements in 3D video processing and content availability are expected to boost consumer adoption. In the realm of 3D display standards, multi-view displays, light field displays, and parallax barrier technology are shaping the future of 3D visualization. Additionally, advancements in 3D glasses technology, such as polarization filters and anaglyph glasses, are improving user comfort and experience.

As the market evolves, it is essential to address challenges like crosstalk, brightness, and fatigue. The industry is also focusing on developing technologies that offer wider fields of view and higher color gamuts. In conclusion, the market is witnessing rapid growth, driven by advancements in technology, expanding applications, and increasing consumer demand. The future holds immense potential for this dynamic and innovative sector.

Market Dynamics

Our researchers analyzed the data with 2023 as the base year, along with the key drivers, trends, and challenges. A holistic analysis of drivers will help companies refine their marketing strategies to gain a competitive advantage.

What are the key market drivers leading to the rise in the adoption of 3D Display Industry?

  • The emergence of 3D displays represents a significant driver for the automotive market, as this technology enhances the driving experience by providing a more immersive and realistic interface for navigation, entertainment, and safety systems. 
  • The market is experiencing significant growth due to its increasing adoption in various industries, particularly in the automotive sector. These advanced displays offer a more immersive and harmonious user experience, enhancing the way information is presented. Parallax barrier technology and 3D simulation are key enablers, providing depth perception and a more natural way of interacting with content. In the automotive industry, 3D displays are utilized for applications like navigation, entertainment, and driver assistance systems, offering a more intuitive and realistic interface. For instance, a 3D navigation system can display a 3D map, providing a more detailed and engaging view of the surrounding area.
  • Furthermore, 3D modeling, 3D image processing, and 3D user interface are essential components that contribute to the market's growth. Additionally, advancements in 3D content availability, 3D software development, and 3D signage are expanding the market's potential applications. Virtual reality headsets are another emerging technology that relies on 3D displays to deliver an immersive experience. The market's future looks promising, driven by the increasing demand for advanced and interactive displays.

What are the market trends shaping the 3D Display Industry?

  • The 3D display technology is gaining significant traction in the medical industry, representing an emerging market trend. This advanced technology is increasingly being adopted for various applications, including medical imaging and surgical planning.
  • 3D display technology has gained significant traction in various industries, particularly in medical applications, entertainment, and architectural design. The integration of 3D tracking and interaction technologies has revolutionized the way data is visualized and experienced. In the medical field, 3D displays are utilized for diagnostic imaging, surgical planning, and training, providing a more immersive and harmonious user experience. For instance, CSpace, a 3D display developed by Coretec, offers high-resolution, full-color images in a glass chamber. This technology enables users to view 360-degree perspectives of the images without the need for additional visualization aids. In the realm of 3D entertainment, head-mounted displays and holographic displays have emerged as popular choices for delivering immersive experiences.
  • Additionally, 3D sensor technology and multi-view display systems are driving the growth of the 3D market. As the technology continues to evolve, advancements in 3D frame rate, brightness, and display standards are expected to further enhance the user experience. Augmented reality headsets are also gaining popularity, offering a blend of real and virtual environments. Overall, the 3D technology roadmap presents exciting opportunities for innovation and growth in various industries.

What challenges does the 3D Display Industry face during its growth?

  • The high cost of implementing 3D display technology is a significant challenge impeding the growth of the industry. 
  • The market faces a significant barrier to growth due to the high cost of devices and associated equipment. While 3D game consoles retail between USD200 and USD400, 3D projectors range from USD1,000 to USD10,000. This price point makes 3D displays an unattainable luxury for individuals in lower-income demographics. The expense doesn't stop at the display; new 3D games and the maintenance and repair costs add to the financial burden. These expenses stem from the intricate technology used in 3D displays, which is more complex than standard displays. Moreover, factors like 3D crosstalk, 3D convergence, and 3D depth perception require specific attention to ensure optimal viewing experience.
  • These factors contribute to the need for 3D glasses, adding to the overall cost. The 3D viewing distance, 3D resolution, 3D refresh rate, stereoscopic projection, depth of field, 3D rendering, 3D visualization, and 3D video processing further add to the complexity and cost of 3D displays. As 3D technology continues to evolve, future trends include advancements in light field displays and 3D printing. However, the high cost of these technologies may limit their widespread adoption. Additionally, concerns regarding 3D fatigue and the potential health effects of prolonged exposure to 3D displays remain ongoing areas of research. Despite these challenges, the market for 3D displays is expected to grow as the technology becomes more accessible and affordable.

Exclusive Customer Landscape

The 3d display market forecasting report includes the adoption lifecycle of the market, covering from the innovator's stage to the laggard's stage. It focuses on adoption rates in different regions based on penetration. Furthermore, the 3d display market report also includes key purchase criteria and drivers of price sensitivity to help companies evaluate and develop their market growth analysis strategies.
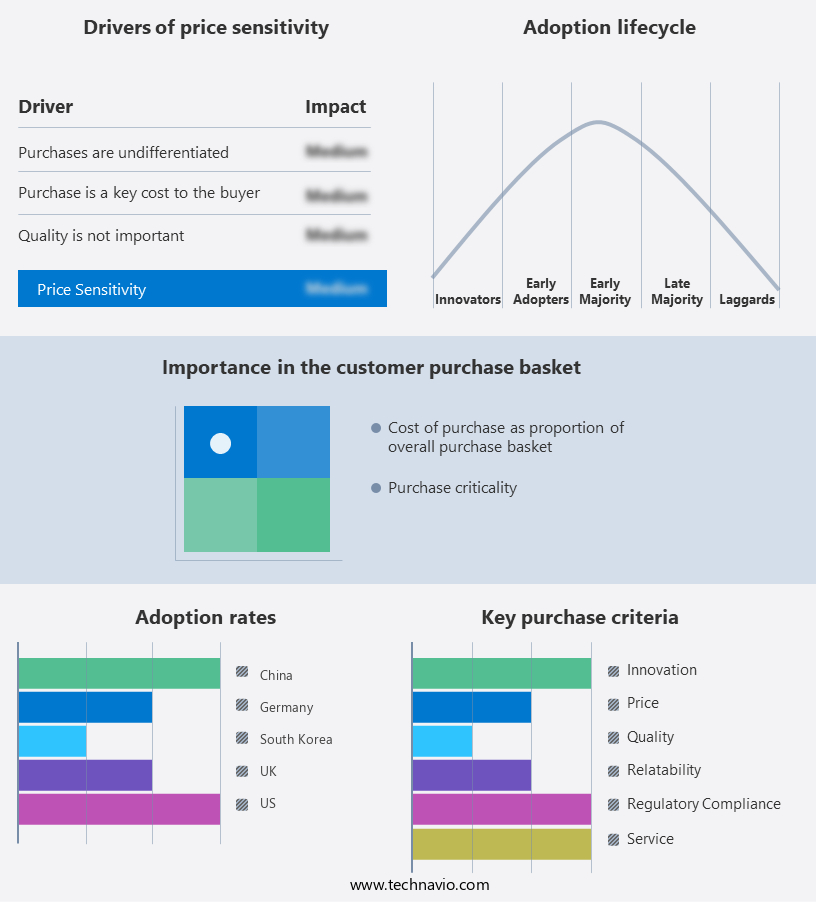
3D Display Market Share by Geography

 Customer Landscape

Key Companies & Market Insights

Companies are implementing various strategies, such as strategic alliances, 3d display market forecast, partnerships, mergers and acquisitions, geographical expansion, and product/service launches, to enhance their presence in the industry.

Alphabet Inc. - The company specializes in advanced 3D display technologies, showcasing innovative solutions such as 3D Swirl. 

The industry research and growth report includes detailed analyses of the competitive landscape of the market and information about key companies, including:

  • Alphabet Inc.
  • AUO Corp.
  • Avalon Holographics Inc.
  • Continental AG
  • Dimenco BV
  • FoVI3D
  • FUJIFILM Holdings Corp.
  • LG Electronics Inc.
  • Mitsubishi Electric Corp.
  • New 3D Technologies Inc.
  • NVIDIA Corp.
  • Ostendo Technologies Inc.
  • Panasonic Holdings Corp.
  • Robert Bosch GmbH
  • Samsung Electronics Co. Ltd.
  • SeeReal Technologies SA
  • Sharp Corp.
  • Sony Group Corp.
  • Toshiba Corp.
  • VividQ Ltd.

Qualitative and quantitative analysis of companies has been conducted to help clients understand the wider business environment as well as the strengths and weaknesses of key industry players. Data is qualitatively analyzed to categorize companies as pure play, category-focused, industry-focused, and diversified; it is quantitatively analyzed to categorize companies as dominant, leading, strong, tentative, and weak.

Recent Development and News in 3D Display Market

  • In February 2024, Samsung Display unveiled its new 110-inch Micro LED 3D TV, showcasing a significant leap in large-format 3D display technology (Samsung Press Release, 2024). This innovative product, featuring over 11 million micro-LEDs, offers enhanced picture quality and depth perception.
  • In July 2024, LG Display and Sony announced a strategic partnership to jointly develop next-generation 3D displays using organic light-emitting diode (OLED) technology (LG Display Newsroom, 2024). This collaboration aims to accelerate the commercialization of high-performance, cost-effective 3D displays for various applications, including gaming, cinema, and education.
  • In October 2024, Osram, a leading lighting solutions provider, secured a €50 million investment from the European Union to develop advanced 3D sensing technologies for various industries, including automotive and consumer electronics (European Commission Press Release, 2024). This funding will contribute to the development of next-generation 3D displays and sensors, enhancing user experiences and expanding market opportunities.
  • In March 2025, Panasonic and Foxconn announced a joint venture to establish a new company, "3DBox," focusing on the production and sales of 3D displays for various markets, including education, healthcare, and entertainment (Panasonic Press Release, 2025). This strategic move will combine Panasonic's expertise in display technology with Foxconn's manufacturing capabilities, aiming to capture a significant market share and drive innovation in the 3D display industry.

Research Analyst Overview

  • The market encompasses a diverse range of applications, from architectural visualization and gaming consoles to healthcare, education, and retail industries. Plasma and LCD technologies, including QLED and OLED, dominate the market, while microLED and 3D privacy technologies are gaining traction. In the entertainment industry, 3D broadcasting and 3D video streaming are transforming the viewing experience, and 3D gaming engines offer immersive experiences for gamers. Industrial design and 3D software libraries facilitate product prototyping and design iterations, while 3D accessibility enhances user experience for individuals with visual impairments. In the healthcare sector, 3D models aid in medical training and patient education.
  • Retail display and digital signage incorporate 3D technology to capture consumers' attention, and 3D ethics and security considerations are essential for ethical and secure 3D content streaming. Mobile devices and desktop computers support 3D applications, including 3D mobile apps and 3D Blu-ray. 3D development kits and LED backlighting enable the creation of custom 3D content, and 3D interaction design ensures intuitive user experiences. Museum exhibits and education and training programs leverage 3D technology to enhance learning and engagement.

Dive into Technavio's robust research methodology, blending expert interviews, extensive data synthesis, and validated models for unparalleled 3D Display Market insights. See full methodology.

Market Scope

Report Coverage

Details

Page number

170

Base year

2023

Historic period

2018-2022

Forecast period

2024-2028

Growth momentum & CAGR

Accelerate at a CAGR of 25.2%

Market growth 2024-2028

USD 177.1 billion

Market structure

Fragmented

YoY growth 2023-2024(%)

19.81

Key countries

US, China, South Korea, Germany, and UK

Competitive landscape

Leading Companies, Market Positioning of Companies, Competitive Strategies, and Industry Risks

Request Free Sample

What are the Key Data Covered in this 3D Display Market Research and Growth Report?

  • CAGR of the 3D Display industry during the forecast period
  • Detailed information on factors that will drive the growth and forecasting between 2024 and 2028
  • Precise estimation of the size of the market and its contribution of the industry in focus to the parent market
  • Accurate predictions about upcoming growth and trends and changes in consumer behaviour
  • Growth of the market across APAC, North America, Europe, South America, and Middle East and Africa
  • Thorough analysis of the market's competitive landscape and detailed information about companies
  • Comprehensive analysis of factors that will challenge the 3d display market growth of industry companies

We can help! Our analysts can customize this 3d display market research report to meet your requirements.

Get in touch

1 Executive Summary

  • 1.1 Market overview
    • Executive Summary - Chart on Market Overview
    • Executive Summary - Data Table on Market Overview
    • Executive Summary - Chart on Global Market Characteristics
    • Executive Summary - Chart on Market by Geography
    • Executive Summary - Chart on Market Segmentation by Type
    • Executive Summary - Chart on Market Segmentation by Application
    • Executive Summary - Chart on Incremental Growth
    • Executive Summary - Data Table on Incremental Growth
    • Executive Summary - Chart on Company Market Positioning

2 Market Landscape

  • 2.1 Market ecosystem
    • Parent Market
    • Data Table on - Parent Market
  • 2.2 Market characteristics
    • Market characteristics analysis
  • 2.3 Value chain analysis
    • Value Chain Analysis

3 Market Sizing

  • 3.1 Market definition
    • Offerings of companies included in the market definition
  • 3.2 Market segment analysis
    • Market segments
  • 3.3 Market size 2023
    • 3.4 Market outlook: Forecast for 2023-2028
      • Chart on Global - Market size and forecast 2023-2028 ($ billion)
      • Data Table on Global - Market size and forecast 2023-2028 ($ billion)
      • Chart on Global Market: Year-over-year growth 2023-2028 (%)
      • Data Table on Global Market: Year-over-year growth 2023-2028 (%)

    4 Historic Market Size

    • 4.1 Global 3D Display Market 2018 - 2022
      • Historic Market Size - Data Table on Global 3D Display Market 2018 - 2022 ($ billion)
    • 4.2 Type segment analysis 2018 - 2022
      • Historic Market Size - Type Segment 2018 - 2022 ($ billion)
    • 4.3 Application segment analysis 2018 - 2022
      • Historic Market Size - Application Segment 2018 - 2022 ($ billion)
    • 4.4 Geography segment analysis 2018 - 2022
      • Historic Market Size - Geography Segment 2018 - 2022 ($ billion)
    • 4.5 Country segment analysis 2018 - 2022
      • Historic Market Size - Country Segment 2018 - 2022 ($ billion)

    5 Five Forces Analysis

    • 5.1 Five forces summary
      • Five forces analysis - Comparison between 2023 and 2028
    • 5.2 Bargaining power of buyers
      • Bargaining power of buyers - Impact of key factors 2023 and 2028
    • 5.3 Bargaining power of suppliers
      • Bargaining power of suppliers - Impact of key factors in 2023 and 2028
    • 5.4 Threat of new entrants
      • Threat of new entrants - Impact of key factors in 2023 and 2028
    • 5.5 Threat of substitutes
      • Threat of substitutes - Impact of key factors in 2023 and 2028
    • 5.6 Threat of rivalry
      • Threat of rivalry - Impact of key factors in 2023 and 2028
    • 5.7 Market condition
      • Chart on Market condition - Five forces 2023 and 2028

    6 Market Segmentation by Type

    • 6.1 Market segments
      • Chart on Type - Market share 2023-2028 (%)
      • Data Table on Type - Market share 2023-2028 (%)
    • 6.2 Comparison by Type
      • Chart on Comparison by Type
      • Data Table on Comparison by Type
    • 6.3 Screen based display - Market size and forecast 2023-2028
      • Chart on Screen based display - Market size and forecast 2023-2028 ($ billion)
      • Data Table on Screen based display - Market size and forecast 2023-2028 ($ billion)
      • Chart on Screen based display - Year-over-year growth 2023-2028 (%)
      • Data Table on Screen based display - Year-over-year growth 2023-2028 (%)
    • 6.4 Micro display - Market size and forecast 2023-2028
      • Chart on Micro display - Market size and forecast 2023-2028 ($ billion)
      • Data Table on Micro display - Market size and forecast 2023-2028 ($ billion)
      • Chart on Micro display - Year-over-year growth 2023-2028 (%)
      • Data Table on Micro display - Year-over-year growth 2023-2028 (%)
    • 6.5 Market opportunity by Type
      • Market opportunity by Type ($ billion)
      • Data Table on Market opportunity by Type ($ billion)

    7 Market Segmentation by Application

    • 7.1 Market segments
      • Chart on Application - Market share 2023-2028 (%)
      • Data Table on Application - Market share 2023-2028 (%)
    • 7.2 Comparison by Application
      • Chart on Comparison by Application
      • Data Table on Comparison by Application
    • 7.3 Televisions - Market size and forecast 2023-2028
      • Chart on Televisions - Market size and forecast 2023-2028 ($ billion)
      • Data Table on Televisions - Market size and forecast 2023-2028 ($ billion)
      • Chart on Televisions - Year-over-year growth 2023-2028 (%)
      • Data Table on Televisions - Year-over-year growth 2023-2028 (%)
    • 7.4 Smartphones - Market size and forecast 2023-2028
      • Chart on Smartphones - Market size and forecast 2023-2028 ($ billion)
      • Data Table on Smartphones - Market size and forecast 2023-2028 ($ billion)
      • Chart on Smartphones - Year-over-year growth 2023-2028 (%)
      • Data Table on Smartphones - Year-over-year growth 2023-2028 (%)
    • 7.5 Others - Market size and forecast 2023-2028
      • Chart on Others - Market size and forecast 2023-2028 ($ billion)
      • Data Table on Others - Market size and forecast 2023-2028 ($ billion)
      • Chart on Others - Year-over-year growth 2023-2028 (%)
      • Data Table on Others - Year-over-year growth 2023-2028 (%)
    • 7.6 Market opportunity by Application
      • Market opportunity by Application ($ billion)
      • Data Table on Market opportunity by Application ($ billion)

    8 Customer Landscape

    • 8.1 Customer landscape overview
      • Analysis of price sensitivity, lifecycle, customer purchase basket, adoption rates, and purchase criteria

    9 Geographic Landscape

    • 9.1 Geographic segmentation
      • Chart on Market share by geography 2023-2028 (%)
      • Data Table on Market share by geography 2023-2028 (%)
    • 9.2 Geographic comparison
      • Chart on Geographic comparison
      • Data Table on Geographic comparison
    • 9.3 APAC - Market size and forecast 2023-2028
      • Chart on APAC - Market size and forecast 2023-2028 ($ billion)
      • Data Table on APAC - Market size and forecast 2023-2028 ($ billion)
      • Chart on APAC - Year-over-year growth 2023-2028 (%)
      • Data Table on APAC - Year-over-year growth 2023-2028 (%)
    • 9.4 North America - Market size and forecast 2023-2028
      • Chart on North America - Market size and forecast 2023-2028 ($ billion)
      • Data Table on North America - Market size and forecast 2023-2028 ($ billion)
      • Chart on North America - Year-over-year growth 2023-2028 (%)
      • Data Table on North America - Year-over-year growth 2023-2028 (%)
    • 9.5 Europe - Market size and forecast 2023-2028
      • Chart on Europe - Market size and forecast 2023-2028 ($ billion)
      • Data Table on Europe - Market size and forecast 2023-2028 ($ billion)
      • Chart on Europe - Year-over-year growth 2023-2028 (%)
      • Data Table on Europe - Year-over-year growth 2023-2028 (%)
    • 9.6 South America - Market size and forecast 2023-2028
      • Chart on South America - Market size and forecast 2023-2028 ($ billion)
      • Data Table on South America - Market size and forecast 2023-2028 ($ billion)
      • Chart on South America - Year-over-year growth 2023-2028 (%)
      • Data Table on South America - Year-over-year growth 2023-2028 (%)
    • 9.7 Middle East and Africa - Market size and forecast 2023-2028
      • Chart on Middle East and Africa - Market size and forecast 2023-2028 ($ billion)
      • Data Table on Middle East and Africa - Market size and forecast 2023-2028 ($ billion)
      • Chart on Middle East and Africa - Year-over-year growth 2023-2028 (%)
      • Data Table on Middle East and Africa - Year-over-year growth 2023-2028 (%)
    • 9.8 US - Market size and forecast 2023-2028
      • Chart on US - Market size and forecast 2023-2028 ($ billion)
      • Data Table on US - Market size and forecast 2023-2028 ($ billion)
      • Chart on US - Year-over-year growth 2023-2028 (%)
      • Data Table on US - Year-over-year growth 2023-2028 (%)
    • 9.9 China - Market size and forecast 2023-2028
      • Chart on China - Market size and forecast 2023-2028 ($ billion)
      • Data Table on China - Market size and forecast 2023-2028 ($ billion)
      • Chart on China - Year-over-year growth 2023-2028 (%)
      • Data Table on China - Year-over-year growth 2023-2028 (%)
    • 9.10 South Korea - Market size and forecast 2023-2028
      • Chart on South Korea - Market size and forecast 2023-2028 ($ billion)
      • Data Table on South Korea - Market size and forecast 2023-2028 ($ billion)
      • Chart on South Korea - Year-over-year growth 2023-2028 (%)
      • Data Table on South Korea - Year-over-year growth 2023-2028 (%)
    • 9.11 Germany - Market size and forecast 2023-2028
      • Chart on Germany - Market size and forecast 2023-2028 ($ billion)
      • Data Table on Germany - Market size and forecast 2023-2028 ($ billion)
      • Chart on Germany - Year-over-year growth 2023-2028 (%)
      • Data Table on Germany - Year-over-year growth 2023-2028 (%)
    • 9.12 UK - Market size and forecast 2023-2028
      • Chart on UK - Market size and forecast 2023-2028 ($ billion)
      • Data Table on UK - Market size and forecast 2023-2028 ($ billion)
      • Chart on UK - Year-over-year growth 2023-2028 (%)
      • Data Table on UK - Year-over-year growth 2023-2028 (%)
    • 9.13 Market opportunity by geography
      • Market opportunity by geography ($ billion)
      • Data Tables on Market opportunity by geography ($ billion)

    10 Drivers, Challenges, and Opportunity/Restraints

    • 10.1 Market drivers
      • 10.2 Market challenges
        • 10.3 Impact of drivers and challenges
          • Impact of drivers and challenges in 2023 and 2028
        • 10.4 Market opportunities/restraints

          11 Competitive Landscape

          • 11.1 Overview
            • 11.2 Competitive Landscape
              • Overview on criticality of inputs and factors of differentiation
            • 11.3 Landscape disruption
              • Overview on factors of disruption
            • 11.4 Industry risks
              • Impact of key risks on business

            12 Competitive Analysis

            • 12.1 Companies profiled
              • Companies covered
            • 12.2 Market positioning of companies
              • Matrix on companies position and classification
            • 12.3 Alphabet Inc.
              • Alphabet Inc. - Overview
              • Alphabet Inc. - Business segments
              • Alphabet Inc. - Key offerings
              • Alphabet Inc. - Segment focus
            • 12.4 AUO Corp.
              • AUO Corp. - Overview
              • AUO Corp. - Business segments
              • AUO Corp. - Key news
              • AUO Corp. - Key offerings
              • AUO Corp. - Segment focus
            • 12.5 Avalon Holographics Inc.
              • Avalon Holographics Inc. - Overview
              • Avalon Holographics Inc. - Product / Service
              • Avalon Holographics Inc. - Key offerings
            • 12.6 Continental AG
              • Continental AG - Overview
              • Continental AG - Business segments
              • Continental AG - Key news
              • Continental AG - Key offerings
              • Continental AG - Segment focus
            • 12.7 FoVI3D
              • FoVI3D - Overview
              • FoVI3D - Product / Service
              • FoVI3D - Key offerings
            • 12.8 FUJIFILM Holdings Corp.
              • FUJIFILM Holdings Corp. - Overview
              • FUJIFILM Holdings Corp. - Business segments
              • FUJIFILM Holdings Corp. - Key news
              • FUJIFILM Holdings Corp. - Key offerings
              • FUJIFILM Holdings Corp. - Segment focus
            • 12.9 LG Electronics Inc.
              • LG Electronics Inc. - Overview
              • LG Electronics Inc. - Product / Service
              • LG Electronics Inc. - Key news
              • LG Electronics Inc. - Key offerings
            • 12.10 Mitsubishi Electric Corp.
              • Mitsubishi Electric Corp. - Overview
              • Mitsubishi Electric Corp. - Business segments
              • Mitsubishi Electric Corp. - Key news
              • Mitsubishi Electric Corp. - Key offerings
              • Mitsubishi Electric Corp. - Segment focus
            • 12.11 New 3D Technologies Inc.
              • New 3D Technologies Inc. - Overview
              • New 3D Technologies Inc. - Product / Service
              • New 3D Technologies Inc. - Key offerings
            • 12.12 NVIDIA Corp.
              • NVIDIA Corp. - Overview
              • NVIDIA Corp. - Business segments
              • NVIDIA Corp. - Key news
              • NVIDIA Corp. - Key offerings
              • NVIDIA Corp. - Segment focus
            • 12.13 Panasonic Holdings Corp.
              • Panasonic Holdings Corp. - Overview
              • Panasonic Holdings Corp. - Business segments
              • Panasonic Holdings Corp. - Key news
              • Panasonic Holdings Corp. - Key offerings
              • Panasonic Holdings Corp. - Segment focus
            • 12.14 Samsung Electronics Co. Ltd.
              • Samsung Electronics Co. Ltd. - Overview
              • Samsung Electronics Co. Ltd. - Business segments
              • Samsung Electronics Co. Ltd. - Key news
              • Samsung Electronics Co. Ltd. - Key offerings
              • Samsung Electronics Co. Ltd. - Segment focus
            • 12.15 Sharp Corp.
              • Sharp Corp. - Overview
              • Sharp Corp. - Business segments
              • Sharp Corp. - Key news
              • Sharp Corp. - Key offerings
              • Sharp Corp. - Segment focus
            • 12.16 Sony Group Corp.
              • Sony Group Corp. - Overview
              • Sony Group Corp. - Business segments
              • Sony Group Corp. - Key news
              • Sony Group Corp. - Key offerings
              • Sony Group Corp. - Segment focus
            • 12.17 Toshiba Corp.
              • Toshiba Corp. - Overview
              • Toshiba Corp. - Business segments
              • Toshiba Corp. - Key news
              • Toshiba Corp. - Key offerings
              • Toshiba Corp. - Segment focus

            13 Appendix

            • 13.1 Scope of the report
              • 13.2 Inclusions and exclusions checklist
                • Inclusions checklist
                • Exclusions checklist
              • 13.3 Currency conversion rates for US$
                • Currency conversion rates for US$
              • 13.4 Research methodology
                • Research methodology
              • 13.5 Data procurement
                • Information sources
              • 13.6 Data validation
                • Data validation
              • 13.7 Validation techniques employed for market sizing
                • Validation techniques employed for market sizing
              • 13.8 Data synthesis
                • Data synthesis
              • 13.9 360 degree market analysis
                • 360 degree market analysis
              • 13.10 List of abbreviations
                • List of abbreviations

              Research Methodology

              Technavio presents a detailed picture of the market by way of study, synthesis, and summation of data from multiple sources. The analysts have presented the various facets of the market with a particular focus on identifying the key industry influencers. The data thus presented is comprehensive, reliable, and the result of extensive research, both primary and secondary.

              INFORMATION SOURCES

              Primary sources

              • Manufacturers and suppliers
              • Channel partners
              • Industry experts
              • Strategic decision makers

              Secondary sources

              • Industry journals and periodicals
              • Government data
              • Financial reports of key industry players
              • Historical data
              • Press releases

              DATA ANALYSIS

              Data Synthesis

              • Collation of data
              • Estimation of key figures
              • Analysis of derived insights

              Data Validation

              • Triangulation with data models
              • Reference against proprietary databases
              • Corroboration with industry experts

              REPORT WRITING

              Qualitative

              • Market drivers
              • Market challenges
              • Market trends
              • Five forces analysis

              Quantitative

              • Market size and forecast
              • Market segmentation
              • Geographical insights
              • Competitive landscape

              Interested in this report?

              Get your sample now to see our research methodology and insights!

              Download Now

              Frequently Asked Questions

              3D Display market growth will increase by $ 177.1 bn during 2024-2028 .

              The 3D Display market is expected to grow at a CAGR of 25.2% during 2024-2028 .

              3D Display market is segmented by Type( Screen based display, Micro display) Application( Televisions, Smartphones, Others)

              Alphabet Inc., AUO Corp., Avalon Holographics Inc., Continental AG, Dimenco BV, FoVI3D, FUJIFILM Holdings Corp., LG Electronics Inc., Mitsubishi Electric Corp., New 3D Technologies Inc., NVIDIA Corp., Ostendo Technologies Inc., Panasonic Holdings Corp., Robert Bosch GmbH, Samsung Electronics Co. Ltd., SeeReal Technologies SA, Sharp Corp., Sony Group Corp., Toshiba Corp., VividQ Ltd. are a few of the key vendors in the 3D Display market.

              APAC will register the highest growth rate of 36% among the other regions. Therefore, the 3D Display market in APAC is expected to garner significant business opportunities for the vendors during the forecast period.

              US, China, South Korea, Germany, UK

              • Emergence of 3D displays for automotive applicationsThe adoption of 3D displays in the automotive industry is driving the demand for 3D displays in the global 3D display market. 3D displays offer a more vivid and interactive user experience and are employed in a range of automobile applications such as navigation is the driving factor this market.
              • entertainment is the driving factor this market.
              • and driver assistance systems. One of the key benefits of 3D displays in the automotive industry is that they can provide a more intuitive and natural way of displaying information. For example is the driving factor this market.
              • in a navigation system is the driving factor this market.
              • a 3D display can show a 3D map of the area is the driving factor this market.
              • providing a more realistic and detailed view of the surrounding area. In a driver assistance system is the driving factor this market.
              • a 3D display can show a 3D representation of the cars surroundings is the driving factor this market.
              • providing a more accurate and detailed view of the cars environment. 3D displays can be used to enhance a cars overall design and aesthetics. For example is the driving factor this market.
              • 3D displays can be integrated into a cars dashboard or center console is the driving factor this market.
              • providing a more modern and high-tech look and feel. 3D displays can be used to create a more immersive and engaging user experience in the car is the driving factor this market.
              • such as by displaying virtual reality content or augmented reality information. Increasing the adoption of 3D displays in the automotive industry is also expected to drive innovation in the field between 2023 and 2027. Additionally is the driving factor this market.
              • companies are also developing new technologies is the driving factor this market.
              • such as transparent displays is the driving factor this market.
              • which can be integrated into the windshield of a car is the driving factor this market.
              • providing a more seamless and natural way of displaying information. The increasing adoption of autonomous vehicles is also expected to drive the growth of the global 3D display market during the forecast period. is the driving factor this market.

              The 3D Display market vendors should focus on grabbing business opportunities from the Screen based display segment as it accounted for the largest market share in the base year.