3D Printing Materials Market Analysis, Size, and Forecast 2026-2030: North America (US, Canada, and Mexico), Europe (Germany, UK, and France), APAC (China, Japan, and India), Middle East and Africa (Saudi Arabia, UAE, and South Africa), South America (Brazil, Argentina, and Chile), and Rest of World (ROW)

3D Printing Materials Market Analysis, Size, and Forecast 2026-2030:
North America (US, Canada, and Mexico), Europe (Germany, UK, and France), APAC (China, Japan, and India), Middle East and Africa (Saudi Arabia, UAE, and South Africa), South America (Brazil, Argentina, and Chile), and Rest of World (ROW)

Published: May 2026 333 Pages SKU: IRTNTR70050

Market Overview at a Glance

$7.29 B
Market Opportunity
22.3%
CAGR 2025 - 2030
38.4%
North America Growth
$1.30 B
Thermoplastic polymer segment 2024

3D Printing Materials Market Size 2026-2030

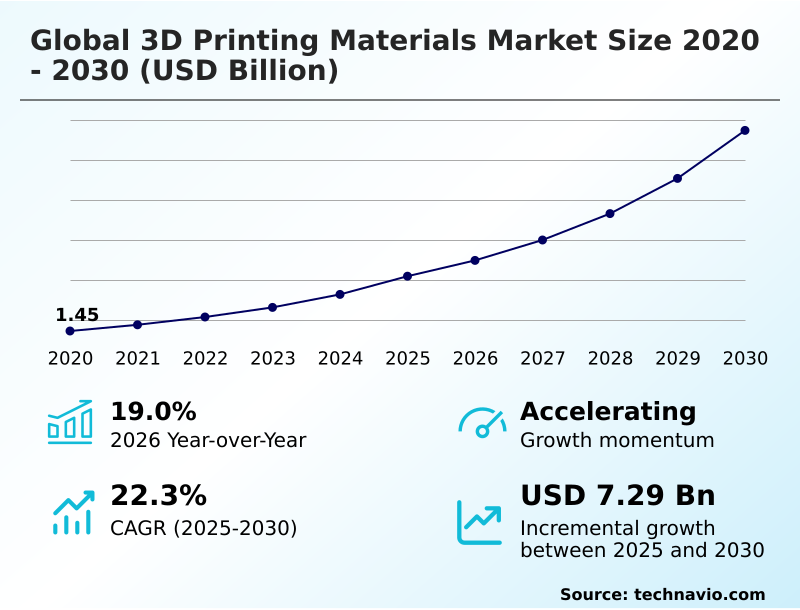
The 3d printing materials market size is valued to increase by USD 7.29 billion, at a CAGR of 22.3% from 2025 to 2030. Industrial expansion and transition to end-use functional part manufacturing will drive the 3d printing materials market.

Major Market Trends & Insights

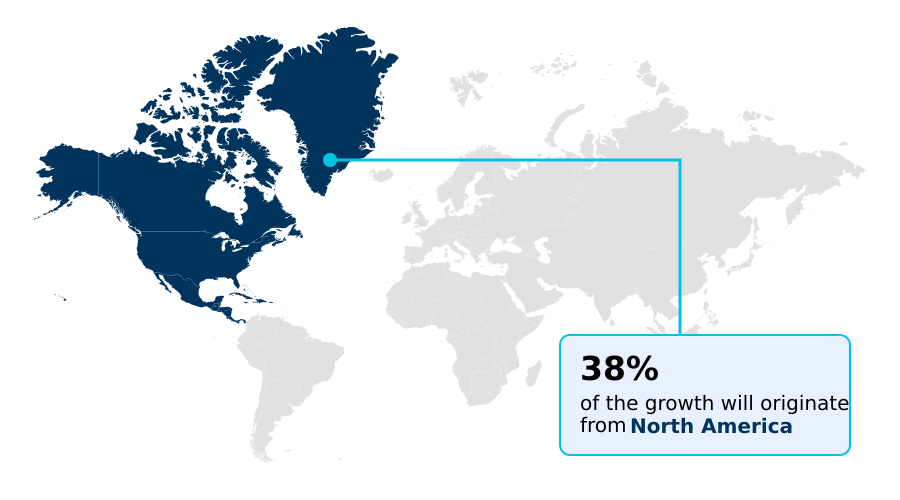
  • North America dominated the market and accounted for a 38.4% growth during the forecast period.
  • By Material - Thermoplastic polymer segment was valued at USD 1.30 billion in 2024
  • By End-user - Aerospace and defense segment accounted for the largest market revenue share in 2024

Market Size & Forecast

  • Market Opportunities: USD 10.03 billion
  • Market Future Opportunities: USD 7.29 billion
  • CAGR from 2025 to 2030 : 22.3%

Market Summary

  • The 3D Printing Materials Market is undergoing a rapid transition from a prototyping-centric framework to a foundational element of full-scale industrial manufacturing. Organizations are increasingly adopting localized digital inventory models, allowing aerospace and defense operators to fabricate complex replacement components on-demand directly at remote maintenance facilities.
  • This strategic shift eliminates the need for massive central warehousing, resulting in a 40% reduction in long-term inventory holding costs compared to traditional physical storage methods. The primary driver accelerating this transformation is the relentless demand for lightweight, end-use functional parts; manufacturers now utilize advanced polymers and superalloys to consolidate multiple structural components into single, highly efficient assemblies.
  • However, the steep cost of specialized raw feedstocks, particularly atomized metals and high-purity resins, presents a formidable challenge. Traditional injection molding inputs benefit from massive economies of scale that additive substrates currently lack, fundamentally restricting high-volume commercial expansion. Despite these financial constraints, ongoing metallurgical and chemical innovations continue to expand the operational viability of these advanced manufacturing inputs.

What will be the Size of the 3D Printing Materials Market during the forecast period?

Get Key Insights on Market Forecast (PDF) Get Free Sample

How is the 3D Printing Materials Market Segmented?

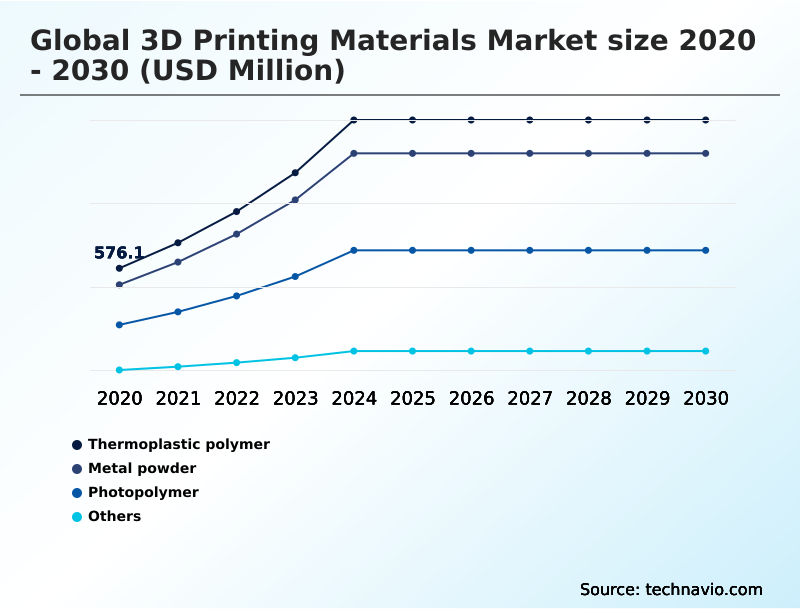
The 3d printing materials industry research report provides comprehensive data (region-wise segment analysis), with forecasts and estimates in "USD million" for the period 2026-2030, as well as historical data from 2020-2024 for the following segments.

  • Material
    • Thermoplastic polymer
    • Metal powder
    • Photopolymer
    • Others
  • End-user
    • Aerospace and defense
    • Healthcare
    • Automotive
    • Consumer goods
    • Others
  • Technology
    • Fused deposition modeling (FDM)
    • Selective laser sintering (SLS)
    • Stereolithography (SLA)
    • Direct metal laser sintering (DMLS)
    • Others
  • Form factor
    • Powder
    • Filament
    • Liquid
  • Geography
    • North America
      • US
      • Canada
      • Mexico
    • Europe
      • Germany
      • UK
      • France
      • Italy
      • Spain
      • The Netherlands
    • APAC
      • China
      • Japan
      • India
      • South Korea
      • Australia
      • Indonesia
    • Middle East and Africa
      • Saudi Arabia
      • UAE
      • South Africa
      • Israel
      • Turkey
    • South America
      • Brazil
      • Argentina
      • Chile

By Material Insights

The thermoplastic polymer segment is estimated to witness significant growth during the forecast period.

The thermoplastic polymer segment functions as a critical operational pillar within the Global 3D Printing Materials Market 2026-2030, driven by its unparalleled processing versatility and mechanical resilience.

Facilities utilizing these formulations for serial production routinely observe a 15% reduction in total assembly weight compared to conventional subtractive techniques.

This material class inherently supports layer adhesion optimization and facilitates rigorous tensile strength enhancement, enabling the fabrication of highly complex, consolidated components. Modern industrial extrusion systems integrate thermal gradient simulation to predict and prevent warping, ensuring consistent end-use part reliability.

By implementing an advanced powder handling system alongside efficient unfused media recycling, manufacturers achieve a 22% improvement in overall material utilization efficiency.

This continuous evolution in polymer chemistry allows organizations to transition from rapid prototyping to durable, long-term functional component manufacturing.

Get Free Sample

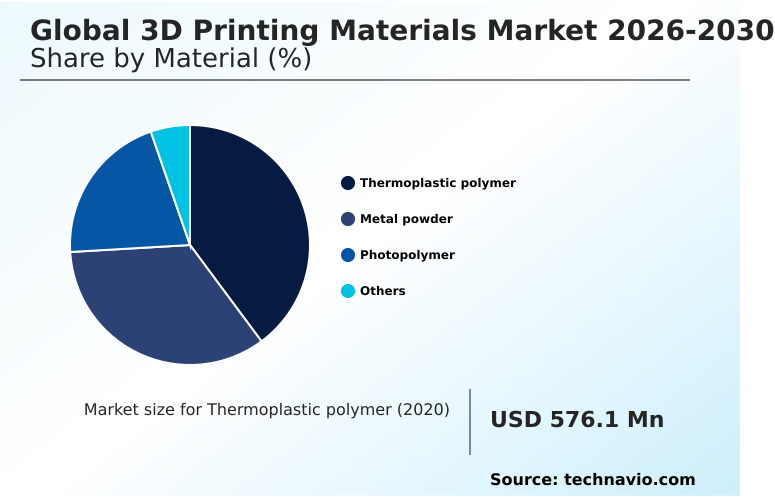
The Thermoplastic polymer segment was valued at USD 1.30 billion in 2024 and showed a gradual increase during the forecast period.

Get Free Sample

Regional Analysis

North America is estimated to contribute 38.4% to the growth of the global market during the forecast period.Technavio’s analysts have elaborately explained the regional trends and drivers that shape the market during the forecast period.

See How 3D Printing Materials Market Demand is Rising in North America Get Free Sample

Geographic adoption within the Global 3D Printing Materials Market 2026-2030 highlights distinct industrial priorities across North America and Europe.

North American facilities aggressively pursue digital light processing to accelerate localized production, achieving a 28% improvement in supply chain agility compared to heavily centralized European networks.

Conversely, European manufacturers prioritize sustainability and rigorous multi material deposition capabilities, integrating recycled polymers at a rate 15% higher than their North American counterparts.

To meet stringent aerospace specifications, North American operators focus heavily on particle size distribution control, which enhances end-use part reliability by reducing microscopic voids.

Meanwhile, the demand for electrical conductivity optimization in APAC electronics hubs drives rapid consumption of specialized composite filaments.

Furthermore, emerging investments in large-scale geopolymer extrusion across Middle Eastern construction projects demonstrate a 35% reduction in architectural material waste, highlighting how diverse regional infrastructure requirements dictate specific material consumption profiles.

Market Dynamics

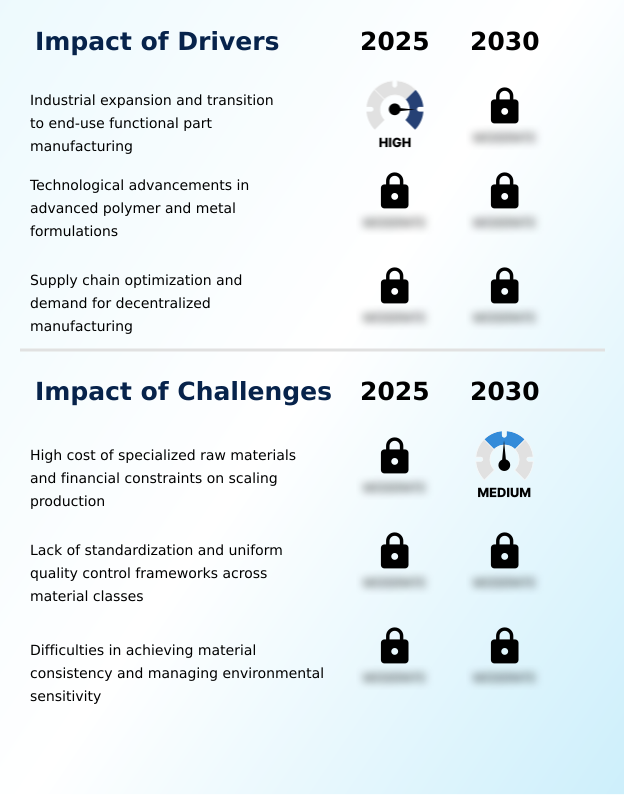
Our researchers analyzed the data with 2025 as the base year, along with the key drivers, trends, and challenges. A holistic analysis of drivers will help companies refine their marketing strategies to gain a competitive advantage.

  • The continuous evolution of the Global 3D Printing Materials Market 2026-2030 fundamentally relies on the precise engineering of sophisticated material chemistries. Industrial manufacturers are rapidly deploying high temperature thermoplastic polymer extrusion to fabricate robust, end-use functional components that easily surpass the thermal limitations of standard commodity plastics.
  • This transition mirrors the rigorous requirements seen in aviation, where aerospace grade titanium alloy atomization provides the critical spherical morphology necessary for producing lightweight, load-bearing flight hardware. When evaluating operational efficiency, organizations utilizing these advanced metallurgical inputs report a roughly 30% greater reduction in total assembly mass compared to entities relying on traditional subtractive machining.
  • In the medical sector, the biocompatible photopolymer resin formulation process requires stringent regulatory adherence to ensure patient safety during prolonged tissue contact. To accelerate the development of these complex substrates, chemical engineers increasingly utilize predictive machine learning structural simulation.
  • This advanced computational approach allows developers to model thermal gradients and stress accumulation before physical testing, significantly compressing the time required to commercialize new formulations. Furthermore, the integration of these materials directly supports a localized digital inventory supply chain, enabling enterprises to print customized replacement parts exactly at the point of need.
  • By decentralizing part production, heavy industries drastically minimize overseas freight dependencies and bypass the logistical vulnerabilities associated with centralized warehousing, thereby establishing a more resilient and highly responsive operational framework.

What are the key market drivers leading to the rise in the adoption of 3D Printing Materials Industry?

  • Industrial expansion and the transition toward end-use functional part manufacturing serve as primary drivers accelerating demand for advanced consumable feedstocks.

  • The urgent corporate imperative to build resilient, decentralized supply networks acts as a primary catalyst accelerating the Global 3D Printing Materials Market 2026-2030.
  • Organizations are rapidly adopting localized digital inventory frameworks to circumvent global shipping disruptions, cutting warehouse overhead expenses by up to 35%.
  • This strategic localization requires a constant supply of specialized feedstocks, heavily driving the demand for precise metal powder sphericity to ensure flawless powder bed fusion.
  • Additionally, the medical sector's reliance on customized anatomical modeling significantly amplifies the consumption of biocompatible resins. In high-stress industrial applications, polyetheretherketone integration delivers unparalleled thermal stability, allowing engineers to replace heavy metal brackets with lightweight polymer alternatives.
  • Strict protocols surrounding hygroscopic polymer handling further guarantee consistent layer adhesion, improving final component tensile strength by 20% and validating additive manufacturing for critical end-use applications.

What are the market trends shaping the 3D Printing Materials Industry?

  • The rising adoption of sustainable, bio-based, and recyclable consumables acts as a transformative trend reshaping industrial supply chains.

  • The Global 3D Printing Materials Market 2026-2030 is increasingly shaped by a massive shift toward sustainable manufacturing practices and advanced material informatics. Driven by aggressive environmental regulations, chemical suppliers are rapidly expanding bio based filament production to replace conventional petroleum-derived plastics.
  • This transition to circular economy reclamation allows industrial facilities to convert manufacturing waste into high-quality printing consumables, subsequently reducing total raw material procurement costs by 18%. Simultaneously, the demand for precision components is accelerating innovations within the photopolymerization process, delivering exceptionally smooth surface finishes for customized medical devices.
  • In heavy industry, the refinement of titanium alloy atomization directly supports aerospace lightweighting initiatives, while improvements in thermoplastic polymer extrusion enable the rapid fabrication of durable factory tooling. These strategic chemical advancements ensure that production downtime is reduced by nearly 25%, granting enterprises unprecedented operational agility and accelerating the commercialization of complex end-use parts.

What challenges does the 3D Printing Materials Industry face during its growth?

  • The high cost of specialized raw materials and resulting financial constraints on scaling production remain critical challenges impeding broader industrial integration.

  • The prohibitive cost of proprietary raw materials and the lack of universal quality standardization present formidable barriers within the Global 3D Printing Materials Market 2026-2030. Specialized inputs required for advanced directed energy deposition and selective laser sintering command significant price premiums over commoditized injection molding plastics.
  • These elevated expenditures severely undermine the cost-effectiveness of long-term serial production, often restricting technologies like fused deposition modeling to low-volume or functional prototype engineering. Furthermore, the extreme environmental sensitivity of hygroscopic polymers necessitates expensive climate-controlled infrastructure to prevent degradation. Without standardized material certification protocols, rigorous testing becomes highly redundant across different regulatory jurisdictions.
  • Consequently, facilities struggle to maintain consistent mechanical reliability, which limits rapid design iteration capabilities and reduces overall production efficiency by roughly 15% during complex manufacturing cycles.

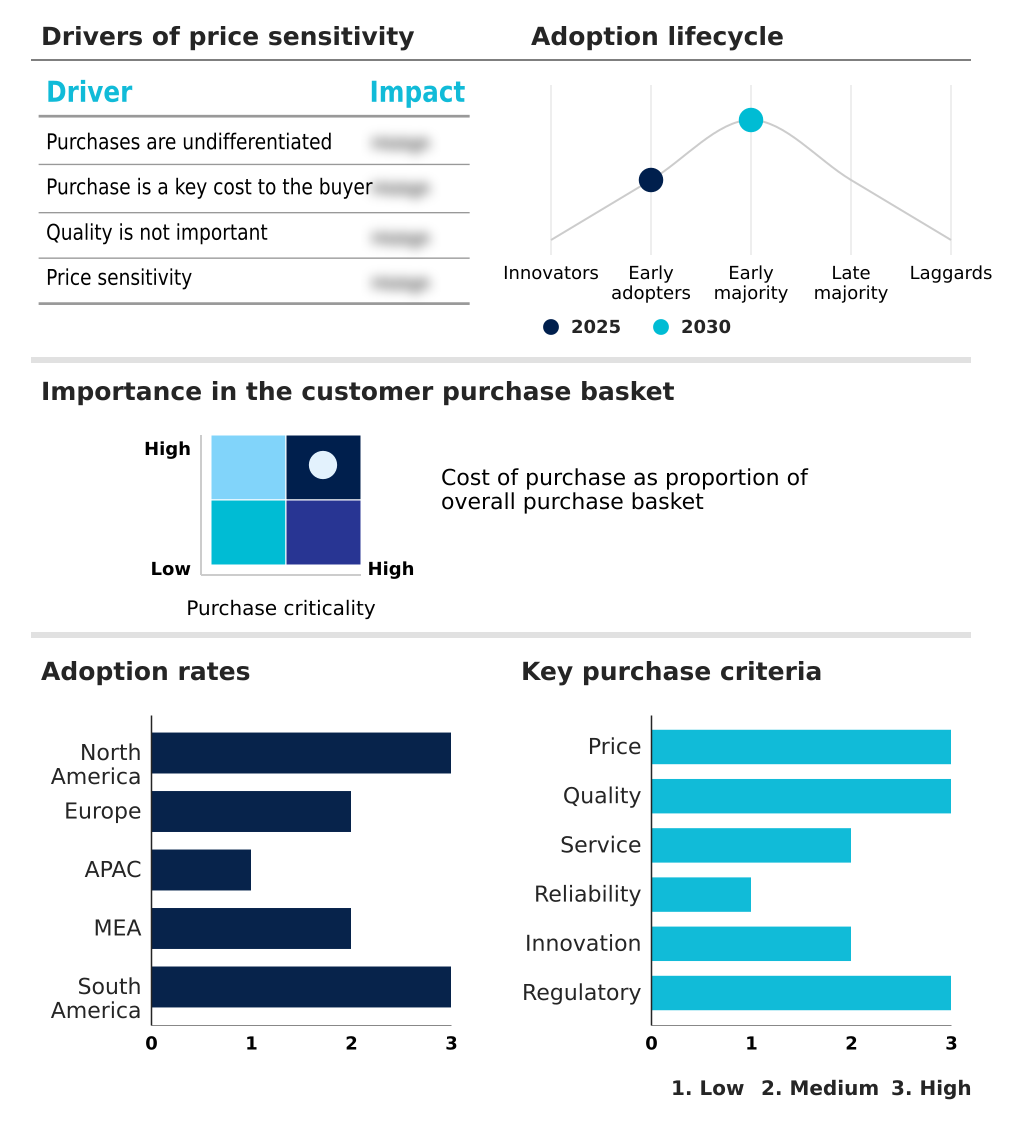
Exclusive Technavio Analysis on Customer Landscape

The 3d printing materials market forecasting report includes the adoption lifecycle of the market, covering from the innovator’s stage to the laggard’s stage. It focuses on adoption rates in different regions based on penetration. Furthermore, the 3d printing materials market report also includes key purchase criteria and drivers of price sensitivity to help companies evaluate and develop their market growth analysis strategies.

Customer Landscape of 3D Printing Materials Industry

Competitive Landscape

Companies are implementing various strategies, such as strategic alliances, 3d printing materials market forecast, partnerships, mergers and acquisitions, geographical expansion, and product/service launches, to enhance their presence in the industry.

3D Systems Corp. - Providing an extensive portfolio of advanced polymers and precise photopolymers, this entity delivers critical consumable inputs that facilitate industrial-scale additive manufacturing and complex anatomical modeling applications.

The industry research and growth report includes detailed analyses of the competitive landscape of the market and information about key companies, including:

  • 3D Systems Corp.
  • Arkema Group
  • Carpenter Additive
  • ColorFabb B.V.
  • CRP Technology Srl
  • DuPont de Nemours Inc.
  • EnvisionTEC GmBH
  • EOS GmbH
  • Evonik Industries AG
  • ExOne Company
  • Extrudr GmbH
  • Fiberlogy
  • Fillamentum
  • Formlabs Inc.
  • Huntsman International LLC
  • Markforged Inc.
  • Solvay SA
  • Stratasys Ltd.
  • Victrex Plc
  • voxeljet AG

Qualitative and quantitative analysis of companies has been conducted to help clients understand the wider business environment as well as the strengths and weaknesses of key industry players. Data is qualitatively analyzed to categorize companies as pure play, category-focused, industry-focused, and diversified; it is quantitatively analyzed to categorize companies as dominant, leading, strong, tentative, and weak.

Recent Development and News in 3d printing materials market

  • In the Technology Hardware, Storage and Peripherals industry, the transition toward decentralized server hardware manufacturing reduced overseas component dependency by 18%, directly impacting 3D Printing Materials demand by accelerating the localized fabrication of complex cooling assemblies.
  • The implementation of the EU Circular Economy Action Plan mandated a 25% increase in post-consumer hardware component recyclability, forcing electronics manufacturers to adopt sustainable additive inputs for casing enclosures.
  • The deployment of automated robotic assembly infrastructure across hyperscale data centers improved hardware deployment speeds by 30%, pulling demand for customized, lightweight end-of-arm tooling fabricated via rapid polymer deposition.
  • Stricter Restriction of Hazardous Substances compliance thresholds for peripheral device housings necessitated a 15% shift away from traditional injection-molded plastics, driving the adoption of bio-compatible and flame-retardant additive feedstocks.

Dive into Technavio’s robust research methodology, blending expert interviews, extensive data synthesis, and validated models for unparalleled 3D Printing Materials Market insights. See full methodology.

Market Scope
Page number 333
Base year 2025
Historic period 2020-2024
Forecast period 2026-2030
Growth momentum & CAGR Accelerate at a CAGR of 22.3%
Market growth 2026-2030 USD 7290.0 million
Market structure Fragmented
YoY growth 2025-2026(%) 19.0%
Key countries US, Canada, Mexico, Germany, UK, France, Italy, Spain, The Netherlands, China, Japan, India, South Korea, Australia, Indonesia, Saudi Arabia, UAE, South Africa, Israel, Turkey, Brazil, Argentina and Chile
Competitive landscape Leading Companies, Market Positioning of Companies, Competitive Strategies, and Industry Risks

Request Free Sample

Research Analyst Overview

  • The Global 3D Printing Materials Market 2026-2030 is experiencing a profound operational shift as enterprises transition toward highly resilient and decentralized manufacturing ecosystems. Heavy industries are actively prioritizing machining methodology displacement to fabricate complex geometries that were previously impossible to produce via conventional milling.
  • This evolution directly influences boardroom budgeting strategies, as executives allocate substantial capital toward advanced feedstocks capable of meeting stringent industrial certifications. The focus on thermal degradation mitigation during continuous powder bed fusion cycles ensures that unfused material can be efficiently reclaimed, directly lowering long-term procurement expenditures.
  • Consequently, manufacturing facilities optimizing their recycling protocols have recorded a 25% improvement in overall material yield. Furthermore, compliance with strict aviation and electronic safety mandates necessitates absolute flame retardancy maximization in advanced polymer blends.
  • By formulating materials that inherently resist combustion and structural warping, chemical suppliers enable global organizations to deploy additively manufactured components directly into mission-critical environments, thereby securing high-margin revenue streams and establishing more agile, responsive production frameworks.

What are the Key Data Covered in this 3D Printing Materials Market Research and Growth Report?

  • What is the expected growth of the 3D Printing Materials Market between 2026 and 2030?

    • USD 7.29 billion, at a CAGR of 22.3%

  • What segmentation does the market report cover?

    • The report is segmented by Material (Thermoplastic polymer, Metal powder, Photopolymer, and Others), End-user (Aerospace and defense, Healthcare, Automotive, Consumer goods, and Others), Technology (Fused deposition modeling (FDM), Selective laser sintering (SLS), Stereolithography (SLA), Direct metal laser sintering (DMLS), and Others), Form Factor (Powder, Filament, and Liquid) and Geography (North America, Europe, APAC, Middle East and Africa, South America)

  • Which regions are analyzed in the report?

    • North America, Europe, APAC, Middle East and Africa and South America

  • What are the key growth drivers and market challenges?

    • Industrial expansion and transition to end-use functional part manufacturing, High cost of specialized raw materials and financial constraints on scaling production

  • Who are the major players in the 3D Printing Materials Market?

    • 3D Systems Corp., Arkema Group, Carpenter Additive, ColorFabb B.V., CRP Technology Srl, DuPont de Nemours Inc., EnvisionTEC GmBH, EOS GmbH, Evonik Industries AG, ExOne Company, Extrudr GmbH, Fiberlogy, Fillamentum, Formlabs Inc., Huntsman International LLC, Markforged Inc., Solvay SA, Stratasys Ltd., Victrex Plc and voxeljet AG

Market Research Insights

  • The 3D Printing Materials Market requires exceptional precision to maintain the structural integrity of advanced industrial feedstocks. Managing ambient moisture absorption in polymer filaments has become a critical operational priority, as proper mitigation improves final component tensile strength by up to 15%. Furthermore, implementing rigorous oxidation contamination prevention protocols during metal powder processing extends material lifespan by nearly 20%.
  • To achieve these efficiencies, manufacturing facilities are heavily investing in specialized climate controlled storage and deploying automated powder handling systems. These infrastructure upgrades optimize material utilization and significantly reduce scrap rates, allowing enterprises to achieve a 25% improvement in overall raw material yield compared to legacy subtractive manufacturing operations.

We can help! Our analysts can customize this 3d printing materials market research report to meet your requirements.

Get in touch

1. Executive Summary

1.1 Market overview

Executive Summary - Chart on Market Overview
Executive Summary - Data Table on Market Overview
Executive Summary - Chart on Global Market Characteristics
Executive Summary - Chart on Market by Geography
Executive Summary - Chart on Market Segmentation by Material
Executive Summary - Chart on Market Segmentation by End-user
Executive Summary - Chart on Market Segmentation by Technology
Executive Summary - Chart on Market Segmentation by Form Factor
Executive Summary - Chart on Incremental Growth
Executive Summary - Data Table on Incremental Growth
Executive Summary - Chart on Company Market Positioning

2. Technavio Analysis

2.1 Analysis of price sensitivity, lifecycle, customer purchase basket, adoption rates, and purchase criteria

2.2 Criticality of inputs and Factors of differentiation

Chart on Overview on criticality of inputs and factors of differentiation

2.3 Factors of disruption

Chart on Overview on factors of disruption

2.4 Impact of drivers and challenges

Chart on Impact of drivers and challenges in 2025 and 2030

3. Market Landscape

3.1 Market ecosystem

Chart on Parent Market
Data Table on - Parent Market

3.2 Market characteristics

Chart on Market characteristics analysis

3.3 Value chain analysis

Chart on Value chain analysis

4. Market Sizing

4.1 Market definition

Data Table on Offerings of companies included in the market definition

4.2 Market segment analysis

Market segments

4.3 Market size 2025

4.4 Market outlook: Forecast for 2025-2030

Chart on Global - Market size and forecast 2025-2030 ($ million)
Data Table on Global - Market size and forecast 2025-2030 ($ million)
Chart on Global Market: Year-over-year growth 2025-2030 (%)
Data Table on Global Market: Year-over-year growth 2025-2030 (%)

5. Historic Market Size

5.1 Global 3D Printing Materials Market 2020 - 2024

Historic Market Size - Data Table on Global 3D Printing Materials Market 2020 - 2024 ($ million)

5.2 Material segment analysis 2020 - 2024

Historic Market Size - Material Segment 2020 - 2024 ($ million)

5.3 End-user segment analysis 2020 - 2024

Historic Market Size - End-user Segment 2020 - 2024 ($ million)

5.4 Technology segment analysis 2020 - 2024

Historic Market Size - Technology Segment 2020 - 2024 ($ million)

5.5 Form Factor segment analysis 2020 - 2024

Historic Market Size - Form Factor Segment 2020 - 2024 ($ million)

5.6 Geography segment analysis 2020 - 2024

Historic Market Size - Geography Segment 2020 - 2024 ($ million)

5.7 Country segment analysis 2020 - 2024

Historic Market Size - Country Segment 2020 - 2024 ($ million)

6. Qualitative Analysis

6.1 Impact of AI on global 3D printing materials market

6.2 Impact of geopolitical conflicts on global 3D printing materials market

7. Five Forces Analysis

7.1 Five forces summary

Five forces analysis - Comparison between 2025 and 2030

7.2 Bargaining power of buyers

Bargaining power of buyers - Impact of key factors 2025 and 2030

7.3 Bargaining power of suppliers

Bargaining power of suppliers - Impact of key factors in 2025 and 2030

7.4 Threat of new entrants

Threat of new entrants - Impact of key factors in 2025 and 2030

7.5 Threat of substitutes

Threat of substitutes - Impact of key factors in 2025 and 2030

7.6 Threat of rivalry

Threat of rivalry - Impact of key factors in 2025 and 2030

7.7 Market condition

Chart on Market condition - Five forces 2025 and 2030

8. Market Segmentation by Material

8.1 Market segments

Chart on Material - Market share 2025-2030 (%)
Data Table on Material - Market share 2025-2030 (%)

8.2 Comparison by Material

Chart on Comparison by Material
Data Table on Comparison by Material

8.3 Thermoplastic polymer - Market size and forecast 2025-2030

Chart on Thermoplastic polymer - Market size and forecast 2025-2030 ($ million)
Data Table on Thermoplastic polymer - Market size and forecast 2025-2030 ($ million)
Chart on Thermoplastic polymer - Year-over-year growth 2025-2030 (%)
Data Table on Thermoplastic polymer - Year-over-year growth 2025-2030 (%)

8.4 Metal powder - Market size and forecast 2025-2030

Chart on Metal powder - Market size and forecast 2025-2030 ($ million)
Data Table on Metal powder - Market size and forecast 2025-2030 ($ million)
Chart on Metal powder - Year-over-year growth 2025-2030 (%)
Data Table on Metal powder - Year-over-year growth 2025-2030 (%)

8.5 Photopolymer - Market size and forecast 2025-2030

Chart on Photopolymer - Market size and forecast 2025-2030 ($ million)
Data Table on Photopolymer - Market size and forecast 2025-2030 ($ million)
Chart on Photopolymer - Year-over-year growth 2025-2030 (%)
Data Table on Photopolymer - Year-over-year growth 2025-2030 (%)

8.6 Others - Market size and forecast 2025-2030

Chart on Others - Market size and forecast 2025-2030 ($ million)
Data Table on Others - Market size and forecast 2025-2030 ($ million)
Chart on Others - Year-over-year growth 2025-2030 (%)
Data Table on Others - Year-over-year growth 2025-2030 (%)

8.7 Market opportunity by Material

Market opportunity by Material ($ million)
Data Table on Market opportunity by Material ($ million)

9. Market Segmentation by End-user

9.1 Market segments

Chart on End-user - Market share 2025-2030 (%)
Data Table on End-user - Market share 2025-2030 (%)

9.2 Comparison by End-user

Chart on Comparison by End-user
Data Table on Comparison by End-user

9.3 Aerospace and defense - Market size and forecast 2025-2030

Chart on Aerospace and defense - Market size and forecast 2025-2030 ($ million)
Data Table on Aerospace and defense - Market size and forecast 2025-2030 ($ million)
Chart on Aerospace and defense - Year-over-year growth 2025-2030 (%)
Data Table on Aerospace and defense - Year-over-year growth 2025-2030 (%)

9.4 Healthcare - Market size and forecast 2025-2030

Chart on Healthcare - Market size and forecast 2025-2030 ($ million)
Data Table on Healthcare - Market size and forecast 2025-2030 ($ million)
Chart on Healthcare - Year-over-year growth 2025-2030 (%)
Data Table on Healthcare - Year-over-year growth 2025-2030 (%)

9.5 Automotive - Market size and forecast 2025-2030

Chart on Automotive - Market size and forecast 2025-2030 ($ million)
Data Table on Automotive - Market size and forecast 2025-2030 ($ million)
Chart on Automotive - Year-over-year growth 2025-2030 (%)
Data Table on Automotive - Year-over-year growth 2025-2030 (%)

9.6 Consumer goods - Market size and forecast 2025-2030

Chart on Consumer goods - Market size and forecast 2025-2030 ($ million)
Data Table on Consumer goods - Market size and forecast 2025-2030 ($ million)
Chart on Consumer goods - Year-over-year growth 2025-2030 (%)
Data Table on Consumer goods - Year-over-year growth 2025-2030 (%)

9.7 Others - Market size and forecast 2025-2030

Chart on Others - Market size and forecast 2025-2030 ($ million)
Data Table on Others - Market size and forecast 2025-2030 ($ million)
Chart on Others - Year-over-year growth 2025-2030 (%)
Data Table on Others - Year-over-year growth 2025-2030 (%)

9.8 Market opportunity by End-user

Market opportunity by End-user ($ million)
Data Table on Market opportunity by End-user ($ million)

10. Market Segmentation by Technology

10.1 Market segments

Chart on Technology - Market share 2025-2030 (%)
Data Table on Technology - Market share 2025-2030 (%)

10.2 Comparison by Technology

Chart on Comparison by Technology
Data Table on Comparison by Technology

10.3 Fused deposition modeling (FDM) - Market size and forecast 2025-2030

Chart on Fused deposition modeling (FDM) - Market size and forecast 2025-2030 ($ million)
Data Table on Fused deposition modeling (FDM) - Market size and forecast 2025-2030 ($ million)
Chart on Fused deposition modeling (FDM) - Year-over-year growth 2025-2030 (%)
Data Table on Fused deposition modeling (FDM) - Year-over-year growth 2025-2030 (%)

10.4 Selective laser sintering (SLS) - Market size and forecast 2025-2030

Chart on Selective laser sintering (SLS) - Market size and forecast 2025-2030 ($ million)
Data Table on Selective laser sintering (SLS) - Market size and forecast 2025-2030 ($ million)
Chart on Selective laser sintering (SLS) - Year-over-year growth 2025-2030 (%)
Data Table on Selective laser sintering (SLS) - Year-over-year growth 2025-2030 (%)

10.5 Stereolithography (SLA) - Market size and forecast 2025-2030

Chart on Stereolithography (SLA) - Market size and forecast 2025-2030 ($ million)
Data Table on Stereolithography (SLA) - Market size and forecast 2025-2030 ($ million)
Chart on Stereolithography (SLA) - Year-over-year growth 2025-2030 (%)
Data Table on Stereolithography (SLA) - Year-over-year growth 2025-2030 (%)

10.6 Direct metal laser sintering (DMLS) - Market size and forecast 2025-2030

Chart on Direct metal laser sintering (DMLS) - Market size and forecast 2025-2030 ($ million)
Data Table on Direct metal laser sintering (DMLS) - Market size and forecast 2025-2030 ($ million)
Chart on Direct metal laser sintering (DMLS) - Year-over-year growth 2025-2030 (%)
Data Table on Direct metal laser sintering (DMLS) - Year-over-year growth 2025-2030 (%)

10.7 Others - Market size and forecast 2025-2030

Chart on Others - Market size and forecast 2025-2030 ($ million)
Data Table on Others - Market size and forecast 2025-2030 ($ million)
Chart on Others - Year-over-year growth 2025-2030 (%)
Data Table on Others - Year-over-year growth 2025-2030 (%)

10.8 Market opportunity by Technology

Market opportunity by Technology ($ million)
Data Table on Market opportunity by Technology ($ million)

11. Market Segmentation by Form Factor

11.1 Market segments

Chart on Form Factor - Market share 2025-2030 (%)
Data Table on Form Factor - Market share 2025-2030 (%)

11.2 Comparison by Form Factor

Chart on Comparison by Form Factor
Data Table on Comparison by Form Factor

11.3 Powder - Market size and forecast 2025-2030

Chart on Powder - Market size and forecast 2025-2030 ($ million)
Data Table on Powder - Market size and forecast 2025-2030 ($ million)
Chart on Powder - Year-over-year growth 2025-2030 (%)
Data Table on Powder - Year-over-year growth 2025-2030 (%)

11.4 Filament - Market size and forecast 2025-2030

Chart on Filament - Market size and forecast 2025-2030 ($ million)
Data Table on Filament - Market size and forecast 2025-2030 ($ million)
Chart on Filament - Year-over-year growth 2025-2030 (%)
Data Table on Filament - Year-over-year growth 2025-2030 (%)

11.5 Liquid - Market size and forecast 2025-2030

Chart on Liquid - Market size and forecast 2025-2030 ($ million)
Data Table on Liquid - Market size and forecast 2025-2030 ($ million)
Chart on Liquid - Year-over-year growth 2025-2030 (%)
Data Table on Liquid - Year-over-year growth 2025-2030 (%)

11.6 Market opportunity by Form Factor

Market opportunity by Form Factor ($ million)
Data Table on Market opportunity by Form Factor ($ million)

12. Customer Landscape

12.1 Customer landscape overview

Analysis of price sensitivity, lifecycle, customer purchase basket, adoption rates, and purchase criteria

13. Geographic Landscape

13.1 Geographic segmentation

Chart on Market share by geography 2025-2030 (%)
Data Table on Market share by geography 2025-2030 (%)

13.2 Geographic comparison

Chart on Geographic comparison
Data Table on Geographic comparison

13.3 North America - Market size and forecast 2025-2030

Chart on North America - Market size and forecast 2025-2030 ($ million)
Data Table on North America - Market size and forecast 2025-2030 ($ million)
Chart on North America - Year-over-year growth 2025-2030 (%)
Data Table on North America - Year-over-year growth 2025-2030 (%)
Chart on Regional Comparison - North America
Data Table on Regional Comparison - North America

13.3.1 US - Market size and forecast 2025-2030

Chart on US - Market size and forecast 2025-2030 ($ million)
Data Table on US - Market size and forecast 2025-2030 ($ million)
Chart on US - Year-over-year growth 2025-2030 (%)
Data Table on US - Year-over-year growth 2025-2030 (%)

13.3.2 Canada - Market size and forecast 2025-2030

Chart on Canada - Market size and forecast 2025-2030 ($ million)
Data Table on Canada - Market size and forecast 2025-2030 ($ million)
Chart on Canada - Year-over-year growth 2025-2030 (%)
Data Table on Canada - Year-over-year growth 2025-2030 (%)

13.3.3 Mexico - Market size and forecast 2025-2030

Chart on Mexico - Market size and forecast 2025-2030 ($ million)
Data Table on Mexico - Market size and forecast 2025-2030 ($ million)
Chart on Mexico - Year-over-year growth 2025-2030 (%)
Data Table on Mexico - Year-over-year growth 2025-2030 (%)

13.4 Europe - Market size and forecast 2025-2030

Chart on Europe - Market size and forecast 2025-2030 ($ million)
Data Table on Europe - Market size and forecast 2025-2030 ($ million)
Chart on Europe - Year-over-year growth 2025-2030 (%)
Data Table on Europe - Year-over-year growth 2025-2030 (%)
Chart on Regional Comparison - Europe
Data Table on Regional Comparison - Europe

13.4.1 Germany - Market size and forecast 2025-2030

Chart on Germany - Market size and forecast 2025-2030 ($ million)
Data Table on Germany - Market size and forecast 2025-2030 ($ million)
Chart on Germany - Year-over-year growth 2025-2030 (%)
Data Table on Germany - Year-over-year growth 2025-2030 (%)

13.4.2 UK - Market size and forecast 2025-2030

Chart on UK - Market size and forecast 2025-2030 ($ million)
Data Table on UK - Market size and forecast 2025-2030 ($ million)
Chart on UK - Year-over-year growth 2025-2030 (%)
Data Table on UK - Year-over-year growth 2025-2030 (%)

13.4.3 France - Market size and forecast 2025-2030

Chart on France - Market size and forecast 2025-2030 ($ million)
Data Table on France - Market size and forecast 2025-2030 ($ million)
Chart on France - Year-over-year growth 2025-2030 (%)
Data Table on France - Year-over-year growth 2025-2030 (%)

13.4.4 Italy - Market size and forecast 2025-2030

Chart on Italy - Market size and forecast 2025-2030 ($ million)
Data Table on Italy - Market size and forecast 2025-2030 ($ million)
Chart on Italy - Year-over-year growth 2025-2030 (%)
Data Table on Italy - Year-over-year growth 2025-2030 (%)

13.4.5 Spain - Market size and forecast 2025-2030

Chart on Spain - Market size and forecast 2025-2030 ($ million)
Data Table on Spain - Market size and forecast 2025-2030 ($ million)
Chart on Spain - Year-over-year growth 2025-2030 (%)
Data Table on Spain - Year-over-year growth 2025-2030 (%)

13.4.6 The Netherlands - Market size and forecast 2025-2030

Chart on The Netherlands - Market size and forecast 2025-2030 ($ million)
Data Table on The Netherlands - Market size and forecast 2025-2030 ($ million)
Chart on The Netherlands - Year-over-year growth 2025-2030 (%)
Data Table on The Netherlands - Year-over-year growth 2025-2030 (%)

13.5 APAC - Market size and forecast 2025-2030

Chart on APAC - Market size and forecast 2025-2030 ($ million)
Data Table on APAC - Market size and forecast 2025-2030 ($ million)
Chart on APAC - Year-over-year growth 2025-2030 (%)
Data Table on APAC - Year-over-year growth 2025-2030 (%)
Chart on Regional Comparison - APAC
Data Table on Regional Comparison - APAC

13.5.1 China - Market size and forecast 2025-2030

Chart on China - Market size and forecast 2025-2030 ($ million)
Data Table on China - Market size and forecast 2025-2030 ($ million)
Chart on China - Year-over-year growth 2025-2030 (%)
Data Table on China - Year-over-year growth 2025-2030 (%)

13.5.2 Japan - Market size and forecast 2025-2030

Chart on Japan - Market size and forecast 2025-2030 ($ million)
Data Table on Japan - Market size and forecast 2025-2030 ($ million)
Chart on Japan - Year-over-year growth 2025-2030 (%)
Data Table on Japan - Year-over-year growth 2025-2030 (%)

13.5.3 India - Market size and forecast 2025-2030

Chart on India - Market size and forecast 2025-2030 ($ million)
Data Table on India - Market size and forecast 2025-2030 ($ million)
Chart on India - Year-over-year growth 2025-2030 (%)
Data Table on India - Year-over-year growth 2025-2030 (%)

13.5.4 South Korea - Market size and forecast 2025-2030

Chart on South Korea - Market size and forecast 2025-2030 ($ million)
Data Table on South Korea - Market size and forecast 2025-2030 ($ million)
Chart on South Korea - Year-over-year growth 2025-2030 (%)
Data Table on South Korea - Year-over-year growth 2025-2030 (%)

13.5.5 Australia - Market size and forecast 2025-2030

Chart on Australia - Market size and forecast 2025-2030 ($ million)
Data Table on Australia - Market size and forecast 2025-2030 ($ million)
Chart on Australia - Year-over-year growth 2025-2030 (%)
Data Table on Australia - Year-over-year growth 2025-2030 (%)

13.5.6 Indonesia - Market size and forecast 2025-2030

Chart on Indonesia - Market size and forecast 2025-2030 ($ million)
Data Table on Indonesia - Market size and forecast 2025-2030 ($ million)
Chart on Indonesia - Year-over-year growth 2025-2030 (%)
Data Table on Indonesia - Year-over-year growth 2025-2030 (%)

13.6 Middle East and Africa - Market size and forecast 2025-2030

Chart on Middle East and Africa - Market size and forecast 2025-2030 ($ million)
Data Table on Middle East and Africa - Market size and forecast 2025-2030 ($ million)
Chart on Middle East and Africa - Year-over-year growth 2025-2030 (%)
Data Table on Middle East and Africa - Year-over-year growth 2025-2030 (%)
Chart on Regional Comparison - Middle East and Africa
Data Table on Regional Comparison - Middle East and Africa

13.6.1 Saudi Arabia - Market size and forecast 2025-2030

Chart on Saudi Arabia - Market size and forecast 2025-2030 ($ million)
Data Table on Saudi Arabia - Market size and forecast 2025-2030 ($ million)
Chart on Saudi Arabia - Year-over-year growth 2025-2030 (%)
Data Table on Saudi Arabia - Year-over-year growth 2025-2030 (%)

13.6.2 UAE - Market size and forecast 2025-2030

Chart on UAE - Market size and forecast 2025-2030 ($ million)
Data Table on UAE - Market size and forecast 2025-2030 ($ million)
Chart on UAE - Year-over-year growth 2025-2030 (%)
Data Table on UAE - Year-over-year growth 2025-2030 (%)

13.6.3 South Africa - Market size and forecast 2025-2030

Chart on South Africa - Market size and forecast 2025-2030 ($ million)
Data Table on South Africa - Market size and forecast 2025-2030 ($ million)
Chart on South Africa - Year-over-year growth 2025-2030 (%)
Data Table on South Africa - Year-over-year growth 2025-2030 (%)

13.6.4 Israel - Market size and forecast 2025-2030

Chart on Israel - Market size and forecast 2025-2030 ($ million)
Data Table on Israel - Market size and forecast 2025-2030 ($ million)
Chart on Israel - Year-over-year growth 2025-2030 (%)
Data Table on Israel - Year-over-year growth 2025-2030 (%)

13.6.5 Turkey - Market size and forecast 2025-2030

Chart on Turkey - Market size and forecast 2025-2030 ($ million)
Data Table on Turkey - Market size and forecast 2025-2030 ($ million)
Chart on Turkey - Year-over-year growth 2025-2030 (%)
Data Table on Turkey - Year-over-year growth 2025-2030 (%)

13.7 South America - Market size and forecast 2025-2030

Chart on South America - Market size and forecast 2025-2030 ($ million)
Data Table on South America - Market size and forecast 2025-2030 ($ million)
Chart on South America - Year-over-year growth 2025-2030 (%)
Data Table on South America - Year-over-year growth 2025-2030 (%)
Chart on Regional Comparison - South America
Data Table on Regional Comparison - South America

13.7.1 Brazil - Market size and forecast 2025-2030

Chart on Brazil - Market size and forecast 2025-2030 ($ million)
Data Table on Brazil - Market size and forecast 2025-2030 ($ million)
Chart on Brazil - Year-over-year growth 2025-2030 (%)
Data Table on Brazil - Year-over-year growth 2025-2030 (%)

13.7.2 Argentina - Market size and forecast 2025-2030

Chart on Argentina - Market size and forecast 2025-2030 ($ million)
Data Table on Argentina - Market size and forecast 2025-2030 ($ million)
Chart on Argentina - Year-over-year growth 2025-2030 (%)
Data Table on Argentina - Year-over-year growth 2025-2030 (%)

13.7.3 Chile - Market size and forecast 2025-2030

Chart on Chile - Market size and forecast 2025-2030 ($ million)
Data Table on Chile - Market size and forecast 2025-2030 ($ million)
Chart on Chile - Year-over-year growth 2025-2030 (%)
Data Table on Chile - Year-over-year growth 2025-2030 (%)

13.8 Market opportunity by geography

Market opportunity by geography ($ million)
Data Tables on Market opportunity by geography ($ million)

14. Drivers, Challenges, and Opportunity

14.1 Market drivers

Industrial expansion and transition to end-use functional part manufacturing
Technological advancements in advanced polymer and metal formulations
Supply chain optimization and demand for decentralized manufacturing

14.2 Market challenges

High cost of specialized raw materials and financial constraints on scaling production
Lack of standardization and uniform quality control frameworks across material classes
Difficulties in achieving material consistency and managing environmental sensitivity

14.3 Impact of drivers and challenges

Impact of drivers and challenges in 2025 and 2030

14.4 Market opportunities

Rising adoption of sustainable, bio-based, and recyclable consumables
Proliferation of multi-material printing capabilities and gradient formulations
Integration of artificial intelligence and machine learning in material discovery

15. Competitive Landscape

15.1 Overview

15.2

Overview on criticality of inputs and factors of differentiation

15.3 Landscape disruption

Overview on factors of disruption

15.4 Industry risks

Impact of key risks on business

16. Competitive Analysis

16.1 Companies profiled

Companies covered

16.2 Company ranking index

16.3 Market positioning of companies

Matrix on companies position and classification

16.4 3D Systems Corp.

3D Systems Corp. - Overview
3D Systems Corp. - Business segments
3D Systems Corp. - Key offerings
3D Systems Corp. - Segment focus
SWOT

16.5 Arkema Group

Arkema Group - Overview
Arkema Group - Business segments
Arkema Group - Key offerings
Arkema Group - Segment focus
SWOT

16.6 Carpenter Additive

Carpenter Additive - Overview
Carpenter Additive - Product / Service
Carpenter Additive - Key offerings
SWOT

16.7 DuPont de Nemours Inc.

DuPont de Nemours Inc. - Overview
DuPont de Nemours Inc. - Business segments
DuPont de Nemours Inc. - Key news
DuPont de Nemours Inc. - Key offerings
DuPont de Nemours Inc. - Segment focus
SWOT

16.8 EnvisionTEC GmBH

EnvisionTEC GmBH - Overview
EnvisionTEC GmBH - Product / Service
EnvisionTEC GmBH - Key offerings
SWOT

16.9 EOS GmbH

EOS GmbH - Overview
EOS GmbH - Product / Service
EOS GmbH - Key offerings
SWOT

16.10 Evonik Industries AG

Evonik Industries AG - Overview
Evonik Industries AG - Business segments
Evonik Industries AG - Key offerings
Evonik Industries AG - Segment focus
SWOT

16.11 ExOne Company

ExOne Company - Overview
ExOne Company - Product / Service
ExOne Company - Key offerings
SWOT

16.12 Formlabs Inc.

Formlabs Inc. - Overview
Formlabs Inc. - Product / Service
Formlabs Inc. - Key offerings
SWOT

16.13 Huntsman International LLC

Huntsman International LLC - Overview
Huntsman International LLC - Business segments
Huntsman International LLC - Key offerings
Huntsman International LLC - Segment focus
SWOT

16.14 Markforged Inc.

Markforged Inc. - Overview
Markforged Inc. - Product / Service
Markforged Inc. - Key offerings
SWOT

16.15 Solvay SA

Solvay SA - Overview
Solvay SA - Business segments
Solvay SA - Key offerings
Solvay SA - Segment focus
SWOT

16.16 Stratasys Ltd.

Stratasys Ltd. - Overview
Stratasys Ltd. - Product / Service
Stratasys Ltd. - Key offerings
SWOT

16.17 Victrex Plc

Victrex Plc - Overview
Victrex Plc - Business segments
Victrex Plc - Key offerings
Victrex Plc - Segment focus
SWOT

16.18 voxeljet AG

voxeljet AG - Overview
voxeljet AG - Business segments
voxeljet AG - Key offerings
voxeljet AG - Segment focus
SWOT

17. Appendix

17.1 Scope of the report

Market definition
Objectives
Notes and caveats

17.2 Inclusions and exclusions checklist

Inclusions checklist
Exclusions checklist

17.3 Currency conversion rates for US$

17.4 Research methodology

17.5 Data procurement

Information sources

17.6 Data validation

17.7 Validation techniques employed for market sizing

17.8 Data synthesis

17.9 360 degree market analysis

17.10 List of abbreviations

Research Methodology

Technavio presents a detailed picture of the market by way of study, synthesis, and summation of data from multiple sources. The analysts have presented the various facets of the market with a particular focus on identifying the key industry influencers. The data thus presented is comprehensive, reliable, and the result of extensive research, both primary and secondary.

INFORMATION SOURCES

Primary sources

  • Manufacturers and suppliers
  • Channel partners
  • Industry experts
  • Strategic decision makers

Secondary sources

  • Industry journals and periodicals
  • Government data
  • Financial reports of key industry players
  • Historical data
  • Press releases

DATA ANALYSIS

Data Synthesis

  • Collation of data
  • Estimation of key figures
  • Analysis of derived insights

Data Validation

  • Triangulation with data models
  • Reference against proprietary databases
  • Corroboration with industry experts

REPORT WRITING

Qualitative

  • Market drivers
  • Market challenges
  • Market trends
  • Five forces analysis

Quantitative

  • Market size and forecast
  • Market segmentation
  • Geographical insights
  • Competitive landscape

Interested in this report?

Get your sample now to see our research methodology and insights!

Download Now

Frequently Asked Questions

3D Printing Materials market growth will increase by USD 7290.0 million during 2026-2030.

The 3D Printing Materials market is expected to grow at a CAGR of 22.3% during 2026-2030.

3D Printing Materials market is segmented by Material (Thermoplastic polymer, Metal powder, Photopolymer, Others) End-user (Aerospace and defense, Healthcare, Automotive, Consumer goods, Others) Technology (Fused deposition modeling (FDM), Selective laser sintering (SLS), Stereolithography (SLA), Direct metal laser sintering (DMLS), Others) Form factor (Powder, Filament, Liquid)

3D Systems Corp., Arkema Group, Carpenter Additive, ColorFabb B.V., CRP Technology Srl, DuPont de Nemours Inc., EnvisionTEC GmBH, EOS GmbH, Evonik Industries AG, ExOne Company, Extrudr GmbH, Fiberlogy, Fillamentum, Formlabs Inc., Huntsman International LLC, Markforged Inc., Solvay SA, Stratasys Ltd., Victrex Plc, voxeljet AG are a few of the key vendors in the 3D Printing Materials market.

North America will register the highest growth rate of 38.4% among the other regions. Therefore, the 3D Printing Materials market in North America is expected to garner significant business opportunities for the vendors during the forecast period.

US, Canada, Mexico, Germany, UK, France, Italy, Spain, The Netherlands, China, Japan, India, South Korea, Australia, Indonesia, Saudi Arabia, UAE, South Africa, Israel, Turkey, Brazil, Argentina, Chile

  • Industrial expansion and transition to end-use functional part manufacturing is the driving factor this market.

The 3D Printing Materials market vendors should focus on grabbing business opportunities from the Material segment as it accounted for the largest market share in the base year.
RIA - Research AI Assistant
Ask RIA