A2 Milk Market Size 2024-2028
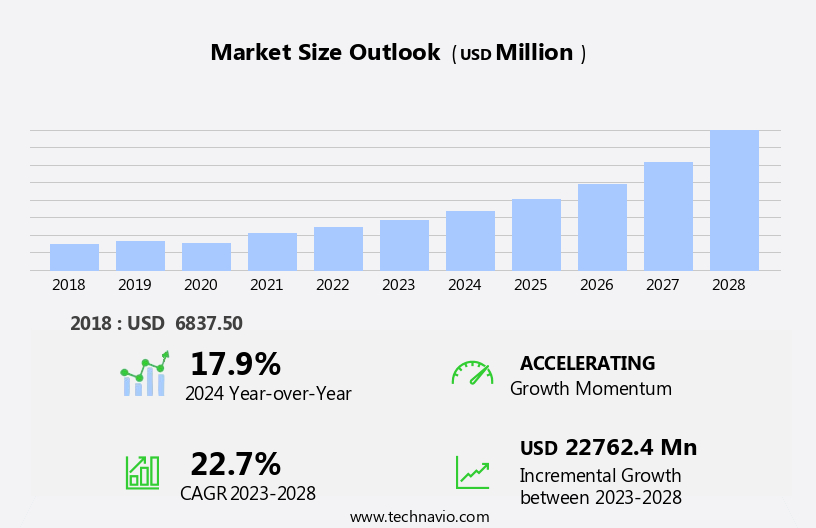
The a2 milk market size is forecast to increase by USD 22.76 billion, at a CAGR of 22.7% between 2023 and 2028.
- The market is characterized by the growing preference for high nutritional value and long shelf life dairy products. This trend is driven by the increasing awareness of health and wellness, leading consumers to seek out milk alternatives with unique nutritional benefits. Additionally, the rising importance of organic dairy food is fueling market growth, as consumers demand more natural and ethically produced milk options. However, the market faces challenges from the growing vegan population, who opt for plant-based alternatives due to ethical and environmental concerns.
- Companies seeking to capitalize on market opportunities must focus on innovation and product differentiation, while navigating the increasing competition from plant-based milk alternatives. Effective marketing strategies, targeting health-conscious and ethically-minded consumers, will be crucial for success in this dynamic market.
What will be the Size of the A2 Milk Market during the forecast period?

Explore in-depth regional segment analysis with market size data - historical 2018-2022 and forecasts 2024-2028 - in the full report.
Request Free Sample
The market continues to evolve, driven by ongoing research and advancements in milk production, processing, and consumer preferences. Vitamin content analysis plays a crucial role in ensuring the nutritional value of A2 milk, with studies focusing on optimizing milk mineral composition and enhancing digestibility. Milk processing techniques, such as ultrafiltration membrane technology, impact the final product's quality, affecting protein denaturation and lactalbumin concentration. Packaging material selection influences milk's shelf life extension, while dairy digestibility studies explore the role of gut microbiota analysis in optimizing consumer health benefits. Pasteurization techniques and food safety regulations are essential considerations, with microbial contamination control and quality control metrics ensuring product safety and consistency.
Consumer perception studies delve into the impact of milk protein structure, casein micelle size, and amino acid profiling on taste and texture preferences. The ongoing debate between A1 and A2 beta-casein proteins highlights the importance of milk protein allergenicity and nutritional labeling requirements. Sustainable dairy farming practices, such as efficient milk production and cow health indicators, contribute to the market's evolving dynamics. The market also witnesses the emergence of infant formula proteins, sensory evaluation methods, and clinical trial data to substantiate health claims. Homogenization pressure and milk protein structure continue to be areas of investigation, with ongoing research focusing on improving milk processing techniques and enhancing consumer satisfaction.
The market's continuous dynamism underscores the importance of staying informed about the latest trends and advancements.
How is this A2 Milk Industry segmented?
The a2 milk industry research report provides comprehensive data (region-wise segment analysis), with forecasts and estimates in "USD million" for the period 2024-2028, as well as historical data from 2018-2022 for the following segments.
- Distribution Channel
- Product Type
- Liquid A2 Milk
- Powdered A2 Milk
- A2 Milk-Based Products (Yogurt, Cheese)
- Consumer Segment
- Health-Conscious Consumers
- Lactose-Intolerant Consumers
- General Consumers
- Application
- Household
- Foodservice
- Food Processing
- Geography
- North America
- Europe
- France
- Germany
- Italy
- Russia
- UK
- Middle East and Africa
- APAC
- China
- India
- Japan
- South Korea
- South America
- Rest of World (ROW)
By Distribution Channel Insights
The offline segment is estimated to witness significant growth during the forecast period.
The market is witnessing significant growth, with supermarkets and hypermarkets leading the distribution landscape. The expanding retail sector and the proliferation of retail outlets, particularly in emerging economies like India, China, and Thailand, are fueling sales in this segment. Consumers are drawn to these channels due to the extensive range of A2 milk offerings, including whole milk, fat-free milk, and half and half. Convenience is another key factor, as consumers can find all their shopping needs in one place. Grocery and convenience stores also remain popular due to their multi-utility nature, broad merchandise mix, and extended hours of operation.
Vitamin content analysis and milk processing techniques play a crucial role in the production of A2 milk. Packaging materials impact the shelf life and consumer perception, while dairy digestibility studies and immune system response are essential for understanding the health benefits. Pasteurization and lactalbumin concentration influence milk protein structure and allergenicity. Sustainable dairy farming, quality control metrics, and microbial contamination control are essential for ensuring food safety. Gut microbiota analysis, ultrafiltration membranes, and protein denaturation effects are areas of ongoing research. Consumer perception studies and clinical trial data inform health claim substantiation. Milk mineral composition, milk production efficiency, and casein micelle size are essential factors for manufacturers.
Sensory evaluation methods and amino acid profiling are used to assess product quality. Infant formula protein and a1 beta-casein comparison are topics of interest for the infant nutrition industry. Nutritional labeling requirements and homogenization pressure are essential considerations for marketing and production. Whey protein concentrate is a valuable byproduct in the dairy industry. Cow health indicators and infant development metrics are essential for ensuring the welfare of animals and the optimal growth and development of infants. Food safety regulations and regulations on milk protein allergenicity are crucial for maintaining consumer trust and ensuring product safety. Overall, the market is dynamic and evolving, with a focus on innovation, quality, and sustainability.

Request Free Sample
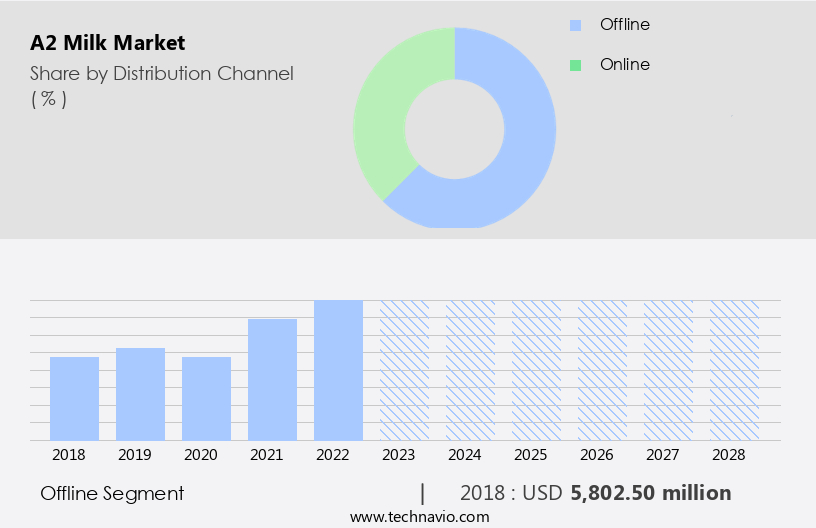
The Offline segment was valued at USD 5.8 billion in 2018 and showed a gradual increase during the forecast period.
Regional Analysis
APAC is estimated to contribute 85% to the growth of the global market during the forecast period.Technavio’s analysts have elaborately explained the regional trends and drivers that shape the market during the forecast period.

Request Free Sample
The market in Asia Pacific is experiencing significant growth due to several factors. The rising incidence of bone diseases and increasing awareness about the benefits of healthy eating are key drivers. Additionally, urbanization, the organized retail sector's rapid expansion, and the growing demand for A2 milk products contribute to market growth. Online retail channels are gaining popularity due to their convenience and doorstep delivery services, propelled by increasing Internet connectivity in the region. E-commerce platforms such as IndiaMart, Amazon, and Innovative Retail Concepts Pvt. Ltd. Are major players in this space. Milk processing techniques, including vitamin content analysis and pasteurization, impact the market.
Lactalbumin concentration and digestive health benefits are significant factors influencing consumer perception. Immune system response and milk mineral composition are essential considerations for consumers seeking nutritional value. Sustainable dairy farming practices and quality control metrics are vital for maintaining consumer trust. Microbial contamination control and food safety regulations are critical for ensuring product safety. Gut microbiota analysis and ultrafiltration membrane technology are essential for improving milk protein structure and extending shelf life. Protein denaturation effects and milk protein allergenicity are areas of ongoing research. Milk production efficiency and casein micelle size are essential factors for milk processors. Sensory evaluation methods, amino acid profiling, and infant formula protein are crucial for catering to diverse consumer needs.
A1 beta-casein comparison and nutritional labeling requirements are essential for transparency and health claim substantiation. Homogenization pressure and clinical trial data are vital for understanding milk protein structure and its impact on cow health and infant development. Whey protein concentrate is a valuable byproduct of milk processing.
Market Dynamics
Our researchers analyzed the data with 2023 as the base year, along with the key drivers, trends, and challenges. A holistic analysis of drivers will help companies refine their marketing strategies to gain a competitive advantage.
What are the key market drivers leading to the rise in the adoption of A2 Milk Industry?
- The market is driven by the essential attributes of high nutritional value and extended shelf life in food products.
- The market is experiencing growth due to increasing consumer awareness and focus on nutrition. This trend is driven by the desire for milk products that contain essential nutrients like calcium, vitamin A, and phosphorus. A2 milk's longer shelf life, resulting from high-temperature pasteurization, also appeals to urban consumers. Additionally, the availability of low-sugar and fat-free A2 milk varieties caters to the health-conscious and diabetic population. Nutrition labeling requirements and health claim substantiation are crucial factors in this market. The production process of A2 milk involves homogenization at lower pressure than regular milk, preserving the natural proteins and minerals.
- Clinical trial data supports the health benefits of A2 milk, particularly for infant development metrics and cow health indicators. Overall, the market is expected to expand as consumers prioritize health and convenience in their dairy choices.
What are the market trends shaping the A2 Milk Industry?
- The rising significance of organic dairy products is a notable market trend. Consumers are increasingly seeking out dairy items that are produced using organic farming methods.
- The dairy industry is witnessing a shift towards organic milk production due to growing concerns over the potential health risks associated with conventional milk. Cattle are sometimes given synthetic growth hormones and antibiotics to increase milk yield and treat sicknesses, respectively. These substances can remain in the milk, leading to economic losses for manufacturers of fermented milk products. Long-term consumption of such milk may result in various health issues, including changes in endocrine functions and the transmission of antibiotic-resistant infections. To cater to the increasing demand for healthier dairy options, milk processing techniques have evolved to ensure the removal of antibiotics and growth hormones.
- Vitamin content analysis and pasteurization impact studies are crucial in maintaining the nutritional integrity of organic milk. Additionally, dairy digestibility studies and lactalbumin concentration analysis contribute to enhancing the digestive health benefits and immune system response of organic milk. The mineral composition of organic milk is another essential factor, as it is known to contain more minerals like calcium, magnesium, and potassium compared to conventional milk. As a result, organic milk is gaining popularity among health-conscious consumers, driving market growth in the dairy industry.
What challenges does the A2 Milk Industry face during its growth?
- The expanding vegan population poses a significant challenge to the growth of the industry.
- The market is experiencing significant shifts due to increasing consumer preference for sustainable dairy farming and high-quality products. With a focus on food safety regulations and microbial contamination control, dairy farmers are implementing rigorous quality control metrics to meet consumer demands. Gut microbiota analysis and ultrafiltration membrane technology are being employed to preserve the natural protein structure and minimize protein denaturation effects. Consumer perception studies indicate that A2 milk is perceived as healthier and easier to digest than traditional A1 milk.
- This perception, coupled with the trend toward longer shelf life extension, is driving market growth. Food safety regulations continue to be a critical factor, as stringent regulations ensure the production of safe and high-quality milk products. By prioritizing these factors, the market is poised for continued growth and innovation.
Exclusive Customer Landscape
The a2 milk market forecasting report includes the adoption lifecycle of the market, covering from the innovator’s stage to the laggard’s stage. It focuses on adoption rates in different regions based on penetration. Furthermore, the a2 milk market report also includes key purchase criteria and drivers of price sensitivity to help companies evaluate and develop their market growth analysis strategies.
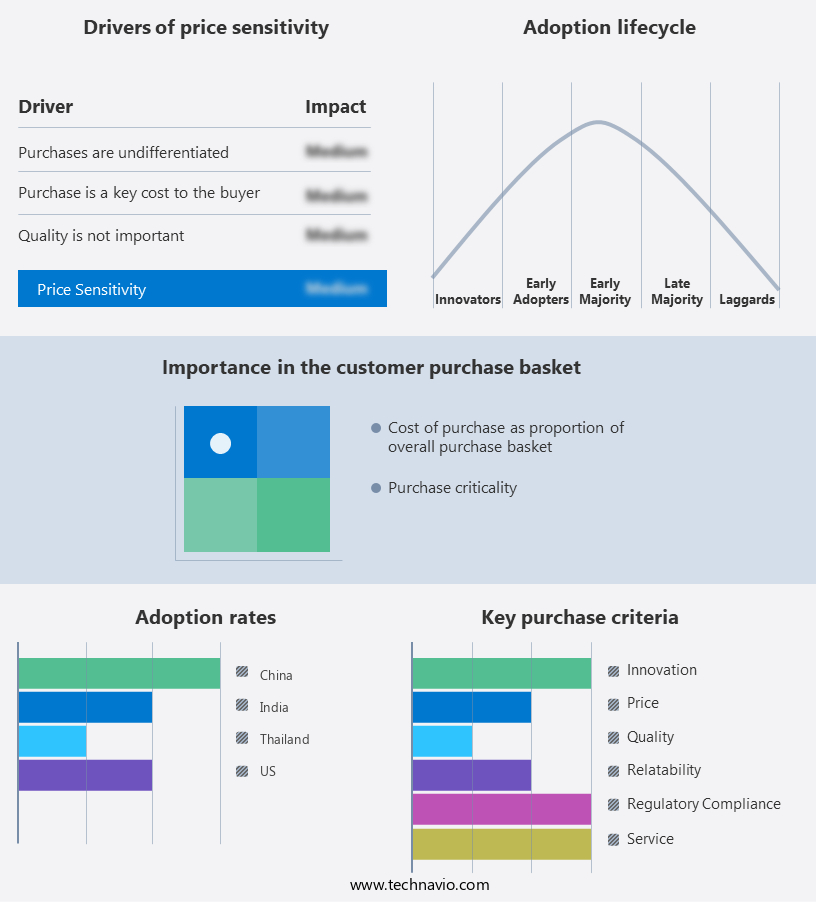
Customer Landscape
Key Companies & Market Insights
Companies are implementing various strategies, such as strategic alliances, a2 milk market forecast, partnerships, mergers and acquisitions, geographical expansion, and product/service launches, to enhance their presence in the industry.
Bega Cheese Ltd. - The company specializes in providing A2 milk, including Erden A2 Milk, derived from A2 breed cows. This milk variant caters to consumers seeking a more digestible and nutritious alternative, sourced from carefully selected herds.
The industry research and growth report includes detailed analyses of the competitive landscape of the market and information about key companies, including:
- Bega Cheese Ltd.
- BK Enterprises
- Desi Delight
- Erden Creamery Pvt. Ltd.
- Freedom Foods Group Ltd.
- Gir Organic
- Gujarat Cooperative Milk Marketing Federation Ltd.
- Hetha Organics LLP
- Mittal Happy Cows Dairy Farms LLP
- Oshun Food Products Pvt. Ltd.
- P9 Farm Pvt. Ltd.
- Provilac Dairy Farms Pvt. Ltd.
- Ratnawali Dairy Products LLP
- Ripley Farms LLC
- Taw River Dairy
- The a2 Milk Co. Ltd.
- Urban Farms Milk
- Vedaaz Organics Pvt. Ltd.
- VINAMILK Corp.
- Vrindavan Dairy LLP
Qualitative and quantitative analysis of companies has been conducted to help clients understand the wider business environment as well as the strengths and weaknesses of key industry players. Data is qualitatively analyzed to categorize companies as pure play, category-focused, industry-focused, and diversified; it is quantitatively analyzed to categorize companies as dominant, leading, strong, tentative, and weak.
Recent Development and News in A2 Milk Market
- In January 2024, A2 Milk Company announced the launch of its new product, A2 Platinum, in the United States. A2 Platinum is a full-cream milk fortified with calcium and vitamin D, catering to the growing demand for nutrient-rich dairy products (A2 Milk Company Press Release, 2024).
- In March 2024, A2 Milk entered into a strategic partnership with Fonterra, the world's largest dairy exporter, to expand its production capacity and distribution network in New Zealand (Reuters, 2024).
- In May 2024, A2 Milk secured a significant regulatory approval from the Chinese Food and Drug Administration, allowing it to sell its infant formula products in China (A2 Milk Company Press Release, 2024).
- In April 2025, A2 Milk raised NZUSD100 million through a share placement to fund its expansion plans, including the development of a new manufacturing facility in New Zealand (Wall Street Journal, 2025).
Research Analyst Overview
- In the dynamic the market, quality assurance systems play a crucial role in ensuring product authenticity and consumer trust. Antibiotic residue detection and hormone residue analysis are essential components of these systems. Milk's gelation kinetics, flavor compound analysis, rheological properties, and milk protein solubility are vital factors influencing market trends. Whey utilization, protein hydrolysates, and milk fractionation are key areas of innovation, driving growth. Heavy metal analysis, milk adulteration detection, and milk powder characteristics are critical for maintaining product integrity.
- Enzymatic hydrolysis, thermal stability, and pesticide residue analysis are essential for optimizing milk processing. Beta-casein variants, lipid oxidation, trace element detection, protein glycation, yogurt fermentation, protein functionality, cheese making technology, and peptide identification are advanced research topics shaping the future of the market.
Dive into Technavio’s robust research methodology, blending expert interviews, extensive data synthesis, and validated models for unparalleled A2 Milk Market insights. See full methodology.
|
Market Scope
|
|
Report Coverage
|
Details
|
|
Page number
|
158
|
|
Base year
|
2023
|
|
Historic period
|
2018-2022 |
|
Forecast period
|
2024-2028
|
|
Growth momentum & CAGR
|
Accelerate at a CAGR of 22.7%
|
|
Market growth 2024-2028
|
USD 22762.4 million
|
|
Market structure
|
Fragmented
|
|
YoY growth 2023-2024(%)
|
17.9
|
|
Key countries
|
Brazil, South Africa, UAE, US, Canada, Germany, UK, China, France, Italy, Japan, India, South Korea, Argentina, and Russia
|
|
Competitive landscape
|
Leading Companies, Market Positioning of Companies, Competitive Strategies, and Industry Risks
|
Request Free Sample
What are the Key Data Covered in this A2 Milk Market Research and Growth Report?
- CAGR of the A2 Milk industry during the forecast period
- Detailed information on factors that will drive the growth and forecasting between 2024 and 2028
- Precise estimation of the size of the market and its contribution of the industry in focus to the parent market
- Accurate predictions about upcoming growth and trends and changes in consumer behaviour
- Growth of the market across APAC, North America, Europe, Middle East and Africa, and South America
- Thorough analysis of the market’s competitive landscape and detailed information about companies
- Comprehensive analysis of factors that will challenge the a2 milk market growth of industry companies
We can help! Our analysts can customize this a2 milk market research report to meet your requirements.
Get in touch
1 Executive Summary
- 1.1 Market overview
- Executive Summary - Chart on Market Overview
- Executive Summary - Data Table on Market Overview
- Executive Summary - Chart on Global Market Characteristics
- Executive Summary - Chart on Market by Geography
- Executive Summary - Chart on Market Segmentation by Distribution Channel
- Executive Summary - Chart on Incremental Growth
- Executive Summary - Data Table on Incremental Growth
- Executive Summary - Chart on Company Market Positioning
2 Technavio Analysis
- 2.1 Analysis of price sensitivity, lifecycle, customer purchase basket, adoption rates, and purchase criteria
- Analysis of price sensitivity, lifecycle, customer purchase basket, adoption rates, and purchase criteria
- 2.2 Criticality of inputs and Factors of differentiation
- Overview on criticality of inputs and factors of differentiation
- 2.3 Factors of disruption
- Overview on factors of disruption
- 2.4 Impact of drivers and challenges
- Impact of drivers and challenges in 2023 and 2028
3 Market Landscape
- 3.1 Market ecosystem
- Parent Market
- Data Table on - Parent Market
- 3.2 Market characteristics
- Market characteristics analysis
4 Market Sizing
- 4.1 Market definition
- Offerings of companies included in the market definition
- 4.2 Market segment analysis
- 4.4 Market outlook: Forecast for 2023-2028
- Chart on Global - Market size and forecast 2023-2028 ($ million)
- Data Table on Global - Market size and forecast 2023-2028 ($ million)
- Chart on Global Market: Year-over-year growth 2023-2028 (%)
- Data Table on Global Market: Year-over-year growth 2023-2028 (%)
5 Historic Market Size
- 5.1 Global A2 Milk Market 2018 - 2022
- Historic Market Size - Data Table on Global A2 Milk Market 2018 - 2022 ($ million)
- 5.2 Distribution Channel segment analysis 2018 - 2022
- Historic Market Size - Distribution Channel Segment 2018 - 2022 ($ million)
- 5.3 Geography segment analysis 2018 - 2022
- Historic Market Size - Geography Segment 2018 - 2022 ($ million)
- 5.4 Country segment analysis 2018 - 2022
- Historic Market Size - Country Segment 2018 - 2022 ($ million)
6 Five Forces Analysis
- 6.1 Five forces summary
- Five forces analysis - Comparison between 2023 and 2028
- 6.2 Bargaining power of buyers
- Bargaining power of buyers - Impact of key factors 2023 and 2028
- 6.3 Bargaining power of suppliers
- Bargaining power of suppliers - Impact of key factors in 2023 and 2028
- 6.4 Threat of new entrants
- Threat of new entrants - Impact of key factors in 2023 and 2028
- 6.5 Threat of substitutes
- Threat of substitutes - Impact of key factors in 2023 and 2028
- 6.6 Threat of rivalry
- Threat of rivalry - Impact of key factors in 2023 and 2028
- 6.7 Market condition
- Chart on Market condition - Five forces 2023 and 2028
7 Market Segmentation by Distribution Channel
- 7.1 Market segments
- Chart on Distribution Channel - Market share (2023-2028) (%)
- Data Table on Distribution Channel - Market share (2023-2028) (%)
- 7.2 Comparison by Distribution Channel
- Chart on Comparison by Distribution Channel
- Data Table on Comparison by Distribution Channel
- 7.3 Offline - Market size and forecast (2023-2028)
- Chart on Offline - Market size and forecast (2023-2028) ($ million)
- Data Table on Offline - Market size and forecast (2023-2028) ($ million)
- Chart on Offline - Year-over-year growth (2023-2028) (%)
- Data Table on Offline - Year-over-year growth (2023-2028) (%)
- 7.4 Online - Market size and forecast (2023-2028)
- Chart on Online - Market size and forecast (2023-2028) ($ million)
- Data Table on Online - Market size and forecast (2023-2028) ($ million)
- Chart on Online - Year-over-year growth (2023-2028) (%)
- Data Table on Online - Year-over-year growth (2023-2028) (%)
- 7.5 Market opportunity by Distribution Channel
- Market opportunity by Distribution Channel ($ million)
- Data Table on Market opportunity by Distribution Channel ($ million)
8 Market Segmentation by Product Type
- 8.1 Market segments
- Chart on Product Type - Market share (2023-2028) (%)
- Data Table on Product Type - Market share (2023-2028) (%)
- 8.2 Comparison by Product Type
- Chart on Comparison by Product Type
- Data Table on Comparison by Product Type
- 8.3 Liquid A2 Milk - Market size and forecast (2023-2028)
- Chart on Liquid A2 Milk - Market size and forecast (2023-2028) ($ million)
- Data Table on Liquid A2 Milk - Market size and forecast (2023-2028) ($ million)
- Chart on Liquid A2 Milk - Year-over-year growth (2023-2028) (%)
- Data Table on Liquid A2 Milk - Year-over-year growth (2023-2028) (%)
- 8.4 Powdered A2 Milk - Market size and forecast (2023-2028)
- Chart on Powdered A2 Milk - Market size and forecast (2023-2028) ($ million)
- Data Table on Powdered A2 Milk - Market size and forecast (2023-2028) ($ million)
- Chart on Powdered A2 Milk - Year-over-year growth (2023-2028) (%)
- Data Table on Powdered A2 Milk - Year-over-year growth (2023-2028) (%)
- 8.5 A2 Milk-Based Products (Yogurt, Cheese) - Market size and forecast (2023-2028)
- Chart on A2 Milk-Based Products (Yogurt, Cheese) - Market size and forecast (2023-2028) ($ million)
- Data Table on A2 Milk-Based Products (Yogurt, Cheese) - Market size and forecast (2023-2028) ($ million)
- Chart on A2 Milk-Based Products (Yogurt, Cheese) - Year-over-year growth (2023-2028) (%)
- Data Table on A2 Milk-Based Products (Yogurt, Cheese) - Year-over-year growth (2023-2028) (%)
- 8.6 Market opportunity by Product Type
- Market opportunity by Product Type ($ million)
- Data Table on Market opportunity by Product Type ($ million)
9 Market Segmentation by Consumer Segment
- 9.1 Market segments
- Chart on Consumer Segment - Market share (2023-2028) (%)
- Data Table on Consumer Segment - Market share (2023-2028) (%)
- 9.2 Comparison by Consumer Segment
- Chart on Comparison by Consumer Segment
- Data Table on Comparison by Consumer Segment
- 9.3 Health-Conscious Consumers - Market size and forecast (2023-2028)
- Chart on Health-Conscious Consumers - Market size and forecast (2023-2028) ($ million)
- Data Table on Health-Conscious Consumers - Market size and forecast (2023-2028) ($ million)
- Chart on Health-Conscious Consumers - Year-over-year growth (2023-2028) (%)
- Data Table on Health-Conscious Consumers - Year-over-year growth (2023-2028) (%)
- 9.4 Lactose-Intolerant Consumers - Market size and forecast (2023-2028)
- Chart on Lactose-Intolerant Consumers - Market size and forecast (2023-2028) ($ million)
- Data Table on Lactose-Intolerant Consumers - Market size and forecast (2023-2028) ($ million)
- Chart on Lactose-Intolerant Consumers - Year-over-year growth (2023-2028) (%)
- Data Table on Lactose-Intolerant Consumers - Year-over-year growth (2023-2028) (%)
- 9.5 General Consumers - Market size and forecast (2023-2028)
- Chart on General Consumers - Market size and forecast (2023-2028) ($ million)
- Data Table on General Consumers - Market size and forecast (2023-2028) ($ million)
- Chart on General Consumers - Year-over-year growth (2023-2028) (%)
- Data Table on General Consumers - Year-over-year growth (2023-2028) (%)
- 9.6 Market opportunity by Consumer Segment
- Market opportunity by Consumer Segment ($ million)
- Data Table on Market opportunity by Consumer Segment ($ million)
10 Market Segmentation by Application
- 10.1 Market segments
- Chart on Application - Market share (2023-2028) (%)
- Data Table on Application - Market share (2023-2028) (%)
- 10.2 Comparison by Application
- Chart on Comparison by Application
- Data Table on Comparison by Application
- 10.3 Household - Market size and forecast (2023-2028)
- Chart on Household - Market size and forecast (2023-2028) ($ million)
- Data Table on Household - Market size and forecast (2023-2028) ($ million)
- Chart on Household - Year-over-year growth (2023-2028) (%)
- Data Table on Household - Year-over-year growth (2023-2028) (%)
- 10.4 Foodservice - Market size and forecast (2023-2028)
- Chart on Foodservice - Market size and forecast (2023-2028) ($ million)
- Data Table on Foodservice - Market size and forecast (2023-2028) ($ million)
- Chart on Foodservice - Year-over-year growth (2023-2028) (%)
- Data Table on Foodservice - Year-over-year growth (2023-2028) (%)
- 10.5 Food Processing - Market size and forecast (2023-2028)
- Chart on Food Processing - Market size and forecast (2023-2028) ($ million)
- Data Table on Food Processing - Market size and forecast (2023-2028) ($ million)
- Chart on Food Processing - Year-over-year growth (2023-2028) (%)
- Data Table on Food Processing - Year-over-year growth (2023-2028) (%)
- 10.6 Market opportunity by Application
- Market opportunity by Application ($ million)
- Data Table on Market opportunity by Application ($ million)
11 Customer Landscape
- 11.1 Customer landscape overview
- Analysis of price sensitivity, lifecycle, customer purchase basket, adoption rates, and purchase criteria
12 Geographic Landscape
- 12.1 Geographic segmentation
- Chart on Market share by geography 2023-2028 (%)
- Data Table on Market share by geography 2023-2028 (%)
- 12.2 Geographic comparison
- Chart on Geographic comparison
- Data Table on Geographic comparison
- 12.3 APAC - Market size and forecast 2023-2028
- Chart on APAC - Market size and forecast 2023-2028 ($ million)
- Data Table on APAC - Market size and forecast 2023-2028 ($ million)
- Chart on APAC - Year-over-year growth 2023-2028 (%)
- Data Table on APAC - Year-over-year growth 2023-2028 (%)
- 12.4 North America - Market size and forecast 2023-2028
- Chart on North America - Market size and forecast 2023-2028 ($ million)
- Data Table on North America - Market size and forecast 2023-2028 ($ million)
- Chart on North America - Year-over-year growth 2023-2028 (%)
- Data Table on North America - Year-over-year growth 2023-2028 (%)
- 12.5 Europe - Market size and forecast 2023-2028
- Chart on Europe - Market size and forecast 2023-2028 ($ million)
- Data Table on Europe - Market size and forecast 2023-2028 ($ million)
- Chart on Europe - Year-over-year growth 2023-2028 (%)
- Data Table on Europe - Year-over-year growth 2023-2028 (%)
- 12.6 Middle East and Africa - Market size and forecast 2023-2028
- Chart on Middle East and Africa - Market size and forecast 2023-2028 ($ million)
- Data Table on Middle East and Africa - Market size and forecast 2023-2028 ($ million)
- Chart on Middle East and Africa - Year-over-year growth 2023-2028 (%)
- Data Table on Middle East and Africa - Year-over-year growth 2023-2028 (%)
- 12.7 South America - Market size and forecast 2023-2028
- Chart on South America - Market size and forecast 2023-2028 ($ million)
- Data Table on South America - Market size and forecast 2023-2028 ($ million)
- Chart on South America - Year-over-year growth 2023-2028 (%)
- Data Table on South America - Year-over-year growth 2023-2028 (%)
- 12.8 China - Market size and forecast 2023-2028
- Chart on China - Market size and forecast 2023-2028 ($ million)
- Data Table on China - Market size and forecast 2023-2028 ($ million)
- Chart on China - Year-over-year growth 2023-2028 (%)
- Data Table on China - Year-over-year growth 2023-2028 (%)
- 12.9 US - Market size and forecast 2023-2028
- Chart on US - Market size and forecast 2023-2028 ($ million)
- Data Table on US - Market size and forecast 2023-2028 ($ million)
- Chart on US - Year-over-year growth 2023-2028 (%)
- Data Table on US - Year-over-year growth 2023-2028 (%)
- 12.10 India - Market size and forecast 2023-2028
- Chart on India - Market size and forecast 2023-2028 ($ million)
- Data Table on India - Market size and forecast 2023-2028 ($ million)
- Chart on India - Year-over-year growth 2023-2028 (%)
- Data Table on India - Year-over-year growth 2023-2028 (%)
- 12.11 Thailand - Market size and forecast 2023-2028
- Chart on Thailand - Market size and forecast 2023-2028 ($ million)
- Data Table on Thailand - Market size and forecast 2023-2028 ($ million)
- Chart on Thailand - Year-over-year growth 2023-2028 (%)
- Data Table on Thailand - Year-over-year growth 2023-2028 (%)
- 12.12 Germany - Market size and forecast 2023-2028
- Chart on Germany - Market size and forecast 2023-2028 ($ million)
- Data Table on Germany - Market size and forecast 2023-2028 ($ million)
- Chart on Germany - Year-over-year growth 2023-2028 (%)
- Data Table on Germany - Year-over-year growth 2023-2028 (%)
- 12.13 Canada - Market size and forecast 2023-2028
- Chart on Canada - Market size and forecast 2023-2028 ($ million)
- Data Table on Canada - Market size and forecast 2023-2028 ($ million)
- Chart on Canada - Year-over-year growth 2023-2028 (%)
- Data Table on Canada - Year-over-year growth 2023-2028 (%)
- 12.14 UK - Market size and forecast 2023-2028
- Chart on UK - Market size and forecast 2023-2028 ($ million)
- Data Table on UK - Market size and forecast 2023-2028 ($ million)
- Chart on UK - Year-over-year growth 2023-2028 (%)
- Data Table on UK - Year-over-year growth 2023-2028 (%)
- 12.15 Italy - Market size and forecast 2023-2028
- Chart on Italy - Market size and forecast 2023-2028 ($ million)
- Data Table on Italy - Market size and forecast 2023-2028 ($ million)
- Chart on Italy - Year-over-year growth 2023-2028 (%)
- Data Table on Italy - Year-over-year growth 2023-2028 (%)
- 12.16 Brazil - Market size and forecast 2023-2028
- Chart on Brazil - Market size and forecast 2023-2028 ($ million)
- Data Table on Brazil - Market size and forecast 2023-2028 ($ million)
- Chart on Brazil - Year-over-year growth 2023-2028 (%)
- Data Table on Brazil - Year-over-year growth 2023-2028 (%)
- 12.17 Saudi Arabia - Market size and forecast 2023-2028
- Chart on Saudi Arabia - Market size and forecast 2023-2028 ($ million)
- Data Table on Saudi Arabia - Market size and forecast 2023-2028 ($ million)
- Chart on Saudi Arabia - Year-over-year growth 2023-2028 (%)
- Data Table on Saudi Arabia - Year-over-year growth 2023-2028 (%)
- 12.18 Market opportunity by geography
- Market opportunity by geography ($ million)
- Data Tables on Market opportunity by geography ($ million)
- 12.19 Brazil - Market size and forecast (2023-2028)
- Chart on Brazil - Market size and forecast (2023-2028) ($ million)
- Data Table on Brazil - Market size and forecast (2023-2028) ($ million)
- Chart on Brazil - Year-over-year growth (2023-2028) (%)
- Data Table on Brazil - Year-over-year growth (2023-2028) (%)
- 12.20 South Africa - Market size and forecast (2023-2028)
- Chart on South Africa - Market size and forecast (2023-2028) ($ million)
- Data Table on South Africa - Market size and forecast (2023-2028) ($ million)
- Chart on South Africa - Year-over-year growth (2023-2028) (%)
- Data Table on South Africa - Year-over-year growth (2023-2028) (%)
- 12.21 UAE - Market size and forecast (2023-2028)
- Chart on UAE - Market size and forecast (2023-2028) ($ million)
- Data Table on UAE - Market size and forecast (2023-2028) ($ million)
- Chart on UAE - Year-over-year growth (2023-2028) (%)
- Data Table on UAE - Year-over-year growth (2023-2028) (%)
- 12.22 France - Market size and forecast (2023-2028)
- Chart on France - Market size and forecast (2023-2028) ($ million)
- Data Table on France - Market size and forecast (2023-2028) ($ million)
- Chart on France - Year-over-year growth (2023-2028) (%)
- Data Table on France - Year-over-year growth (2023-2028) (%)
- 12.23 Japan - Market size and forecast (2023-2028)
- Chart on Japan - Market size and forecast (2023-2028) ($ million)
- Data Table on Japan - Market size and forecast (2023-2028) ($ million)
- Chart on Japan - Year-over-year growth (2023-2028) (%)
- Data Table on Japan - Year-over-year growth (2023-2028) (%)
- 12.24 South Korea - Market size and forecast (2023-2028)
- Chart on South Korea - Market size and forecast (2023-2028) ($ million)
- Data Table on South Korea - Market size and forecast (2023-2028) ($ million)
- Chart on South Korea - Year-over-year growth (2023-2028) (%)
- Data Table on South Korea - Year-over-year growth (2023-2028) (%)
- 12.25 Argentina - Market size and forecast (2023-2028)
- Chart on Argentina - Market size and forecast (2023-2028) ($ million)
- Data Table on Argentina - Market size and forecast (2023-2028) ($ million)
- Chart on Argentina - Year-over-year growth (2023-2028) (%)
- Data Table on Argentina - Year-over-year growth (2023-2028) (%)
- 12.26 Russia - Market size and forecast (2023-2028)
- Chart on Russia - Market size and forecast (2023-2028) ($ million)
- Data Table on Russia - Market size and forecast (2023-2028) ($ million)
- Chart on Russia - Year-over-year growth (2023-2028) (%)
- Data Table on Russia - Year-over-year growth (2023-2028) (%)
- 12.27 Rest of World (ROW) - Market size and forecast (2023-2028)
- Chart on Rest of World (ROW) - Market size and forecast (2023-2028) ($ million)
- Data Table on Rest of World (ROW) - Market size and forecast (2023-2028) ($ million)
- Chart on Rest of World (ROW) - Year-over-year growth (2023-2028) (%)
- Data Table on Rest of World (ROW) - Year-over-year growth (2023-2028) (%)
13 Drivers, Challenges, and Opportunity/Restraints
- 13.3 Impact of drivers and challenges
- Impact of drivers and challenges in 2023 and 2028
- 13.4 Market opportunities/restraints
14 Competitive Landscape
- 14.2 Competitive Landscape
- Overview on criticality of inputs and factors of differentiation
- 14.3 Landscape disruption
- Overview on factors of disruption
- 14.4 Industry risks
- Impact of key risks on business
15 Competitive Analysis
- 15.2 Company ranking index
- 15.3 Market positioning of companies
- Matrix on companies position and classification
- 15.4 Erden Creamery Pvt. Ltd.
- Erden Creamery Pvt. Ltd. - Overview
- Erden Creamery Pvt. Ltd. - Product / Service
- Erden Creamery Pvt. Ltd. - Key offerings
- SWOT
- 15.5 Freedom Foods Group Ltd.
- Freedom Foods Group Ltd. - Overview
- Freedom Foods Group Ltd. - Business segments
- Freedom Foods Group Ltd. - Key offerings
- Freedom Foods Group Ltd. - Segment focus
- SWOT
- 15.6 Gujarat Cooperative Milk Marketing Federation Ltd.
- Gujarat Cooperative Milk Marketing Federation Ltd. - Overview
- Gujarat Cooperative Milk Marketing Federation Ltd. - Product / Service
- Gujarat Cooperative Milk Marketing Federation Ltd. - Key offerings
- SWOT
- 15.7 Provilac Dairy Farms Pvt. Ltd.
- Provilac Dairy Farms Pvt. Ltd. - Overview
- Provilac Dairy Farms Pvt. Ltd. - Product / Service
- Provilac Dairy Farms Pvt. Ltd. - Key offerings
- SWOT
- 15.8 Ripley Farms LLC
- Ripley Farms LLC - Overview
- Ripley Farms LLC - Product / Service
- Ripley Farms LLC - Key offerings
- SWOT
- 15.9 Taw River Dairy
- Taw River Dairy - Overview
- Taw River Dairy - Product / Service
- Taw River Dairy - Key offerings
- SWOT
- 15.10 The a2 Milk Co. Ltd.
- The a2 Milk Co. Ltd. - Overview
- The a2 Milk Co. Ltd. - Product / Service
- The a2 Milk Co. Ltd. - Key offerings
- SWOT
- 15.11 Urban Farms Milk
- Urban Farms Milk - Overview
- Urban Farms Milk - Product / Service
- Urban Farms Milk - Key offerings
- SWOT
- 15.12 Vedaaz Organics Pvt. Ltd.
- Vedaaz Organics Pvt. Ltd. - Overview
- Vedaaz Organics Pvt. Ltd. - Product / Service
- Vedaaz Organics Pvt. Ltd. - Key offerings
- SWOT
- 15.13 VINAMILK Corp.
- VINAMILK Corp. - Overview
- VINAMILK Corp. - Product / Service
- VINAMILK Corp. - Key offerings
- SWOT
16 Appendix
- 16.2 Inclusions and exclusions checklist
- Inclusions checklist
- Exclusions checklist
- 16.3 Currency conversion rates for US$
- Currency conversion rates for US$
- 16.4 Research methodology
- 16.7 Validation techniques employed for market sizing
- Validation techniques employed for market sizing
- 16.9 360 degree market analysis
- 360 degree market analysis
- 16.10 List of abbreviations