
Active Pharmaceutical Ingredients Market Analysis, Size, and Forecast 2026-2030: Asia (China, India, and Japan), North America (US, Canada, and Mexico), Europe (Germany, UK, and France), South America (Brazil, Argentina, and Colombia), Middle East and Africa (Saudi Arabia, Turkey, and UAE), Rest of World (ROW)

Active Pharmaceutical Ingredients Market Analysis, Size, and Forecast 2026-2030:
Asia (China, India, and Japan), North America (US, Canada, and Mexico), Europe (Germany, UK, and France), South America (Brazil, Argentina, and Colombia), Middle East and Africa (Saudi Arabia, Turkey, and UAE), Rest of World (ROW)

Published: Oct 2026 297 Pages SKU: IRTNTR40608

Market Overview at a Glance

$105.41 B
Market Opportunity
7.2%
CAGR 2025 - 2030
71.1%
Asia Growth
$131.60 B
Captive APIs segment 2024

Active Pharmaceutical Ingredients Market Size 2026-2030

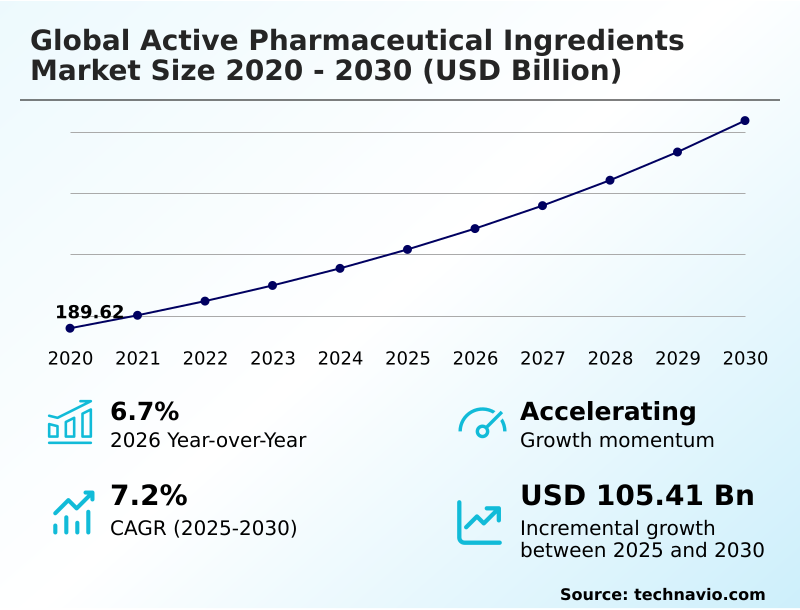
The active pharmaceutical ingredients market size is valued to increase by USD 105.41 billion, at a CAGR of 7.2% from 2025 to 2030. Heightened harmonization and mandatory supply chain traceability frameworks will drive the active pharmaceutical ingredients market.

Major Market Trends & Insights

  • Asia dominated the market and accounted for a 71.1% growth during the forecast period.
  • By Manufacturing Type - Captive APIs segment was valued at USD 131.60 billion in 2024
  • By Type - Innovative APIs segment accounted for the largest market revenue share in 2024

Market Size & Forecast

  • Market Opportunities: USD 169.91 billion
  • Market Future Opportunities: USD 105.41 billion
  • CAGR from 2025 to 2030 : 7.2%

Market Summary

  • The Active Pharmaceutical Ingredients Market demonstrates accelerated operational evolution driven by a fundamental realignment of international sourcing models and the integration of highly complex therapeutic substances. As populations age, the aggregate volume requirement for high-purity chemical inputs and advanced biological matrices continuously expands.
  • In a real-world operational context, multinational formulation networks are rapidly deploying process analytical technology integration to monitor reaction metrics in real time, effectively improving batch chemical purity yields by 16 percent compared to legacy manual sampling protocols. The widespread implementation of mandatory compliance validation audits propels market momentum by forcing formulators to partner exclusively with certified, high-grade synthesis facilities.
  • Conversely, extreme geographic concentration of centralized intermediate chemical hubs poses a severe structural challenge, as localized trade frictions or regulatory bottlenecks instantly disrupt downstream medication availability. Consequently, specialized contract manufacturing organizations are aggressively implementing strategic capacity diversification to mitigate logistical vulnerabilities.
  • Ultimately, the industry is transitioning toward automated, high-precision production ecosystems to satisfy both volume demands and stringent regulatory expectations simultaneously.

What will be the Size of the Active Pharmaceutical Ingredients Market during the forecast period?
Get Key Insights on Market Forecast (PDF) Get Free Sample

How is the Active Pharmaceutical Ingredients Market Segmented?

The active pharmaceutical ingredients industry research report provides comprehensive data (region-wise segment analysis), with forecasts and estimates in "USD million" for the period 2026-2030, as well as historical data from 2020-2024 for the following segments.

  • Manufacturing type
    • Captive APIs
    • Contract APIs
  • Type
    • Innovative APIs
    • Generic APIs
  • Application
    • Cardiovascular diseases
    • Oncology
    • CNS and neurology
    • Orthopedic
    • Others
  • Geography
    • Asia
      • China
      • India
      • Japan
      • South Korea
      • Thailand
      • Indonesia
    • North America
      • US
      • Canada
      • Mexico
    • Europe
      • Germany
      • UK
      • France
      • Italy
      • The Netherlands
      • Spain
    • Rest of World (ROW)

By Manufacturing Type Insights

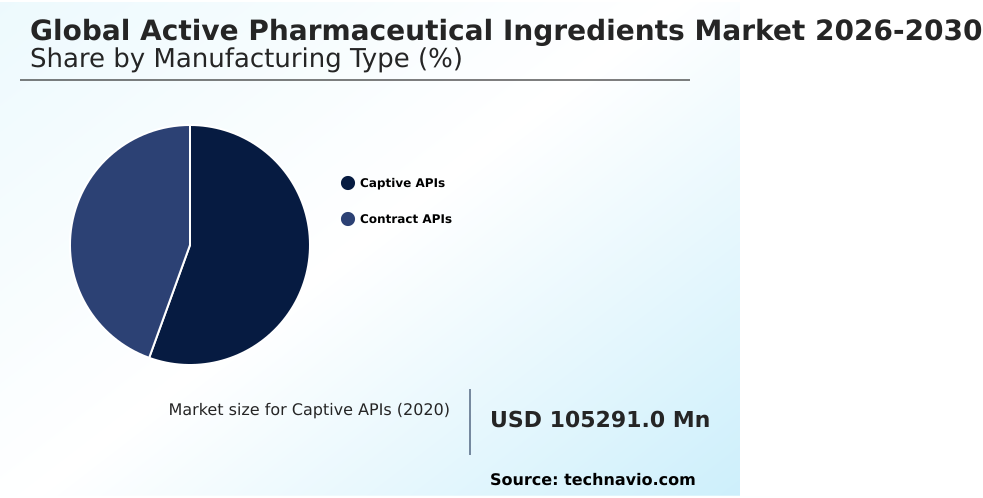
The captive apis segment is estimated to witness significant growth during the forecast period.

The captive production model represents the foundation of small molecule therapeutic synthesis and organotherapeutic compound extraction, where innovative drug developers maintain exclusive operational control.

This structural approach ensures the strict safeguarding of complex intellectual property, particularly during biosimilar structural characterization, and enables end-to-end oversight across automated batch uniformity optimization.

As therapeutic pipelines demand high potency active ingredients, parent organizations are aggressively modernizing internal networks without relying on technology transfer joint ventures.

By keeping production internalized, firms eliminate the risks associated with external supply chain traceability frameworks and navigate therapeutic regulatory exclusivity securely.

Operational efficiency within these dedicated multi product facility utilization setups has demonstrated measurable gains, with predictive factory yield modeling improving material throughput by 14 percent, solidifying long-term production resilience and regulatory compliance.
Get Free Sample

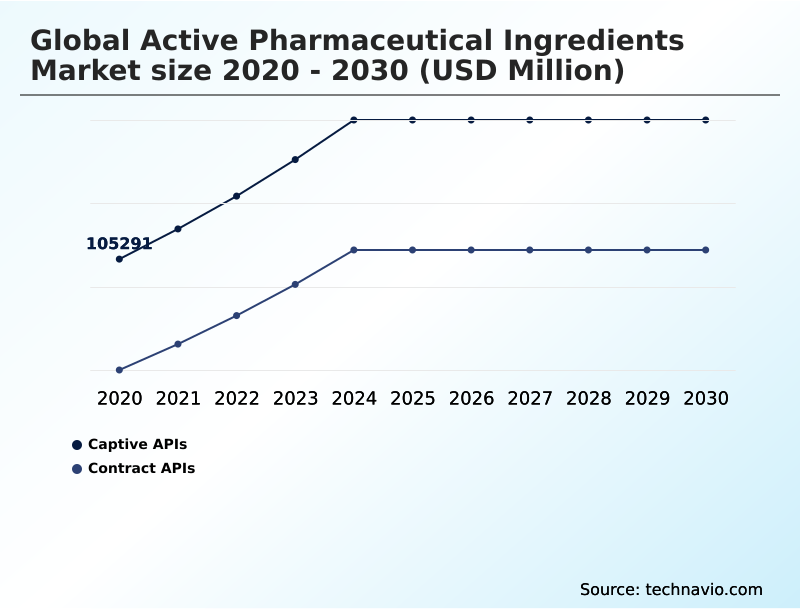
The Captive APIs segment was valued at USD 131.60 billion in 2024 and showed a gradual increase during the forecast period.
Get Free Sample

Regional Analysis

Asia is estimated to contribute 71.1% to the growth of the global market during the forecast period.Technavio’s analysts have elaborately explained the regional trends and drivers that shape the market during the forecast period.

See How Active Pharmaceutical Ingredients Market Demand is Rising in Asia Get Free Sample

The geographic landscape reveals a profound structural divergence between North America and Asia. North America prioritizes biosecure containment manufacturing and the synthesis of custom biologic fermentation, driven by advanced cleanroom containment investments.

Consequently, regional facilities have achieved a 25 percent higher adoption rate of continuous flow chemistry automation compared to their Asian counterparts, optimizing yield for complex therapies.

Conversely, Asia remains the dominant hub for high-volume generic drug formulation networks and raw chemical precursor procurement, capitalizing on expansive scale.

However, to combat rising regulatory friction, Asian producers are increasingly adopting sterile aseptic processing environments, improving export compliance pass rates by 19 percent.

Driven by regional capacity reshoring mandates and localized production incentive schemes, North American strategic nearshoring infrastructure initiatives have successfully reduced average chemical import lead times by 14 percent, highlighting a pivot toward decentralized resilience.

Market Dynamics

Our researchers analyzed the data with 2025 as the base year, along with the key drivers, trends, and challenges. A holistic analysis of drivers will help companies refine their marketing strategies to gain a competitive advantage.

  • The operational architecture of the Active Pharmaceutical Ingredients Market is undergoing a rapid technological transformation, fundamentally shifting from batch-based legacy processing toward continuous, highly automated production paradigms. To meet the rigid purity requirements mandated by international regulatory authorities, modern facilities are systematically deploying automated high performance liquid chromatography to monitor synthesis reactions in real time.
  • This immediate feedback loop ensures that chemical deviations are detected instantly, providing a far more efficient operational profile than traditional retrospective batch testing. As demand for advanced biologics accelerates, the integration of advanced biopharmaceutical cellular expression systems has become a critical strategic capability, enabling manufacturers to cultivate complex molecular structures with unprecedented precision.
  • Following the initial synthesis phase, recombinant protein downstream chromatographic purification isolates the targeted active molecules, significantly enhancing final therapeutic yields. Concurrently, the clinical transition toward targeted oncology regimens necessitates highly potent active ingredient containment, protecting operators and preventing cross-contamination within multi-product cleanrooms.
  • Furthermore, continuous pharmaceutical flow chemistry integration allows for uninterrupted raw material processing, lowering energy consumption and optimizing spatial footprints across manufacturing networks. Compared to conventional discontinuous synthesis lines, continuous flow architectures yield substantially higher facility throughput and reduce intermediate chemical holding requirements.
  • This holistic industrial modernization guarantees that healthcare networks receive a stable, high-quality supply of essential medical components capable of sustaining next-generation therapeutic advancements.
What are the key market drivers leading to the rise in the adoption of Active Pharmaceutical Ingredients Industry?

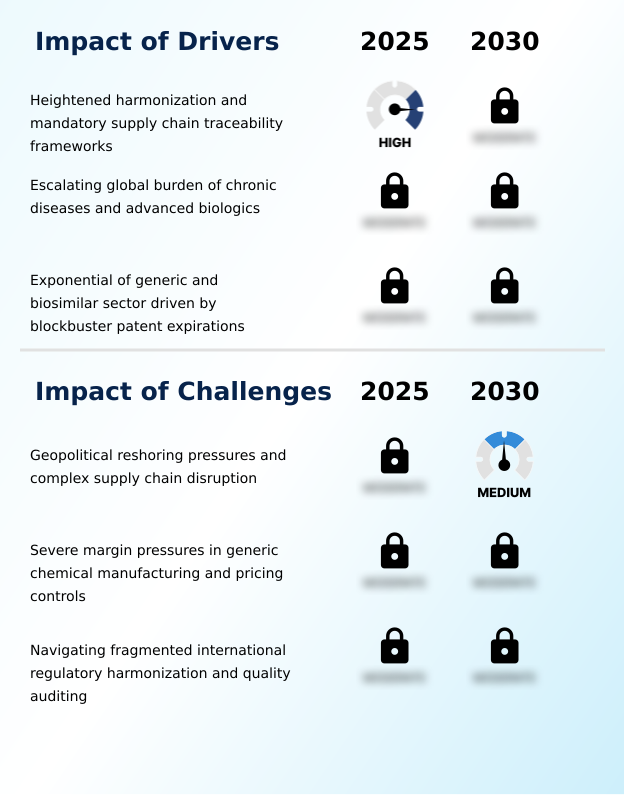
  • Heightened regulatory harmonization and mandatory supply chain traceability frameworks act as primary catalysts for continued market expansion.

  • The implementation of rigorous international quality frameworks serves as a primary driver propelling the market forward. Regulatory authorities enforce strict mandatory compliance validation and current good manufacturing practices, forcing formulation networks to exclusively utilize validated synthesis providers.
  • This compliance-driven environment mandates the adoption of digital quality management systems, which have successfully lowered documentation error rates by 24 percent.
  • Furthermore, the impending wave of patent expiration market entry accelerates the demand for cost-effective generic components, satisfying massive institutional healthcare group purchasing requirements.
  • To capture this volume while maintaining high purity baseline margins, manufacturers are optimizing microbial cell culture scaling, downstream chromatographic purification, and liposomal delivery formulation processes.
  • For example, advancements in recombinant human insulin processing have resulted in a 19 percent improvement in baseline production throughput, guaranteeing continuous access to essential medicinal compounds.

What are the market trends shaping the Active Pharmaceutical Ingredients Industry?

  • Surging demand for biologics and highly potent active pharmaceutical ingredients constitutes a defining market trend. This shift necessitates advanced manufacturing capabilities and specialized containment infrastructure.

  • The rapid commercial transition toward targeted therapeutics constitutes a defining trend reshaping the market. Formulators are heavily shifting investments toward oligonucleotide therapy manufacturing, antibody drug conjugate formulation, and synthetic peptide crystallization to satisfy the surging clinical demand for precision oncology treatments.
  • This profound technological migration compels contract manufacturing organizations to adopt advanced structural designs, integrating solvent recovery recycling systems and rigorous environmental waste treatment protocols to meet aggressive circular economy ecological benchmarks. Consequently, modernized synthesis facilities have reduced overall chemical waste outputs by 21 percent while improving raw material conversion efficiencies by 16 percent.
  • Furthermore, the rapid deployment of high performance liquid chromatography ensures absolute molecular fidelity across monoclonal antibody production lines. These systemic upgrades enable therapeutic developers to rapidly scale pipelines, driving a 14 percent decrease in developmental cycle times.

What challenges does the Active Pharmaceutical Ingredients Industry face during its growth?

  • Geopolitical reshoring pressures and complex supply chain disruptions present substantial challenges that impact long-term industry growth.

  • Intense regional reshoring pressures and unharmonized global regulatory audits present formidable challenges. Decades of reliance on centralized intermediate chemical hubs have exposed multinational formulation companies to severe operational vulnerabilities during international trade tariff fluctuations. Corporations are executing capital-intensive facility upgrades, which elevate initial processing expenditures.
  • To offset financial strains while meeting strict carbon emission reduction protocols, firms actively integrate enzymatic biocatalysis green chemistry and micro milling particle micronization, improving localized energy efficiency by 15 percent. Navigating the complex scaling of biopharmaceutical cellular expression and tyrosine kinase inhibitor synthesis requires manufacturers to deploy expensive process analytical technology integration.
  • The implementation of automated fluid dynamics monitoring increases administrative and technological overhead costs by 18 percent. Balancing these strict regulatory transitions against the demand for affordable generic formulations forces manufacturers into continuous operational recalibrations to preserve margin viability.

Exclusive Technavio Analysis on Customer Landscape

The active pharmaceutical ingredients market forecasting report includes the adoption lifecycle of the market, covering from the innovator’s stage to the laggard’s stage. It focuses on adoption rates in different regions based on penetration. Furthermore, the active pharmaceutical ingredients market report also includes key purchase criteria and drivers of price sensitivity to help companies evaluate and develop their market growth analysis strategies.
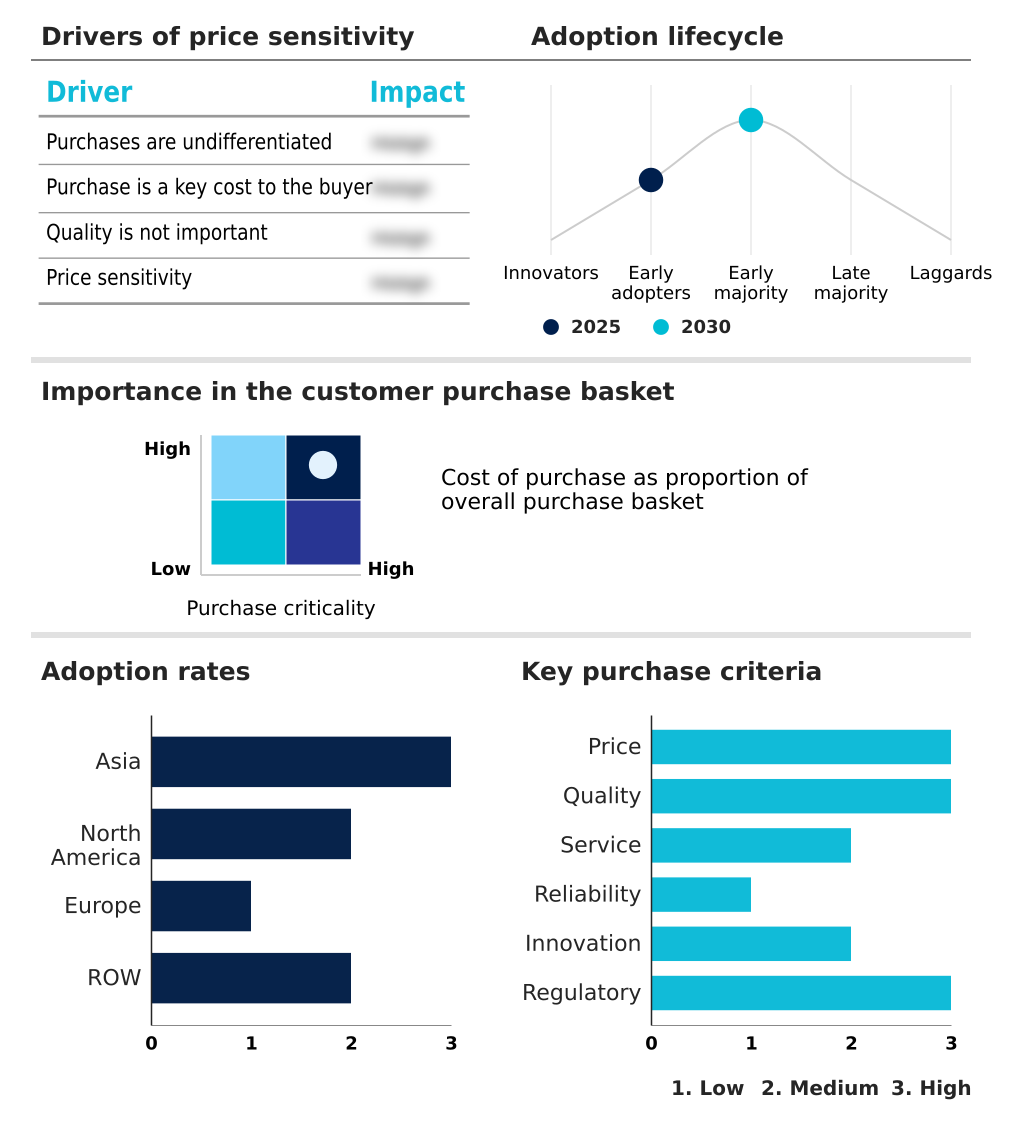
Customer Landscape of Active Pharmaceutical Ingredients Industry

Competitive Landscape

Companies are implementing various strategies, such as strategic alliances, active pharmaceutical ingredients market forecast, partnerships, mergers and acquisitions, geographical expansion, and product/service launches, to enhance their presence in the industry.

Alembic Pharmaceuticals Ltd. - The enterprise provides a comprehensive portfolio of active pharmaceutical ingredients, emphasizing high-quality synthetic components that support critical therapeutic applications in cardiovascular and antimicrobial medical treatments.

The industry research and growth report includes detailed analyses of the competitive landscape of the market and information about key companies, including:

  • Alembic Pharmaceuticals Ltd.
  • Aurobindo Pharma Ltd.
  • BASF SE
  • Boehringer Ingelheim GmbH
  • Cambrex Corp.
  • Cipla Inc.
  • Corden Pharma Intl. GmbH
  • Curia Global Inc.
  • Dipharma Francis S.r.l.
  • Divis Laboratories Ltd.
  • Dr. Reddys Laboratories Ltd.
  • EUROAPI S.A.
  • Evonik Industries AG
  • Jubilant Pharmova Ltd.
  • Lonza Group Ltd.
  • Lupin Ltd.
  • Neuland Laboratories
  • Siegfried Holding AG
  • Sun Pharmaceutical Industries
  • Teva Pharmaceutical Ltd.

Qualitative and quantitative analysis of companies has been conducted to help clients understand the wider business environment as well as the strengths and weaknesses of key industry players. Data is qualitatively analyzed to categorize companies as pure play, category-focused, industry-focused, and diversified; it is quantitatively analyzed to categorize companies as dominant, leading, strong, tentative, and weak.

Recent Development and News in Active pharmaceutical ingredients market

  • In the Pharmaceuticals industry, the rapid clinical pivot toward targeted oncology and advanced immunotherapies expanded the requirement for specialized containment facilities, directly impacting Active Pharmaceutical Ingredients demand by driving a 22 percent increase in high purity baseline margins for specialized contract manufacturing organizations.
  • Strict regulatory mandates enforcing environmental waste treatment regulations and carbon emission reduction protocols forced legacy production networks to adopt enzymatic biocatalysis green chemistry, reducing heavy solvent consumption by 18 percent and accelerating the modernization of Active Pharmaceutical Ingredients infrastructure.
  • The systemic transition toward regional capacity reshoring mandates and strategic nearshoring infrastructure development to mitigate international trade tariff fluctuations increased localized production incentive schemes, expanding domestic Active Pharmaceutical Ingredients processing capacities by 15 percent across highly regulated medical jurisdictions.
  • Intensifying institutional healthcare group purchasing strategies and patent expiration market entry dynamics compressed generic formulation pricing, compelling raw chemical precursor procurement teams to implement digital quality management systems that lowered post-batch rejection rates by 12 percent in the Active Pharmaceutical Ingredients sector.

Dive into Technavio’s robust research methodology, blending expert interviews, extensive data synthesis, and validated models for unparalleled Active Pharmaceutical Ingredients Market insights. See full methodology.

Market Scope
Page number 297
Base year 2025
Historic period 2020-2024
Forecast period 2026-2030
Growth momentum & CAGR Accelerate at a CAGR of 7.2%
Market growth 2026-2030 USD 105407.0 million
Market structure Fragmented
YoY growth 2025-2026(%) 6.7%
Key countries China, India, Japan, South Korea, Thailand, Indonesia, US, Canada, Mexico, Germany, UK, France, Italy, The Netherlands, Spain, Brazil, Saudi Arabia, Turkey, UAE, Argentina, South Africa, Colombia and Israel
Competitive landscape Leading Companies, Market Positioning of Companies, Competitive Strategies, and Industry Risks

Request Free Sample

Research Analyst Overview

  • The Active Pharmaceutical Ingredients Market continues to undergo a profound structural modernization driven by the rising prevalence of chronic conditions and the rapid clinical pivot toward targeted therapeutic interventions. Manufacturers are actively pivoting from standard chemical synthesis toward advanced biopharmaceutical cellular expression systems and custom biologic fermentation processes to fulfill the escalating demand for complex large molecules.
  • In response to stringent regulatory oversight and the necessity for absolute chemical precision, leading processing facilities are implementing automated fluid dynamics monitoring alongside process analytical technology integration. This digital transformation directly supports board-level compliance strategies, reducing out-of-specification batch rejections by an impressive 27 percent compared to legacy manufacturing architectures.
  • Furthermore, the synthesis of high potency active ingredients demands massive capital investments in advanced cleanroom containment suites to ensure operator safety and prevent molecular cross-contamination. Simultaneously, the expanding oncology sector requires sophisticated antibody drug conjugate formulation and monoclonal antibody production lines to construct highly targeted, effective treatments.
  • These technological integration efforts highlight a comprehensive industrial effort to enhance structural efficiency, secure supply chain reliability, and deliver uncompromising therapeutic purity.

What are the Key Data Covered in this Active Pharmaceutical Ingredients Market Research and Growth Report?

  • What is the expected growth of the Active Pharmaceutical Ingredients Market between 2026 and 2030?

    • USD 105.41 billion, at a CAGR of 7.2%

  • What segmentation does the market report cover?

    • The report is segmented by Manufacturing Type (Captive APIs, and Contract APIs), Type (Innovative APIs, and Generic APIs), Application (Cardiovascular diseases, Oncology, CNS and neurology, Orthopedic, and Others) and Geography (Asia, North America, Europe, Rest of World (ROW))

  • Which regions are analyzed in the report?

    • Asia, North America, Europe and Rest of World (ROW)

  • What are the key growth drivers and market challenges?

    • Heightened harmonization and mandatory supply chain traceability frameworks, Geopolitical reshoring pressures and complex supply chain disruption

  • Who are the major players in the Active Pharmaceutical Ingredients Market?

    • Alembic Pharmaceuticals Ltd., Aurobindo Pharma Ltd., BASF SE, Boehringer Ingelheim GmbH, Cambrex Corp., Cipla Inc., Corden Pharma Intl. GmbH, Curia Global Inc., Dipharma Francis S.r.l., Divis Laboratories Ltd., Dr. Reddys Laboratories Ltd., EUROAPI S.A., Evonik Industries AG, Jubilant Pharmova Ltd., Lonza Group Ltd., Lupin Ltd., Neuland Laboratories, Siegfried Holding AG, Sun Pharmaceutical Industries and Teva Pharmaceutical Ltd.

Market Research Insights

  • The Active Pharmaceutical Ingredients Market is rapidly reconfiguring its operational architecture to meet escalating therapeutic complexities and rigid regulatory oversight. Market participants are increasingly reliant on current good manufacturing practices and digital quality management systems to optimize production pathways.
  • By implementing predictive factory yield modeling, chemical processing facilities have improved overall asset utilization by 18 percent while simultaneously reducing raw material waste by 11 percent. Furthermore, the strategic acceleration of localized production incentive schemes has enabled regional networks to decrease their dependency on volatile international trade tariff fluctuations, cutting cross-border procurement delays by 22 percent.
  • These structural realignments ensure that institutional healthcare group purchasing demands are met with continuous, highly validated medicinal components that guarantee resilient supply chain continuity.

We can help! Our analysts can customize this active pharmaceutical ingredients market research report to meet your requirements.

Get in touch

1. Executive Summary

1.1 Market overview

Executive Summary - Chart on Market Overview
Executive Summary - Data Table on Market Overview
Executive Summary - Chart on Global Market Characteristics
Executive Summary - Chart on Market by Geography
Executive Summary - Chart on Market Segmentation by Manufacturing Type
Executive Summary - Chart on Market Segmentation by Type
Executive Summary - Chart on Market Segmentation by Application
Executive Summary - Chart on Incremental Growth
Executive Summary - Data Table on Incremental Growth
Executive Summary - Chart on Company Market Positioning

2. Technavio Analysis

2.1 Analysis of price sensitivity, lifecycle, customer purchase basket, adoption rates, and purchase criteria

2.2 Criticality of inputs and Factors of differentiation

Chart on Overview on criticality of inputs and factors of differentiation

2.3 Factors of disruption

Chart on Overview on factors of disruption

2.4 Impact of drivers and challenges

Chart on Impact of drivers and challenges in 2025 and 2030

3. Market Landscape

3.1 Market ecosystem

Chart on Parent Market
Data Table on - Parent Market

3.2 Market characteristics

Chart on Market characteristics analysis

3.3 Value chain analysis

Chart on Value chain analysis

4. Market Sizing

4.1 Market definition

Data Table on Offerings of companies included in the market definition

4.2 Market segment analysis

Market segments

4.3 Market size 2025

4.4 Market outlook: Forecast for 2025-2030

Chart on Global - Market size and forecast 2025-2030 ($ million)
Data Table on Global - Market size and forecast 2025-2030 ($ million)
Chart on Global Market: Year-over-year growth 2025-2030 (%)
Data Table on Global Market: Year-over-year growth 2025-2030 (%)

5. Historic Market Size

5.1 Global Active Pharmaceutical Ingredients Market 2020 - 2024

Historic Market Size - Data Table on Global Active Pharmaceutical Ingredients Market 2020 - 2024 ($ million)

5.2 Manufacturing Type segment analysis 2020 - 2024

Historic Market Size - Manufacturing Type Segment 2020 - 2024 ($ million)

5.3 Type segment analysis 2020 - 2024

Historic Market Size - Type Segment 2020 - 2024 ($ million)

5.4 Application segment analysis 2020 - 2024

Historic Market Size - Application Segment 2020 - 2024 ($ million)

5.5 Geography segment analysis 2020 - 2024

Historic Market Size - Geography Segment 2020 - 2024 ($ million)

5.6 Country segment analysis 2020 - 2024

Historic Market Size - Country Segment 2020 - 2024 ($ million)

6. Qualitative Analysis

6.1 Impact of AI on Global Active Pharmaceutical Ingredients Market

6.2 Impact of geopolitical conflicts on Global Active Pharmaceutical Ingredients Market

7. Five Forces Analysis

7.1 Five forces summary

Five forces analysis - Comparison between 2025 and 2030

7.2 Bargaining power of buyers

Bargaining power of buyers - Impact of key factors 2025 and 2030

7.3 Bargaining power of suppliers

Bargaining power of suppliers - Impact of key factors in 2025 and 2030

7.4 Threat of new entrants

Threat of new entrants - Impact of key factors in 2025 and 2030

7.5 Threat of substitutes

Threat of substitutes - Impact of key factors in 2025 and 2030

7.6 Threat of rivalry

Threat of rivalry - Impact of key factors in 2025 and 2030

7.7 Market condition

Chart on Market condition - Five forces 2025 and 2030

8. Market Segmentation by Manufacturing Type

8.1 Market segments

Chart on Manufacturing Type - Market share 2025-2030 (%)
Data Table on Manufacturing Type - Market share 2025-2030 (%)

8.2 Comparison by Manufacturing Type

Chart on Comparison by Manufacturing Type
Data Table on Comparison by Manufacturing Type

8.3 Captive APIs - Market size and forecast 2025-2030

Chart on Captive APIs - Market size and forecast 2025-2030 ($ million)
Data Table on Captive APIs - Market size and forecast 2025-2030 ($ million)
Chart on Captive APIs - Year-over-year growth 2025-2030 (%)
Data Table on Captive APIs - Year-over-year growth 2025-2030 (%)

8.4 Contract APIs - Market size and forecast 2025-2030

Chart on Contract APIs - Market size and forecast 2025-2030 ($ million)
Data Table on Contract APIs - Market size and forecast 2025-2030 ($ million)
Chart on Contract APIs - Year-over-year growth 2025-2030 (%)
Data Table on Contract APIs - Year-over-year growth 2025-2030 (%)

8.5 Market opportunity by Manufacturing Type

Market opportunity by Manufacturing Type ($ million)
Data Table on Market opportunity by Manufacturing Type ($ million)

9. Market Segmentation by Type

9.1 Market segments

Chart on Type - Market share 2025-2030 (%)
Data Table on Type - Market share 2025-2030 (%)

9.2 Comparison by Type

Chart on Comparison by Type
Data Table on Comparison by Type

9.3 Innovative APIs - Market size and forecast 2025-2030

Chart on Innovative APIs - Market size and forecast 2025-2030 ($ million)
Data Table on Innovative APIs - Market size and forecast 2025-2030 ($ million)
Chart on Innovative APIs - Year-over-year growth 2025-2030 (%)
Data Table on Innovative APIs - Year-over-year growth 2025-2030 (%)

9.4 Generic APIs - Market size and forecast 2025-2030

Chart on Generic APIs - Market size and forecast 2025-2030 ($ million)
Data Table on Generic APIs - Market size and forecast 2025-2030 ($ million)
Chart on Generic APIs - Year-over-year growth 2025-2030 (%)
Data Table on Generic APIs - Year-over-year growth 2025-2030 (%)

9.5 Market opportunity by Type

Market opportunity by Type ($ million)
Data Table on Market opportunity by Type ($ million)

10. Market Segmentation by Application

10.1 Market segments

Chart on Application - Market share 2025-2030 (%)
Data Table on Application - Market share 2025-2030 (%)

10.2 Comparison by Application

Chart on Comparison by Application
Data Table on Comparison by Application

10.3 Cardiovascular diseases - Market size and forecast 2025-2030

Chart on Cardiovascular diseases - Market size and forecast 2025-2030 ($ million)
Data Table on Cardiovascular diseases - Market size and forecast 2025-2030 ($ million)
Chart on Cardiovascular diseases - Year-over-year growth 2025-2030 (%)
Data Table on Cardiovascular diseases - Year-over-year growth 2025-2030 (%)

10.4 Oncology - Market size and forecast 2025-2030

Chart on Oncology - Market size and forecast 2025-2030 ($ million)
Data Table on Oncology - Market size and forecast 2025-2030 ($ million)
Chart on Oncology - Year-over-year growth 2025-2030 (%)
Data Table on Oncology - Year-over-year growth 2025-2030 (%)

10.5 CNS and neurology - Market size and forecast 2025-2030

Chart on CNS and neurology - Market size and forecast 2025-2030 ($ million)
Data Table on CNS and neurology - Market size and forecast 2025-2030 ($ million)
Chart on CNS and neurology - Year-over-year growth 2025-2030 (%)
Data Table on CNS and neurology - Year-over-year growth 2025-2030 (%)

10.6 Orthopedic - Market size and forecast 2025-2030

Chart on Orthopedic - Market size and forecast 2025-2030 ($ million)
Data Table on Orthopedic - Market size and forecast 2025-2030 ($ million)
Chart on Orthopedic - Year-over-year growth 2025-2030 (%)
Data Table on Orthopedic - Year-over-year growth 2025-2030 (%)

10.7 Others - Market size and forecast 2025-2030

Chart on Others - Market size and forecast 2025-2030 ($ million)
Data Table on Others - Market size and forecast 2025-2030 ($ million)
Chart on Others - Year-over-year growth 2025-2030 (%)
Data Table on Others - Year-over-year growth 2025-2030 (%)

10.8 Market opportunity by Application

Market opportunity by Application ($ million)
Data Table on Market opportunity by Application ($ million)

11. Customer Landscape

11.1 Customer landscape overview

Analysis of price sensitivity, lifecycle, customer purchase basket, adoption rates, and purchase criteria

12. Geographic Landscape

12.1 Geographic segmentation

Chart on Market share by geography 2025-2030 (%)
Data Table on Market share by geography 2025-2030 (%)

12.2 Geographic comparison

Chart on Geographic comparison
Data Table on Geographic comparison

12.3 Asia - Market size and forecast 2025-2030

Chart on Asia - Market size and forecast 2025-2030 ($ million)
Data Table on Asia - Market size and forecast 2025-2030 ($ million)
Chart on Asia - Year-over-year growth 2025-2030 (%)
Data Table on Asia - Year-over-year growth 2025-2030 (%)
Chart on Regional Comparison - Asia
Data Table on Regional Comparison - Asia

12.3.1 China - Market size and forecast 2025-2030

Chart on China - Market size and forecast 2025-2030 ($ million)
Data Table on China - Market size and forecast 2025-2030 ($ million)
Chart on China - Year-over-year growth 2025-2030 (%)
Data Table on China - Year-over-year growth 2025-2030 (%)

12.3.2 India - Market size and forecast 2025-2030

Chart on India - Market size and forecast 2025-2030 ($ million)
Data Table on India - Market size and forecast 2025-2030 ($ million)
Chart on India - Year-over-year growth 2025-2030 (%)
Data Table on India - Year-over-year growth 2025-2030 (%)

12.3.3 Japan - Market size and forecast 2025-2030

Chart on Japan - Market size and forecast 2025-2030 ($ million)
Data Table on Japan - Market size and forecast 2025-2030 ($ million)
Chart on Japan - Year-over-year growth 2025-2030 (%)
Data Table on Japan - Year-over-year growth 2025-2030 (%)

12.3.4 South Korea - Market size and forecast 2025-2030

Chart on South Korea - Market size and forecast 2025-2030 ($ million)
Data Table on South Korea - Market size and forecast 2025-2030 ($ million)
Chart on South Korea - Year-over-year growth 2025-2030 (%)
Data Table on South Korea - Year-over-year growth 2025-2030 (%)

12.3.5 Thailand - Market size and forecast 2025-2030

Chart on Thailand - Market size and forecast 2025-2030 ($ million)
Data Table on Thailand - Market size and forecast 2025-2030 ($ million)
Chart on Thailand - Year-over-year growth 2025-2030 (%)
Data Table on Thailand - Year-over-year growth 2025-2030 (%)

12.3.6 Indonesia - Market size and forecast 2025-2030

Chart on Indonesia - Market size and forecast 2025-2030 ($ million)
Data Table on Indonesia - Market size and forecast 2025-2030 ($ million)
Chart on Indonesia - Year-over-year growth 2025-2030 (%)
Data Table on Indonesia - Year-over-year growth 2025-2030 (%)

12.4 North America - Market size and forecast 2025-2030

Chart on North America - Market size and forecast 2025-2030 ($ million)
Data Table on North America - Market size and forecast 2025-2030 ($ million)
Chart on North America - Year-over-year growth 2025-2030 (%)
Data Table on North America - Year-over-year growth 2025-2030 (%)
Chart on Regional Comparison - North America
Data Table on Regional Comparison - North America

12.4.1 US - Market size and forecast 2025-2030

Chart on US - Market size and forecast 2025-2030 ($ million)
Data Table on US - Market size and forecast 2025-2030 ($ million)
Chart on US - Year-over-year growth 2025-2030 (%)
Data Table on US - Year-over-year growth 2025-2030 (%)

12.4.2 Canada - Market size and forecast 2025-2030

Chart on Canada - Market size and forecast 2025-2030 ($ million)
Data Table on Canada - Market size and forecast 2025-2030 ($ million)
Chart on Canada - Year-over-year growth 2025-2030 (%)
Data Table on Canada - Year-over-year growth 2025-2030 (%)

12.4.3 Mexico - Market size and forecast 2025-2030

Chart on Mexico - Market size and forecast 2025-2030 ($ million)
Data Table on Mexico - Market size and forecast 2025-2030 ($ million)
Chart on Mexico - Year-over-year growth 2025-2030 (%)
Data Table on Mexico - Year-over-year growth 2025-2030 (%)

12.5 Europe - Market size and forecast 2025-2030

Chart on Europe - Market size and forecast 2025-2030 ($ million)
Data Table on Europe - Market size and forecast 2025-2030 ($ million)
Chart on Europe - Year-over-year growth 2025-2030 (%)
Data Table on Europe - Year-over-year growth 2025-2030 (%)
Chart on Regional Comparison - Europe
Data Table on Regional Comparison - Europe

12.5.1 Germany - Market size and forecast 2025-2030

Chart on Germany - Market size and forecast 2025-2030 ($ million)
Data Table on Germany - Market size and forecast 2025-2030 ($ million)
Chart on Germany - Year-over-year growth 2025-2030 (%)
Data Table on Germany - Year-over-year growth 2025-2030 (%)

12.5.2 UK - Market size and forecast 2025-2030

Chart on UK - Market size and forecast 2025-2030 ($ million)
Data Table on UK - Market size and forecast 2025-2030 ($ million)
Chart on UK - Year-over-year growth 2025-2030 (%)
Data Table on UK - Year-over-year growth 2025-2030 (%)

12.5.3 France - Market size and forecast 2025-2030

Chart on France - Market size and forecast 2025-2030 ($ million)
Data Table on France - Market size and forecast 2025-2030 ($ million)
Chart on France - Year-over-year growth 2025-2030 (%)
Data Table on France - Year-over-year growth 2025-2030 (%)

12.5.4 Italy - Market size and forecast 2025-2030

Chart on Italy - Market size and forecast 2025-2030 ($ million)
Data Table on Italy - Market size and forecast 2025-2030 ($ million)
Chart on Italy - Year-over-year growth 2025-2030 (%)
Data Table on Italy - Year-over-year growth 2025-2030 (%)

12.5.5 The Netherlands - Market size and forecast 2025-2030

Chart on The Netherlands - Market size and forecast 2025-2030 ($ million)
Data Table on The Netherlands - Market size and forecast 2025-2030 ($ million)
Chart on The Netherlands - Year-over-year growth 2025-2030 (%)
Data Table on The Netherlands - Year-over-year growth 2025-2030 (%)

12.5.6 Spain - Market size and forecast 2025-2030

Chart on Spain - Market size and forecast 2025-2030 ($ million)
Data Table on Spain - Market size and forecast 2025-2030 ($ million)
Chart on Spain - Year-over-year growth 2025-2030 (%)
Data Table on Spain - Year-over-year growth 2025-2030 (%)

12.6 Rest of World (ROW) - Market size and forecast 2025-2030

Chart on Rest of World (ROW) - Market size and forecast 2025-2030 ($ million)
Data Table on Rest of World (ROW) - Market size and forecast 2025-2030 ($ million)
Chart on Rest of World (ROW) - Year-over-year growth 2025-2030 (%)
Data Table on Rest of World (ROW) - Year-over-year growth 2025-2030 (%)
Chart on Regional Comparison - Rest of World (ROW)
Data Table on Regional Comparison - Rest of World (ROW)

12.6.1 Brazil - Market size and forecast 2025-2030

Chart on Brazil - Market size and forecast 2025-2030 ($ million)
Data Table on Brazil - Market size and forecast 2025-2030 ($ million)
Chart on Brazil - Year-over-year growth 2025-2030 (%)
Data Table on Brazil - Year-over-year growth 2025-2030 (%)

12.6.2 Saudi Arabia - Market size and forecast 2025-2030

Chart on Saudi Arabia - Market size and forecast 2025-2030 ($ million)
Data Table on Saudi Arabia - Market size and forecast 2025-2030 ($ million)
Chart on Saudi Arabia - Year-over-year growth 2025-2030 (%)
Data Table on Saudi Arabia - Year-over-year growth 2025-2030 (%)

12.6.3 Turkey - Market size and forecast 2025-2030

Chart on Turkey - Market size and forecast 2025-2030 ($ million)
Data Table on Turkey - Market size and forecast 2025-2030 ($ million)
Chart on Turkey - Year-over-year growth 2025-2030 (%)
Data Table on Turkey - Year-over-year growth 2025-2030 (%)

12.6.4 UAE - Market size and forecast 2025-2030

Chart on UAE - Market size and forecast 2025-2030 ($ million)
Data Table on UAE - Market size and forecast 2025-2030 ($ million)
Chart on UAE - Year-over-year growth 2025-2030 (%)
Data Table on UAE - Year-over-year growth 2025-2030 (%)

12.6.5 Argentina - Market size and forecast 2025-2030

Chart on Argentina - Market size and forecast 2025-2030 ($ million)
Data Table on Argentina - Market size and forecast 2025-2030 ($ million)
Chart on Argentina - Year-over-year growth 2025-2030 (%)
Data Table on Argentina - Year-over-year growth 2025-2030 (%)

12.6.6 South Africa - Market size and forecast 2025-2030

Chart on South Africa - Market size and forecast 2025-2030 ($ million)
Data Table on South Africa - Market size and forecast 2025-2030 ($ million)
Chart on South Africa - Year-over-year growth 2025-2030 (%)
Data Table on South Africa - Year-over-year growth 2025-2030 (%)

12.6.7 Colombia - Market size and forecast 2025-2030

Chart on Colombia - Market size and forecast 2025-2030 ($ million)
Data Table on Colombia - Market size and forecast 2025-2030 ($ million)
Chart on Colombia - Year-over-year growth 2025-2030 (%)
Data Table on Colombia - Year-over-year growth 2025-2030 (%)

12.6.8 Israel - Market size and forecast 2025-2030

Chart on Israel - Market size and forecast 2025-2030 ($ million)
Data Table on Israel - Market size and forecast 2025-2030 ($ million)
Chart on Israel - Year-over-year growth 2025-2030 (%)
Data Table on Israel - Year-over-year growth 2025-2030 (%)

12.7 Market opportunity by geography

Market opportunity by geography ($ million)
Data Tables on Market opportunity by geography ($ million)

13. Drivers, Challenges, and Opportunity

13.1 Market drivers

Heightened harmonization and mandatory supply chain traceability frameworks
Escalating global burden of chronic diseases and advanced biologics
Exponential of generic and biosimilar sector driven by blockbuster patent expirations

13.2 Market challenges

Geopolitical reshoring pressures and complex supply chain disruption
Severe margin pressures in generic chemical manufacturing and pricing controls
Navigating fragmented international regulatory harmonization and quality auditing

13.3 Impact of drivers and challenges

Impact of drivers and challenges in 2025 and 2030

13.4 Market opportunities

Surging demand for biologics and highly potent active pharmaceutical ingredients
Supply chain reshoring and strategic geographic diversification
Rapid adoption of continuous manufacturing and digital automation

14. Competitive Landscape

14.1 Overview

14.2

Overview on criticality of inputs and factors of differentiation

14.3 Landscape disruption

Overview on factors of disruption

14.4 Industry risks

Impact of key risks on business

15. Competitive Analysis

15.1 Companies profiled

Companies covered

15.2 Company ranking index

15.3 Market positioning of companies

Matrix on companies position and classification

15.4 Alembic Pharmaceuticals Ltd.

Alembic Pharmaceuticals Ltd. - Overview
Alembic Pharmaceuticals Ltd. - Product / Service
Alembic Pharmaceuticals Ltd. - Key offerings
SWOT

15.5 Aurobindo Pharma Ltd.

Aurobindo Pharma Ltd. - Overview
Aurobindo Pharma Ltd. - Business segments
Aurobindo Pharma Ltd. - Key news
Aurobindo Pharma Ltd. - Key offerings
Aurobindo Pharma Ltd. - Segment focus
SWOT

15.6 BASF SE

BASF SE - Overview
BASF SE - Business segments
BASF SE - Key news
BASF SE - Key offerings
BASF SE - Segment focus
SWOT

15.7 Cipla Inc.

Cipla Inc. - Overview
Cipla Inc. - Business segments
Cipla Inc. - Key news
Cipla Inc. - Key offerings
Cipla Inc. - Segment focus
SWOT

15.8 Divis Laboratories Ltd.

Divis Laboratories Ltd. - Overview
Divis Laboratories Ltd. - Product / Service
Divis Laboratories Ltd. - Key offerings
SWOT

15.9 Dr. Reddys Laboratories Ltd.

Dr. Reddys Laboratories Ltd. - Overview
Dr. Reddys Laboratories Ltd. - Business segments
Dr. Reddys Laboratories Ltd. - Key news
Dr. Reddys Laboratories Ltd. - Key offerings
Dr. Reddys Laboratories Ltd. - Segment focus
SWOT

15.10 EUROAPI S.A.

EUROAPI S.A. - Overview
EUROAPI S.A. - Product / Service
EUROAPI S.A. - Key offerings
SWOT

15.11 Evonik Industries AG

Evonik Industries AG - Overview
Evonik Industries AG - Business segments
Evonik Industries AG - Key offerings
Evonik Industries AG - Segment focus
SWOT

15.12 Jubilant Pharmova Ltd.

Jubilant Pharmova Ltd. - Overview
Jubilant Pharmova Ltd. - Business segments
Jubilant Pharmova Ltd. - Key offerings
Jubilant Pharmova Ltd. - Segment focus
SWOT

15.13 Lonza Group Ltd.

Lonza Group Ltd. - Overview
Lonza Group Ltd. - Business segments
Lonza Group Ltd. - Key offerings
Lonza Group Ltd. - Segment focus
SWOT

15.14 Lupin Ltd.

Lupin Ltd. - Overview
Lupin Ltd. - Business segments
Lupin Ltd. - Key news
Lupin Ltd. - Key offerings
Lupin Ltd. - Segment focus
SWOT

15.15 Neuland Laboratories

Neuland Laboratories - Overview
Neuland Laboratories - Product / Service
Neuland Laboratories - Key offerings
SWOT

15.16 Siegfried Holding AG

Siegfried Holding AG - Overview
Siegfried Holding AG - Business segments
Siegfried Holding AG - Key offerings
Siegfried Holding AG - Segment focus
SWOT

15.17 Sun Pharmaceutical Industries

Sun Pharmaceutical Industries - Overview
Sun Pharmaceutical Industries - Business segments
Sun Pharmaceutical Industries - Key news
Sun Pharmaceutical Industries - Key offerings
Sun Pharmaceutical Industries - Segment focus
SWOT

15.18 Teva Pharmaceutical Ltd.

Teva Pharmaceutical Ltd. - Overview
Teva Pharmaceutical Ltd. - Business segments
Teva Pharmaceutical Ltd. - Key news
Teva Pharmaceutical Ltd. - Key offerings
Teva Pharmaceutical Ltd. - Segment focus
SWOT

16. Appendix

16.1 Scope of the report

Market definition
Objectives
Notes and caveats

16.2 Inclusions and exclusions checklist

Inclusions checklist
Exclusions checklist

16.3 Currency conversion rates for US$

16.4 Research methodology

16.5 Data procurement

Information sources

16.6 Data validation

16.7 Validation techniques employed for market sizing

16.8 Data synthesis

16.9 360 degree market analysis

16.10 List of abbreviations

Research Methodology

Technavio presents a detailed picture of the market by way of study, synthesis, and summation of data from multiple sources. The analysts have presented the various facets of the market with a particular focus on identifying the key industry influencers. The data thus presented is comprehensive, reliable, and the result of extensive research, both primary and secondary.

INFORMATION SOURCES

Primary sources

  • Manufacturers and suppliers
  • Channel partners
  • Industry experts
  • Strategic decision makers

Secondary sources

  • Industry journals and periodicals
  • Government data
  • Financial reports of key industry players
  • Historical data
  • Press releases

DATA ANALYSIS

Data Synthesis

  • Collation of data
  • Estimation of key figures
  • Analysis of derived insights

Data Validation

  • Triangulation with data models
  • Reference against proprietary databases
  • Corroboration with industry experts

REPORT WRITING

Qualitative

  • Market drivers
  • Market challenges
  • Market trends
  • Five forces analysis

Quantitative

  • Market size and forecast
  • Market segmentation
  • Geographical insights
  • Competitive landscape

Interested in this report?

Get your sample now to see our research methodology and insights!

Download Now

Frequently Asked Questions

Active Pharmaceutical Ingredients market growth will increase by USD 105407.0 million during 2026-2030.

The Active Pharmaceutical Ingredients market is expected to grow at a CAGR of 7.2% during 2026-2030.

Active Pharmaceutical Ingredients market is segmented by Manufacturing type (Captive APIs, Contract APIs) Type (Innovative APIs, Generic APIs) Application (Cardiovascular diseases, Oncology, CNS and neurology, Orthopedic, Others)

Alembic Pharmaceuticals Ltd., Aurobindo Pharma Ltd., BASF SE, Boehringer Ingelheim GmbH, Cambrex Corp., Cipla Inc., Corden Pharma Intl. GmbH, Curia Global Inc., Dipharma Francis S.r.l., Divis Laboratories Ltd., Dr. Reddys Laboratories Ltd., EUROAPI S.A., Evonik Industries AG, Jubilant Pharmova Ltd., Lonza Group Ltd., Lupin Ltd., Neuland Laboratories, Siegfried Holding AG, Sun Pharmaceutical Industries, Teva Pharmaceutical Ltd. are a few of the key vendors in the Active Pharmaceutical Ingredients market.

Asia will register the highest growth rate of 71.1% among the other regions. Therefore, the Active Pharmaceutical Ingredients market in Asia is expected to garner significant business opportunities for the vendors during the forecast period.

China, India, Japan, South Korea, Thailand, Indonesia, US, Canada, Mexico, Germany, UK, France, Italy, The Netherlands, Spain, Brazil, Saudi Arabia, Turkey, UAE, Argentina, South Africa, Colombia, Israel

  • Heightened harmonization and mandatory supply chain traceability frameworks is the driving factor this market.

The Active Pharmaceutical Ingredients market vendors should focus on grabbing business opportunities from the Manufacturing type segment as it accounted for the largest market share in the base year.
RIA - Research AI Assistant
Ask RIA
