
Antibody Market Size 2026-2030
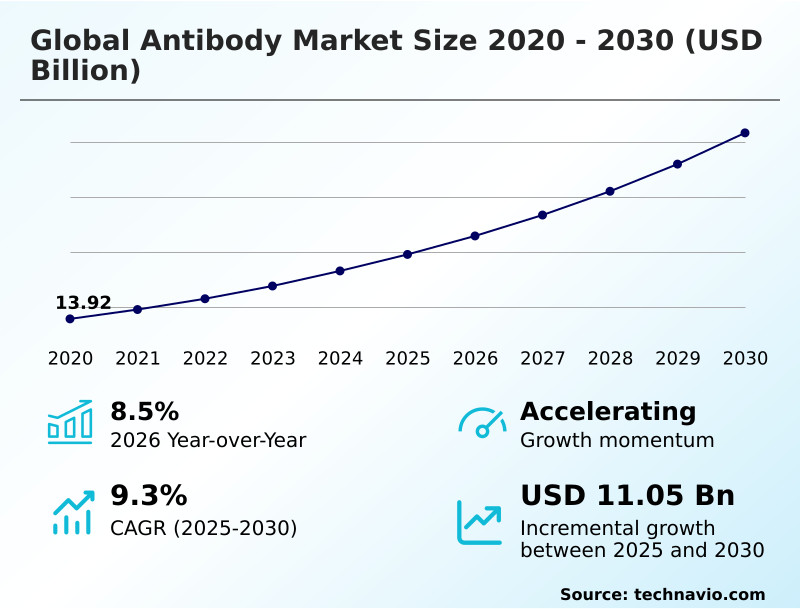
The antibody market size is valued to increase by USD 11.05 billion, at a CAGR of 9.3% from 2025 to 2030. Technological advancements and innovation in antibody engineering will drive the antibody market.
Major Market Trends & Insights
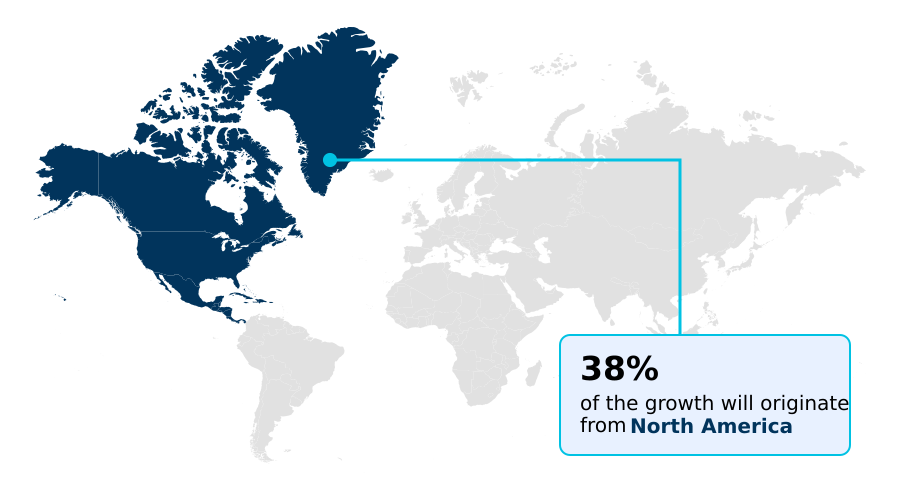
- North America dominated the market and accounted for a 38.5% growth during the forecast period.
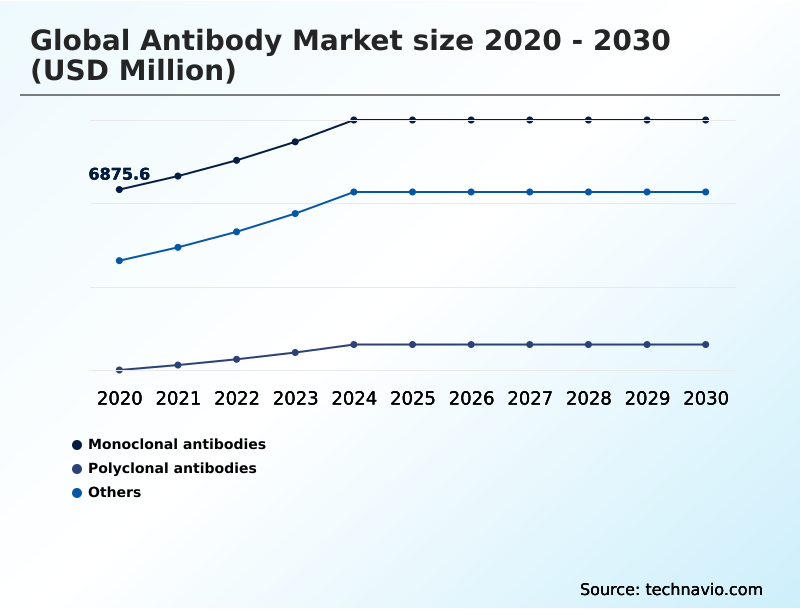
- By Type - Monoclonal antibodies segment was valued at USD 8.73 billion in 2024
- By Therapeutic Area - Oncology segment accounted for the largest market revenue share in 2024
Market Size & Forecast
- Market Opportunities: USD 16.91 billion
- Market Future Opportunities: USD 11.05 billion
- CAGR from 2025 to 2030 : 9.3%
Market Summary
- The antibody market is defined by continuous innovation in protein engineering and an expanding list of clinical applications. At its core, the industry leverages the high specificity of antibodies to develop targeted therapies for complex conditions, with oncology and immunology remaining the largest segments.
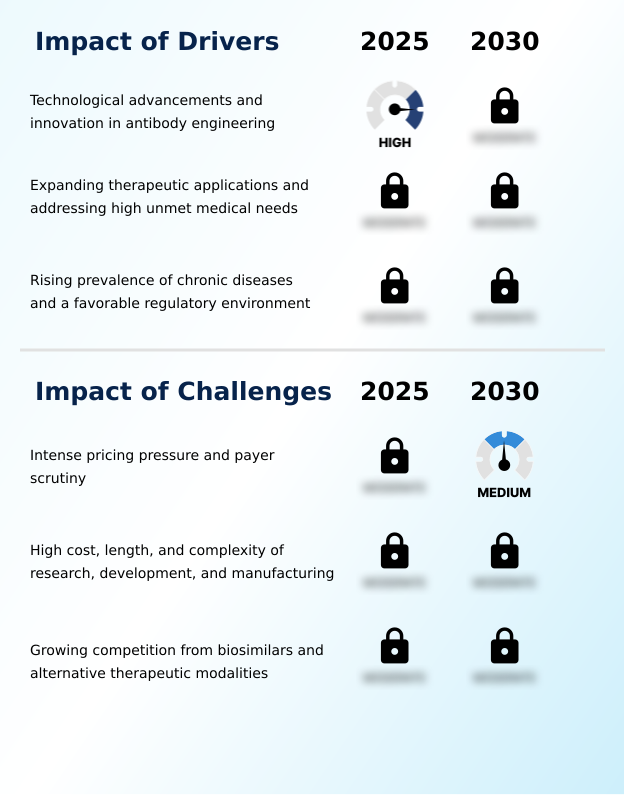
- Key drivers include the rising prevalence of chronic diseases and a more streamlined regulatory environment that accelerates the approval of novel biologics. However, the industry faces significant challenges from intense pricing pressures and the high complexity of manufacturing, where ensuring batch consistency and managing an intricate cold chain for biologics are paramount.
- A central trend is the shift toward next-generation constructs, including bispecific antibodies and antibody-drug conjugates, which offer enhanced efficacy and precision.
- For instance, a biopharmaceutical firm optimizing its manufacturing process for a new antibody-drug conjugate can achieve a 20% reduction in production cycle time through advanced bioprocessing controls, directly impacting its ability to meet market demand and manage costs in a competitive landscape.
What will be the Size of the Antibody Market during the forecast period?
Get Key Insights on Market Forecast (PDF) Get Free Sample
How is the Antibody Market Segmented?
The antibody industry research report provides comprehensive data (region-wise segment analysis), with forecasts and estimates in "USD million" for the period 2026-2030, as well as historical data from 2020-2024 for the following segments.
- Type
- Monoclonal antibodies
- Polyclonal antibodies
- Others
- Therapeutic area
- Oncology
- Autoimmune diseases
- Infectious diseases
- Cardiovascular diseases
- Others
- Application
- Therapeutic
- Diagnostic
- Research
- Geography
- North America
- US
- Canada
- Mexico
- Europe
- Germany
- UK
- France
- Asia
- Rest of World (ROW)
- North America
By Type Insights
The monoclonal antibodies segment is estimated to witness significant growth during the forecast period.
The antibody market is segmented by type, therapeutic area, and application, with monoclonal antibodies dominating therapeutic use. These highly specific molecules, which represent over 70% of the therapeutic segment, are fundamental to targeted therapy strategies.
Innovation continues with the exploration of senolytics for age-related conditions and the use of cell-penetrating peptides and lipid nanoparticles to deliver antibodies to intracellular targets.
Advances in target identification are expanding the scope of diagnostic antibodies and research antibodies, further diversifying the market.
The development of patient-friendly subcutaneous delivery systems, which can improve adherence by over 25% compared to intravenous methods, is also shaping the commercial landscape by enhancing the value proposition for chronic therapies and addressing immunogenicity risk assessment through improved Fc receptor binding and antigen-binding fragment design.
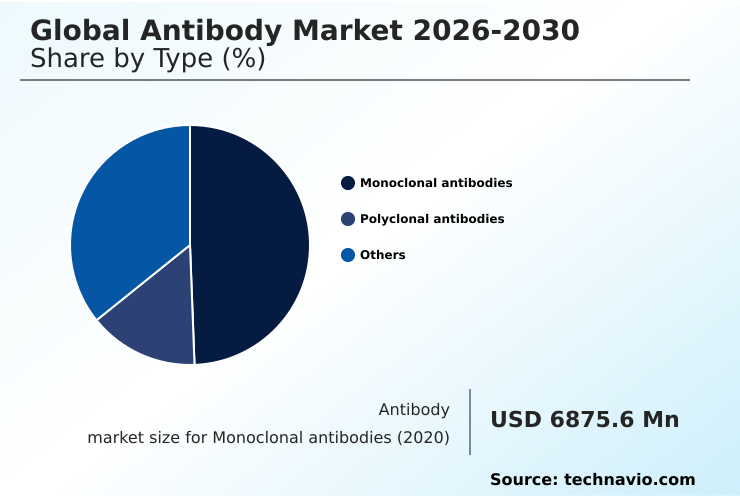
The Monoclonal antibodies segment was valued at USD 8.73 billion in 2024 and showed a gradual increase during the forecast period.
Regional Analysis
North America is estimated to contribute 38.5% to the growth of the global market during the forecast period.Technavio’s analysts have elaborately explained the regional trends and drivers that shape the market during the forecast period.
See How Antibody Market Demand is Rising in North America Get Free Sample
The geographic landscape is led by North America, which accounts for over 38% of incremental growth, driven by its advanced research infrastructure and high adoption of novel therapies.
The region excels in utilizing companion diagnostics and liquid biopsy for patient stratification. Europe follows, with a mature market distinguished by high biosimilar penetration and rigorous Health Technology Assessments.
Asia is the fastest-growing region, with China and South Korea becoming hubs for cell culture-based manufacturing and protein purification. The use of research antibody tools and quality control assays is expanding rapidly, supported by government initiatives.
In these regions, passive immunization programs for infectious diseases using intravenous immunoglobulin and polyclonal antibody services are gaining traction, while the harmonization of clinical trial standards has reduced cross-border study setup times by 20%.
Market Dynamics
Our researchers analyzed the data with 2025 as the base year, along with the key drivers, trends, and challenges. A holistic analysis of drivers will help companies refine their marketing strategies to gain a competitive advantage.
- The strategic focus of the antibody market is shifting toward more complex and targeted therapeutic approaches. The role of AI in antibody discovery is becoming critical, accelerating the identification of viable candidates and reducing early-stage attrition. This complements advanced screening methods like phage display for antibody screening. In clinical applications, there is a clear divergence in strategy.
- While polyclonal antibodies for infectious diseases offer a broad-spectrum solution, the industry is heavily invested in precision medicine using antibody treatments. This is exemplified by the rise of bispecific antibodies in cancer immunotherapy and the refinement of antibody-drug conjugates for solid tumors, where advancements in antibody-drug conjugate linkers are improving stability and efficacy.
- Concurrently, the impact of biosimilars on antibody pricing is forcing innovators to differentiate through superior engineering. Key strategies include Fc engineering for longer half-life and glycoengineering to enhance antibody potency, which can improve patient compliance. Manufacturing challenges of monoclonal antibodies, particularly in downstream processing in antibody production and managing cold chain logistics for biologic drugs, remain a significant hurdle.
- Looking ahead, expansion into new frontiers, such as using senolytics for treating age-related diseases and nanobodies for crossing the blood-brain barrier, highlights the industry's forward momentum.
What are the key market drivers leading to the rise in the adoption of Antibody Industry?
- Technological advancements and innovation in antibody engineering are key drivers of market growth.
- Key market drivers are centered on technological innovation in antibody discovery and expanding therapeutic applications.
- The use of advanced platforms like phage display and AI-driven predictive modeling accelerates the development of novel therapeutic antibodies, reducing discovery timelines by up to 50%.
- This enables more effective precision medicine approaches across various fields, including oncology biologics, autoimmune disease treatment, and infectious disease countermeasures.
- Engineering breakthroughs, such as Fc region engineering for half-life extension and glycoengineering to enhance potency, are creating more effective humanized antibodies.
- The expansion into previously hard-to-treat areas, such as cardiovascular biologics and neurodegenerative disease therapies, has increased the potential patient pool by over 15%, fueling sustained investment in the sector and broadening the applications for polyclonal antibodies.
What are the market trends shaping the Antibody Industry?
- The ascendancy of next-generation antibody constructs marks a significant trend. Developers are moving beyond simple monoclonal designs to more complex and targeted formats.
- The market is witnessing a definitive shift toward next-generation antibody formats, driven by the limitations of traditional monoclonal antibodies. The ascendancy of antibody-drug conjugates for targeted drug delivery and bispecific antibodies in immunotherapy highlights a key trend in therapeutic antibody development. These engineered molecules, along with multispecific antibodies, nanobodies, and single-chain variable fragments, offer superior precision and functionality.
- Such protein engineering allows for novel treatment paradigms, including those for rare conditions requiring orphan drug designation. These advanced constructs can improve payload delivery accuracy by over 40% compared to conventional methods. The complexity of monoclonal antibody production for these formats requires significant investment but promises substantial clinical advantages, with some bispecifics demonstrating a two-fold increase in immune cell activation.
What challenges does the Antibody Industry face during its growth?
- Intense pricing pressure and payer scrutiny present a key challenge affecting industry growth.
- The market faces considerable challenges from intense cost pressures and rising competition. The introduction of biosimilars is a primary factor, with their entry capable of reducing originator revenues by 30-50% within two years, forcing a re-evaluation of the cost of goods sold.
- This pricing pressure is compounded by the high cost of the antibody manufacturing process itself, where complex bioprocessing techniques, downstream processing, and stringent cold chain logistics for the biologics supply chain can account for over 60% of total production costs. Furthermore, alternative modalities like CAR-T therapy and RNA interference are creating a more competitive therapeutic landscape.
- Navigating value-based reimbursement models and complex regulatory approval pathways while managing immunogenicity risks during clinical trial design remains a significant hurdle for developers.
Exclusive Technavio Analysis on Customer Landscape
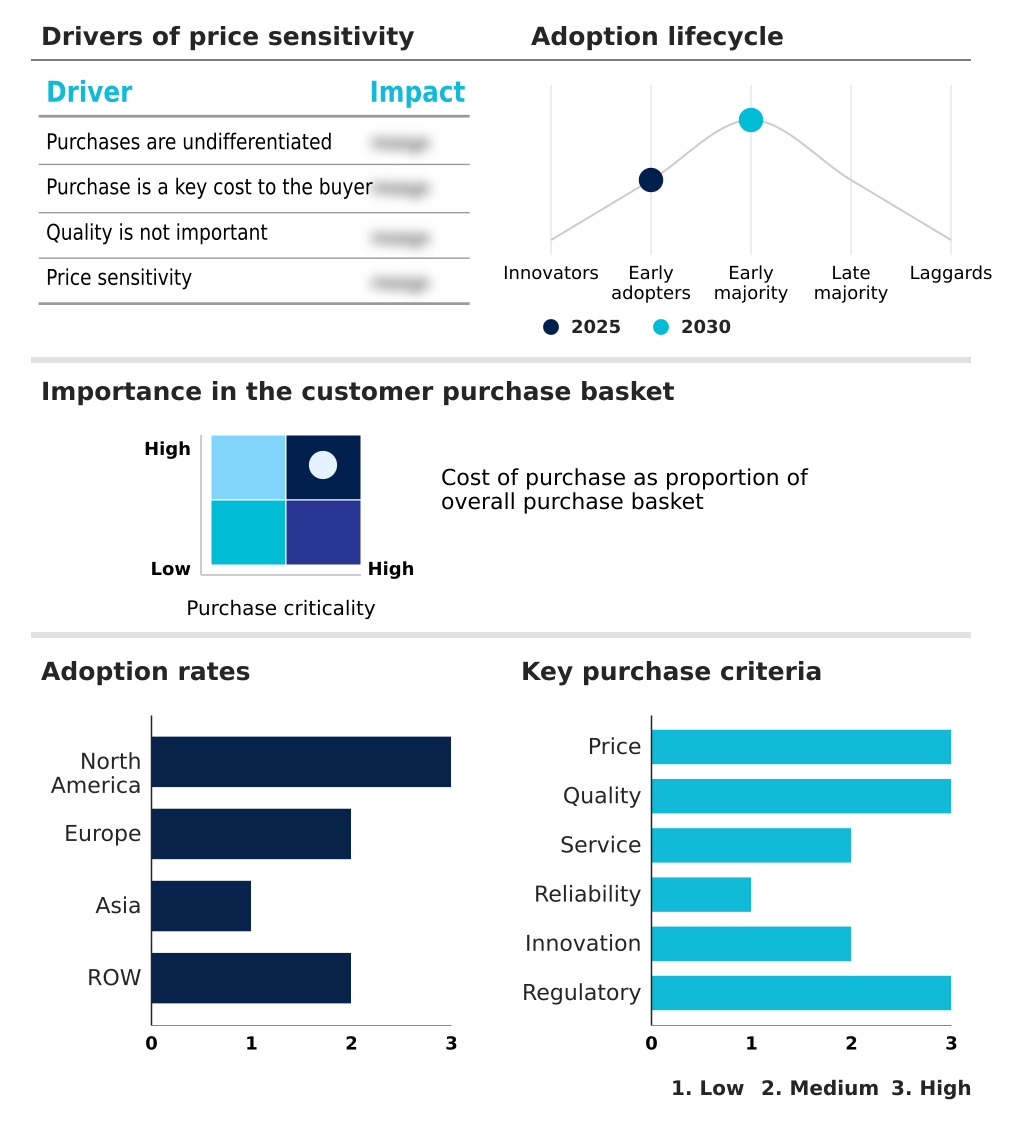
The antibody market forecasting report includes the adoption lifecycle of the market, covering from the innovator’s stage to the laggard’s stage. It focuses on adoption rates in different regions based on penetration. Furthermore, the antibody market report also includes key purchase criteria and drivers of price sensitivity to help companies evaluate and develop their market growth analysis strategies.
Customer Landscape of Antibody Industry
Competitive Landscape
Companies are implementing various strategies, such as strategic alliances, antibody market forecast, partnerships, mergers and acquisitions, geographical expansion, and product/service launches, to enhance their presence in the industry.
AbbVie Inc. - Offers specialized monoclonal antibody therapies for immunology and autoimmune diseases, focusing on targeted biological treatments.
The industry research and growth report includes detailed analyses of the competitive landscape of the market and information about key companies, including:
- AbbVie Inc.
- Amgen Inc.
- AstraZeneca Plc
- Bio Rad Laboratories Inc.
- BioVendor LM
- Cell Signaling Technology Inc.
- Celltrion Co. Ltd.
- Creative Biolabs
- F. Hoffmann La Roche Ltd.
- GenScript Biotech Corp.
- Johnson and Johnson Services
- Leinco Technologies Inc.
- Merck and Co. Inc.
- Novartis AG
- Novus Biologicals
- Pfizer Inc.
- Proteintech Group Inc.
- Regeneron Pharmaceuticals Inc.
- Sanofi SA
- Sino Biological Inc.
Qualitative and quantitative analysis of companies has been conducted to help clients understand the wider business environment as well as the strengths and weaknesses of key industry players. Data is qualitatively analyzed to categorize companies as pure play, category-focused, industry-focused, and diversified; it is quantitatively analyzed to categorize companies as dominant, leading, strong, tentative, and weak.
Recent Development and News in Antibody market
- In February 2025, CSL Behring announced a significant expansion of its plasma collection network to meet rising global demand for intravenous immunoglobulin and other polyclonal-based therapies, essential for patients with primary immunodeficiency disorders.
- In March 2025, AstraZeneca reported a major breakthrough in its antibody-drug conjugate pipeline, demonstrating that targeted chemotherapy delivery significantly improves survival rates in patients with hard-to-treat solid tumors.
- In April 2025, Merck and Co. confirmed its flagship immunotherapy remains a standard of care across multiple first-line cancer indications while announcing new exploratory combination therapies with next-generation antibodies.
- In May 2025, Johnson and Johnson highlighted the expansion of its immunology portfolio by launching a new high-concentration formulation, allowing for less frequent dosing and improved patient convenience for autoimmune diseases.
Dive into Technavio’s robust research methodology, blending expert interviews, extensive data synthesis, and validated models for unparalleled Antibody Market insights. See full methodology.
| Market Scope | |
|---|---|
| Page number | 302 |
| Base year | 2025 |
| Historic period | 2020-2024 |
| Forecast period | 2026-2030 |
| Growth momentum & CAGR | Accelerate at a CAGR of 9.3% |
| Market growth 2026-2030 | USD 11054.6 million |
| Market structure | Fragmented |
| YoY growth 2025-2026(%) | 8.5% |
| Key countries | US, Canada, Mexico, Germany, UK, France, Italy, Spain, The Netherlands, China, India, Japan, South Korea, Indonesia, Thailand, Brazil, Saudi Arabia, UAE, Turkey, Argentina, Colombia, South Africa and Israel |
| Competitive landscape | Leading Companies, Market Positioning of Companies, Competitive Strategies, and Industry Risks |
Research Analyst Overview
- The antibody market's evolution is driven by sophisticated protein engineering and expanding clinical applications. The development of humanized antibodies and innovations in antibody discovery, such as phage display and AI-driven platforms, have become standard. This has enabled the creation of diverse therapeutic antibodies, including monoclonal antibodies, bispecific antibodies, and antibody-drug conjugates, which are central to modern targeted therapy and immunotherapy.
- The field is also advancing into novel constructs like single-chain variable fragments and multispecific antibodies. Key manufacturing processes, including cell culture, bioprocessing, and protein purification, are under constant pressure to improve efficiency, particularly in downstream processing. Challenges such as immunogenicity and the complexities of cold chain logistics remain critical operational concerns.
- At a strategic level, boardroom decisions are increasingly influenced by the entry of biosimilars, which can erode innovator revenues by up to 40% within two years, necessitating a robust pipeline of next-generation molecules to ensure sustained commercial viability. The market also includes significant diagnostic antibodies and research antibodies segments.
What are the Key Data Covered in this Antibody Market Research and Growth Report?
-
What is the expected growth of the Antibody Market between 2026 and 2030?
-
USD 11.05 billion, at a CAGR of 9.3%
-
-
What segmentation does the market report cover?
-
The report is segmented by Type (Monoclonal antibodies, Polyclonal antibodies, and Others), Therapeutic Area (Oncology, Autoimmune diseases, Infectious diseases, Cardiovascular diseases, and Others), Application (Therapeutic, Diagnostic, and Research) and Geography (North America, Europe, Asia, Rest of World (ROW))
-
-
Which regions are analyzed in the report?
-
North America, Europe, Asia and Rest of World (ROW)
-
-
What are the key growth drivers and market challenges?
-
Technological advancements and innovation in antibody engineering, Intense pricing pressure and payer scrutiny
-
-
Who are the major players in the Antibody Market?
-
AbbVie Inc., Amgen Inc., AstraZeneca Plc, Bio Rad Laboratories Inc., BioVendor LM, Cell Signaling Technology Inc., Celltrion Co. Ltd., Creative Biolabs, F. Hoffmann La Roche Ltd., GenScript Biotech Corp., Johnson and Johnson Services, Leinco Technologies Inc., Merck and Co. Inc., Novartis AG, Novus Biologicals, Pfizer Inc., Proteintech Group Inc., Regeneron Pharmaceuticals Inc., Sanofi SA and Sino Biological Inc.
-
Market Research Insights
- Market dynamics are increasingly shaped by precision medicine approaches and the push for greater value. The focus on therapeutic antibody development is intense, with next-generation antibody formats designed for specific biomarker identification. This alignment of targeted drug delivery with diagnostic antibody applications improves clinical outcomes, with some precision therapies boosting response rates by 40% in targeted patient populations.
- Simultaneously, the biologics supply chain is under pressure to enhance efficiency, as complex bioprocessing techniques and strict regulatory approval pathways contribute to high operational costs.
- Payers are enforcing value-based reimbursement models, which scrutinize the cost of goods sold for high-price biologics, making the antibody manufacturing process a key area for cost-containment strategies that can reduce expenses by 15-20% without compromising quality.
We can help! Our analysts can customize this antibody market research report to meet your requirements.
 RIA -
RIA - 
