
Ad Spending Market Size 2026-2030
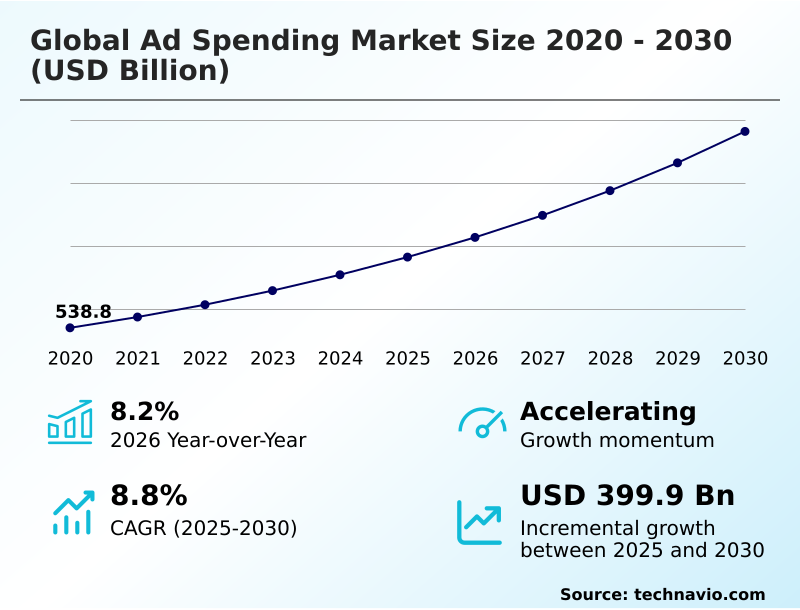
The ad spending market size is valued to increase by USD 399.9 billion, at a CAGR of 8.8% from 2025 to 2030. Advancements in AI and algorithmic advertising will drive the ad spending market.
Major Market Trends & Insights
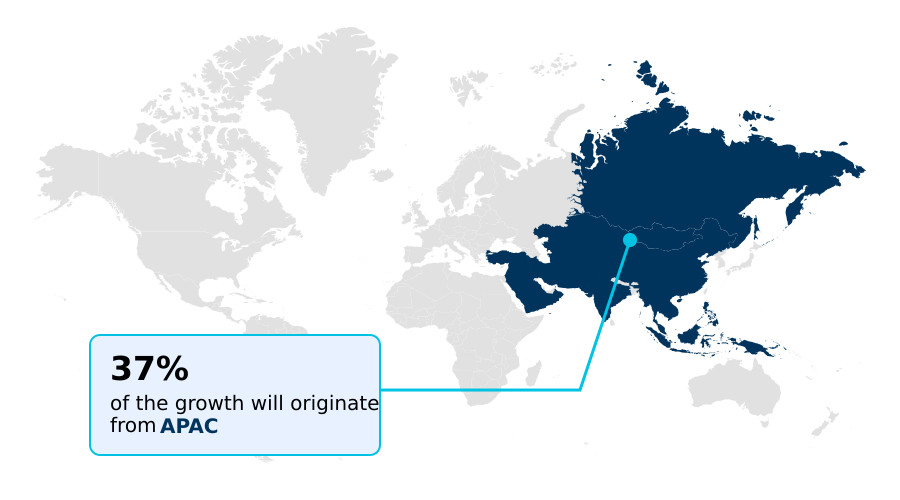
- APAC dominated the market and accounted for a 36.8% growth during the forecast period.
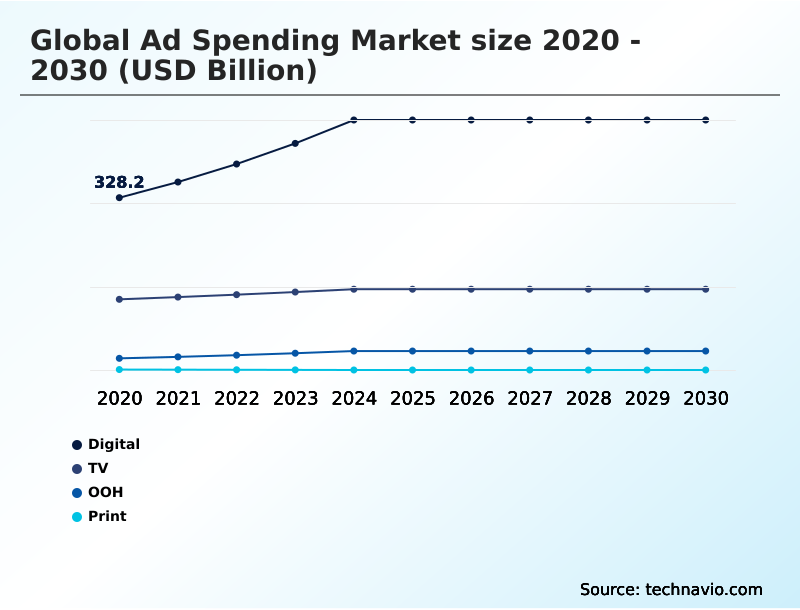
- By Type - Digital segment was valued at USD 466.7 billion in 2024
- By End-user - Retail and e-commerce segment accounted for the largest market revenue share in 2024
Market Size & Forecast
- Market Opportunities: USD 624.9 billion
- Market Future Opportunities: USD 399.9 billion
- CAGR from 2025 to 2030 : 8.8%
Market Summary
- The Ad Spending Market is defined by a dynamic ecosystem where businesses connect with consumers across a diversifying array of media channels. Growth is fundamentally tied to the integration of technology that enhances targeting precision and measures performance, with programmatic advertising and AI-driven analytics at the forefront.
- A primary trend involves the shift toward retail media networks and social commerce, where the point of consumer interaction and transaction merge. For instance, a consumer goods company can now launch a new product and leverage first-party data from a retail partner to deliver hyper-targeted shoppable video ads directly to high-intent audiences, optimizing return on investment in real time.
- However, this data-centric approach is tempered by significant challenges, including intensifying privacy regulations and the deprecation of third-party identifiers. This regulatory pressure forces a strategic pivot toward consent-based, first-party data ecosystems, which, while more complex to manage, build greater consumer trust.
- Economic headwinds further compel advertisers to prioritize efficiency, reinforcing the demand for platforms that offer clear, measurable outcomes and robust campaign attribution to justify every dollar spent.
What will be the Size of the Ad Spending Market during the forecast period?
Get Key Insights on Market Forecast (PDF) Get Free Sample
How is the Ad Spending Market Segmented?
The ad spending industry research report provides comprehensive data (region-wise segment analysis), with forecasts and estimates in "USD billion" for the period 2026-2030, as well as historical data from 2020-2024 for the following segments.
- Type
- Digital
- TV
- OOH
- End-user
- Retail and e-commerce
- Consumer goods
- Financial services
- Automotive
- Others
- Channel
- Digital advertising
- Traditional advertising
- Geography
- North America
- US
- Canada
- Mexico
- APAC
- China
- Japan
- India
- Europe
- Germany
- UK
- France
- South America
- Brazil
- Argentina
- Middle East and Africa
- Saudi Arabia
- UAE
- South Africa
- Rest of World (ROW)
- North America
By Type Insights
The digital segment is estimated to witness significant growth during the forecast period.
The digital segment leads the ad spending market, driven by high precision and the ability to track user behavior through real-time bidding. Innovations in programmatic advertising and media buying automation allow for enhanced AI-driven campaign optimization across channels.
As the industry moves away from third-party cookies, companies are implementing data clean rooms for campaign performance tracking while maintaining privacy.
Social commerce initiatives are expected to attract more spending, as search advertising platforms and programmatic display ads integrate shoppable features.
This shift toward omnichannel marketing is underscored by a focus on comprehensive customer journey mapping, with platforms reporting a 20% increase in user time spent due to better content recommendations, directly benefiting ad revenue.
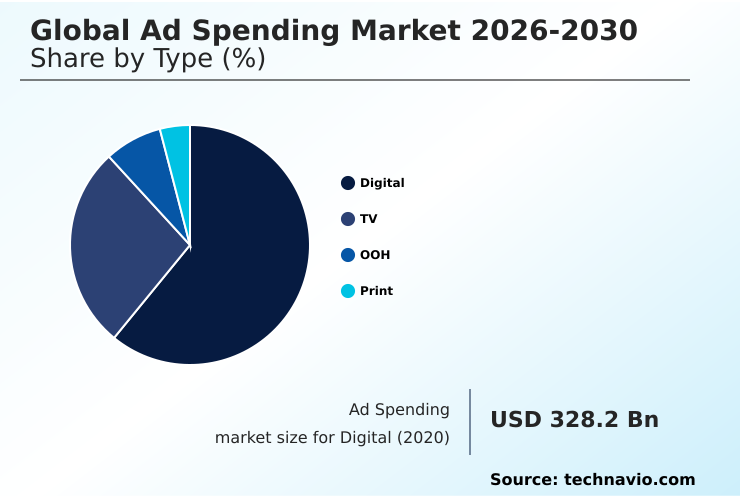
The Digital segment was valued at USD 466.7 billion in 2024 and showed a gradual increase during the forecast period.
Regional Analysis
APAC is estimated to contribute 36.8% to the growth of the global market during the forecast period.Technavio’s analysts have elaborately explained the regional trends and drivers that shape the market during the forecast period.
See How Ad Spending Market Demand is Rising in APAC Get Free Sample
The ad spending market exhibits significant geographic variance, with North America representing a mature market and APAC emerging as the fastest-growing region, accounting for over 36% of new market potential.
Europe's landscape is heavily influenced by privacy-compliant frameworks, which have spurred innovation in contextual targeting and other compliant methods. The adoption of addressable advertising via demand-side platforms is a global phenomenon, enabling precise audience segmentation and improved consumer behavior forecasting.
In North America, the focus is on sophisticated closed-loop attribution, while emerging markets in South America and the Middle East and Africa are rapidly adopting digital-first omnichannel marketing strategies to refine their customer journey mapping.
Market Dynamics
Our researchers analyzed the data with 2025 as the base year, along with the key drivers, trends, and challenges. A holistic analysis of drivers will help companies refine their marketing strategies to gain a competitive advantage.
- Strategic navigation of the ad spending market now requires mastering an array of sophisticated techniques to ensure effectiveness and a high return on investment. The effectiveness of programmatic connected TV advertising is a key focus, as it combines the scale of television with digital precision.
- Similarly, advertisers are closely monitoring retail media network ad performance, leveraging first-party data to influence consumers at the point of purchase. The rise of social commerce conversion rate optimization has become a critical discipline, transforming social platforms into direct sales channels.
- Central to these efforts is a robust first-party data strategy for advertisers, which serves as the foundation for personalization in a privacy-first era. AI in advertising campaign management automates and enhances decision-making, from audience targeting with first party data to dynamic creative adjustments. Consequently, measuring cross-channel advertising ROI is more complex yet essential for holistic budget allocation.
- Brand safety in programmatic advertising and advanced ad fraud detection and prevention techniques are non-negotiable for protecting investments. Furthermore, generative AI for personalized ad content is enabling scalable, hyper-relevant messaging, with some premium channels achieving engagement rates several times higher than standard digital formats, fundamentally altering media planning.
- The ongoing debate over contextual advertising versus behavioral targeting continues to shape platform strategies and advertiser choices, while optimizing ad spend with AI remains a universal goal.
What are the key market drivers leading to the rise in the adoption of Ad Spending Industry?
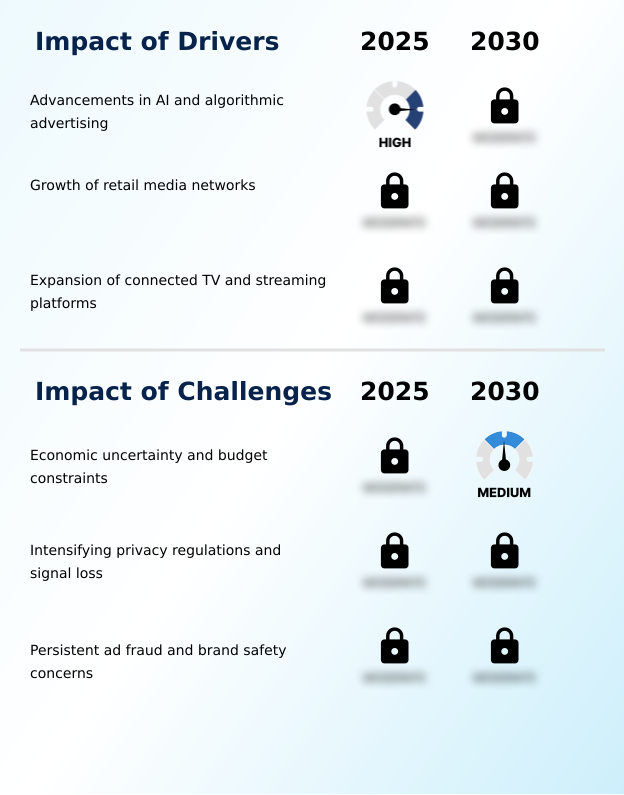
- Advancements in AI and algorithmic advertising are key drivers of market growth, enhancing targeting, personalization, and overall campaign efficiency.
- Key drivers reshaping the ad spending market include the integration of algorithmic advertising, the expansion of retail media networks, and the rise of connected TV advertising.
- AI-powered content recommendation algorithms and generative AI content deliver precise targeting and personalization, improving campaign efficiency. Retail media networks leverage first-party data for targeted placements, with leading networks showing revenue growth over 25%.
- Concurrently, connected TV advertising is expanding rapidly, with spending in the channel growing 16% year-over-year.
- The use of shoppable video formats and advanced consumer engagement analytics enables better cross-channel attribution, encouraging a strategic advertising budget allocation toward these high-performing digital channels.
What are the market trends shaping the Ad Spending Industry?
- The increasing dominance of social media advertising represents a significant market trend, driven by its ability to provide engaging formats and direct consumer interaction.
- Evolving trends in ad spending are centered on programmatic efficiency, the dominance of social media advertising, and a strategic shift to privacy-first data strategies. The surge in social media is significant, with projections indicating it will capture over a quarter of total investment.
- Simultaneously, programmatic advertising commands nearly 90% of digital display budgets, reflecting a market-wide move toward automation and performance-based advertising. As the industry confronts cookie deprecation solutions, the reliance on first-party data and privacy-preserving technologies has become critical.
- This transition supports consent-based profiling and empowers advertisers to maintain a high return on ad spend through influencer marketing platforms and direct consumer engagement.
What challenges does the Ad Spending Industry face during its growth?
- Economic uncertainty and associated budget constraints present a key challenge to the industry's growth, leading to more cautious ad spending.
- Significant challenges impacting the ad spending market include persistent economic uncertainty, intensifying privacy regulations leading to signal loss mitigation needs, and ongoing ad fraud. Issues like invalid traffic detection and brand safety verification are critical, as fraud continues to erode budgets. Even with automated creative production, advertisers remain cautious, prioritizing channels with clear ad viewability metrics.
- While digital channels are resilient, traditional formats like broadcast television ads and out-of-home media face budget scrutiny. The industry is responding with innovations like federated learning models to navigate privacy constraints, but the combination of economic pressure and regulatory complexity shapes a more disciplined, albeit constrained, spending landscape.
Exclusive Technavio Analysis on Customer Landscape
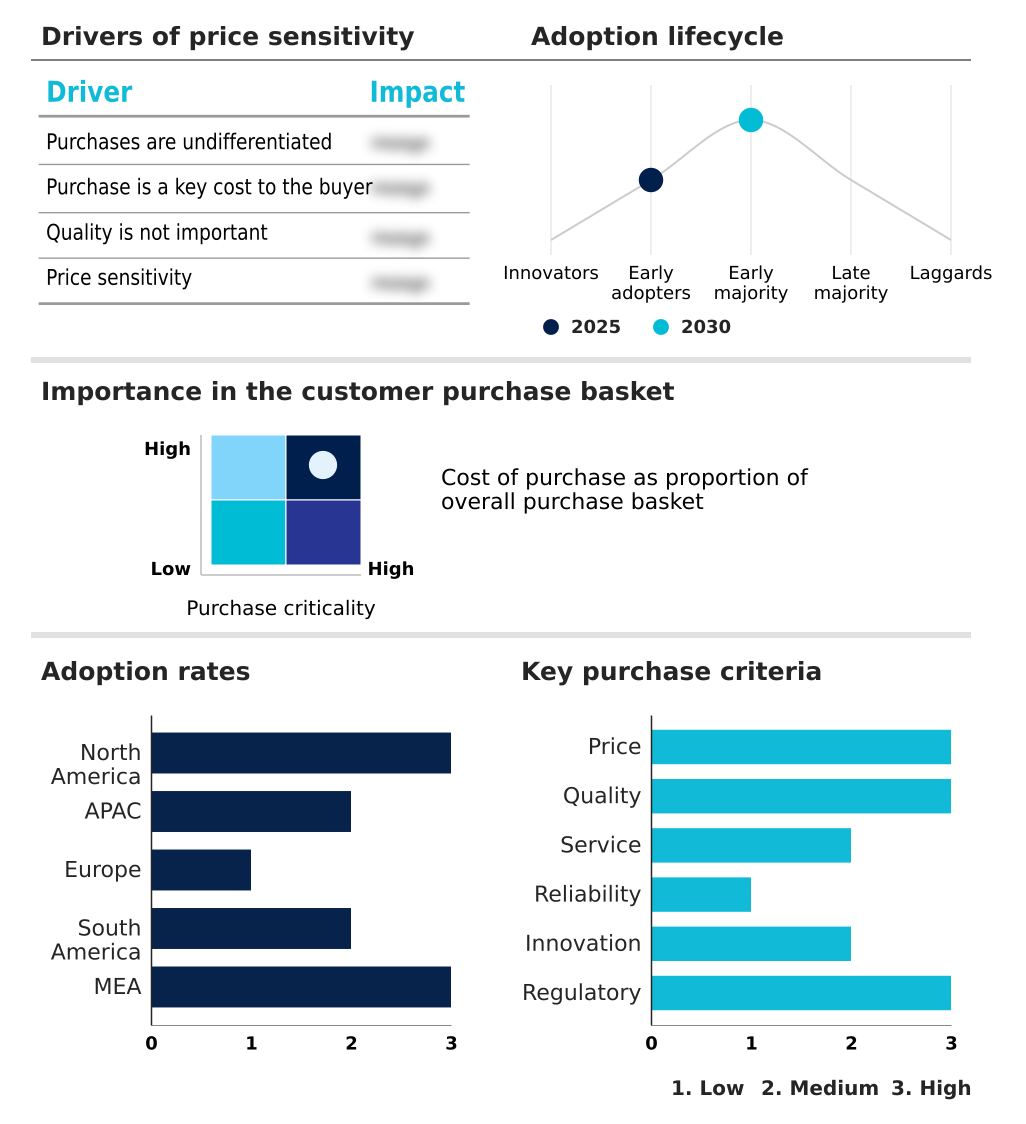
The ad spending market forecasting report includes the adoption lifecycle of the market, covering from the innovator’s stage to the laggard’s stage. It focuses on adoption rates in different regions based on penetration. Furthermore, the ad spending market report also includes key purchase criteria and drivers of price sensitivity to help companies evaluate and develop their market growth analysis strategies.
Customer Landscape of Ad Spending Industry
Competitive Landscape
Companies are implementing various strategies, such as strategic alliances, ad spending market forecast, partnerships, mergers and acquisitions, geographical expansion, and product/service launches, to enhance their presence in the industry.
Baidu Inc. - Delivers intent-based targeting and AI-driven campaign optimization, leveraging comprehensive location data to enhance ad spending effectiveness.
The industry research and growth report includes detailed analyses of the competitive landscape of the market and information about key companies, including:
- Baidu Inc.
- Captivate LLC
- Clear Channel Outdoor Holdings
- Comcast Corp.
- Daniel J. Edelman Holdings Inc
- Fairway Outdoor LLC
- Focus Media Holding Ltd.
- Google LLC
- JCDecaux SE
- Lamar Advertising Co.
- Meta Platforms Inc.
- Microsoft Corp.
- Omnicom Group Inc.
- OUTFRONT Media Inc.
- Publicis Groupe SA
- Stroer SE and Co. KGaA
- The Interpublic Group of Co Inc
- Verizon Communications Inc.
- WPP Plc
- X Corp.
Qualitative and quantitative analysis of companies has been conducted to help clients understand the wider business environment as well as the strengths and weaknesses of key industry players. Data is qualitatively analyzed to categorize companies as pure play, category-focused, industry-focused, and diversified; it is quantitatively analyzed to categorize companies as dominant, leading, strong, tentative, and weak.
Recent Development and News in Ad spending market
- In April 2025, Walmart enhanced its shopping assistant Sparky with advanced advertising features, improving e-commerce ad delivery and increasing retail media expenditures.
- In April 2025, Instacart collaborated with Uber to enlarge ad inventory, strengthening grocery brand targeting and boosting North American spend.
- In February 2025, Basis Technologies discussed digital advertising regulation, emphasizing the need to prioritize privacy amid consumer and regulatory demands for transparency.
- In January 2025, TikTok launched a new feature that integrates shopping directly into the video feed, allowing users to purchase products without leaving the application.
Dive into Technavio’s robust research methodology, blending expert interviews, extensive data synthesis, and validated models for unparalleled Ad Spending Market insights. See full methodology.
| Market Scope | |
|---|---|
| Page number | 308 |
| Base year | 2025 |
| Historic period | 2020-2024 |
| Forecast period | 2026-2030 |
| Growth momentum & CAGR | Accelerate at a CAGR of 8.8% |
| Market growth 2026-2030 | USD 399.9 billion |
| Market structure | Fragmented |
| YoY growth 2025-2026(%) | 8.2% |
| Key countries | US, Canada, Mexico, China, Japan, India, South Korea, Australia, Indonesia, Germany, UK, France, Italy, Spain, The Netherlands, Brazil, Argentina, Chile, Saudi Arabia, UAE, South Africa, Israel and Turkey |
| Competitive landscape | Leading Companies, Market Positioning of Companies, Competitive Strategies, and Industry Risks |
Research Analyst Overview
- The Ad Spending Market is undergoing a fundamental transformation, driven by a strategic pivot from broad-reach campaigns to precision-targeted, performance-based outcomes. Central to this evolution is the integration of algorithmic advertising and AI-driven campaign optimization, which allow for real-time adjustments and enhanced efficiency.
- The reliance on first-party data has become a cornerstone of modern strategy, enabling addressable advertising and sophisticated contextual targeting while navigating an increasingly complex regulatory environment. Innovations such as generative AI content and shoppable video formats are reshaping consumer interactions, supported by advanced demand-side platforms that facilitate real-time bidding.
- This technological shift is compelling boardroom-level decisions around investments in privacy-preserving technologies and data infrastructure. Analysis of viewership patterns shows a 24% increase in ad engagement on key streaming services, directly impacting budget allocation strategies. Mastering closed-loop attribution and audience segmentation is now essential for maintaining a competitive edge in this dynamic landscape.
What are the Key Data Covered in this Ad Spending Market Research and Growth Report?
-
What is the expected growth of the Ad Spending Market between 2026 and 2030?
-
USD 399.9 billion, at a CAGR of 8.8%
-
-
What segmentation does the market report cover?
-
The report is segmented by Type (Digital, TV, OOH, and Print), End-user (Retail and e-commerce, Consumer goods, Financial services, Automotive, and Others), Channel (Digital advertising, and Traditional advertising) and Geography (North America, APAC, Europe, South America, Middle East and Africa)
-
-
Which regions are analyzed in the report?
-
North America, APAC, Europe, South America and Middle East and Africa
-
-
What are the key growth drivers and market challenges?
-
Advancements in AI and algorithmic advertising, Economic uncertainty and budget constraints
-
-
Who are the major players in the Ad Spending Market?
-
Baidu Inc., Captivate LLC, Clear Channel Outdoor Holdings, Comcast Corp., Daniel J. Edelman Holdings Inc, Fairway Outdoor LLC, Focus Media Holding Ltd., Google LLC, JCDecaux SE, Lamar Advertising Co., Meta Platforms Inc., Microsoft Corp., Omnicom Group Inc., OUTFRONT Media Inc., Publicis Groupe SA, Stroer SE and Co. KGaA, The Interpublic Group of Co Inc, Verizon Communications Inc., WPP Plc and X Corp.
-
Market Research Insights
- Market dynamics in ad spending are being reshaped by technological advancements and shifting consumer behaviors, driving a focus on performance-based advertising. The growth of retail media networks is a testament to this, with leading platforms reporting revenue growth rates exceeding 25% by leveraging first-party data for superior targeting.
- Concurrently, the migration of audiences to streaming services has fueled a 16% year-over-year increase in connected TV spending, as advertisers follow viewers to on-demand environments. This trend is amplified by enhanced content recommendation algorithms on social platforms, which have increased user time spent by 20%, creating more valuable ad inventory.
- These shifts compel advertisers to refine cross-channel attribution models and adjust budget allocations toward channels offering higher engagement and clearer ROI.
We can help! Our analysts can customize this ad spending market research report to meet your requirements.
 RIA -
RIA - 
