Adhesion Barriers Market Analysis, Size, and Forecast 2026-2030: North America (US, Canada, and Mexico), Europe (Germany, UK, and France), APAC (China, India, and Japan), South America (Brazil, Argentina, and Colombia), Middle East and Africa (Saudi Arabia, UAE, and South Africa), Asia, Rest of World (ROW)

Adhesion Barriers Market Analysis, Size, and Forecast 2026-2030:
North America (US, Canada, and Mexico), Europe (Germany, UK, and France), APAC (China, India, and Japan), South America (Brazil, Argentina, and Colombia), Middle East and Africa (Saudi Arabia, UAE, and South Africa), Asia, Rest of World (ROW)

Published: Mar 2026 296 Pages SKU: IRTNTR74249

Market Overview at a Glance

$324.5 Mn
Market Opportunity
6.3%
CAGR 2025 - 2030
36.3%
North America Growth
$337.9 Mn
Gynecology surgeries segment 2024

Adhesion Barriers Market Size 2026-2030

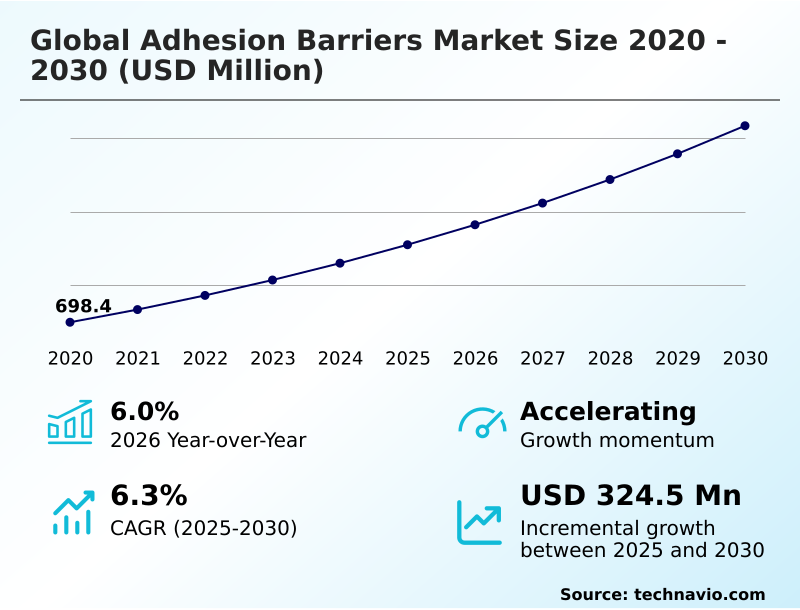
The adhesion barriers market size is valued to increase by USD 324.5 million, at a CAGR of 6.3% from 2025 to 2030. Increasing volume of complex surgical procedures and rapidly expanding geriatric demographic will drive the adhesion barriers market.

Major Market Trends & Insights

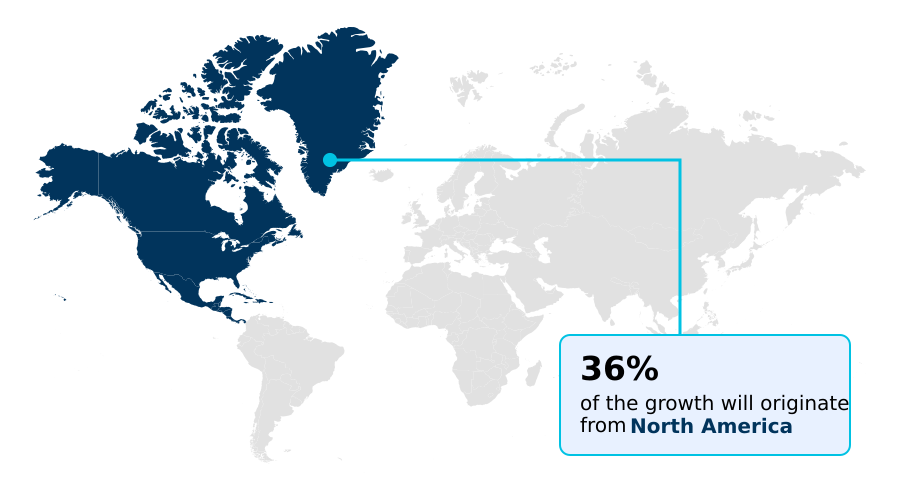
  • North America dominated the market and accounted for a 36.3% growth during the forecast period.
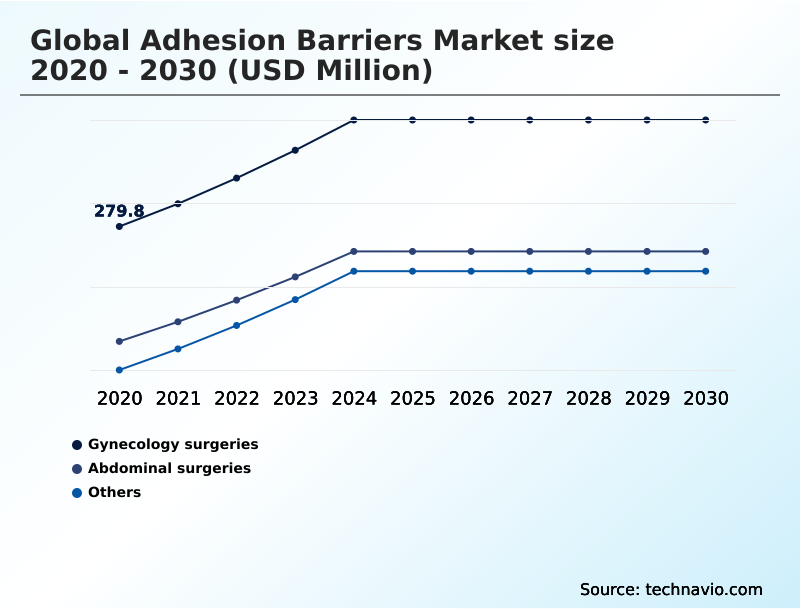
  • By Application - Gynecology surgeries segment was valued at USD 337.9 million in 2024
  • By Product - Films and sheets segment accounted for the largest market revenue share in 2024

Market Size & Forecast

  • Market Opportunities: USD 535.9 million
  • Market Future Opportunities: USD 324.5 million
  • CAGR from 2025 to 2030 : 6.3%

Market Summary

  • The adhesion barriers market is integral to modern surgery, offering critical solutions for preventing postoperative complications. These biomaterials, which range from oxidized regenerated cellulose sheets to advanced polyethylene glycol hydrogel formulations, are designed to prevent intra-abdominal scarring and other forms of tissue tethering that arise from serosal surface trauma.
  • A primary driver is the increasing volume of complex procedures, especially among an aging population. The market is also shaped by a significant trend toward flowable gel formulations and sprayable synthetic polymers, which are compatible with laparoscopic application and robotic-assisted surgery.
  • These advanced products facilitate in situ polymerization, creating a protective layer that supports natural mesothelial repair while minimizing the risk of a foreign body reaction. A common business scenario involves a hospital system implementing prophylactic biomaterials as a standard of surgical care.
  • By doing so, they can reduce readmission rates for adhesion-related bowel obstructions by over 20%, thereby improving patient outcomes and aligning with value-based procurement models that prioritize long-term cost-effectiveness thresholds over immediate procedural costs. However, the industry faces challenges from stringent regulatory hurdles for any class iii medical device and fragmented reimbursement frameworks.

What will be the Size of the Adhesion Barriers Market during the forecast period?

Get Key Insights on Market Forecast (PDF) Request Free Sample

How is the Adhesion Barriers Market Segmented?

The adhesion barriers industry research report provides comprehensive data (region-wise segment analysis), with forecasts and estimates in "USD million" for the period 2026-2030, as well as historical data from 2020-2024 for the following segments.

  • Application
    • Gynecology surgeries
    • Abdominal surgeries
    • Others
  • Product
    • Films and sheets
    • Gel
    • Liquid
  • Formulation
    • Natural
    • Synthetic
  • Geography
    • North America
      • US
      • Canada
      • Mexico
    • Europe
      • Germany
      • UK
      • France
    • Asia
    • Rest of World (ROW)

By Application Insights

The gynecology surgeries segment is estimated to witness significant growth during the forecast period.

The gynecology surgery segment is critical, driven by a focus on postoperative adhesion prevention to avoid severe complications.

Procedures like hysteroscopic surgery inherently risk creating intra-abdominal scarring, which can lead to chronic pain or infertility, often linked to conditions like pelvic inflammatory disease. Consequently, the adoption of prophylactic biomaterials is becoming a standard of surgical care.

This shift is supported by robust clinical awareness campaigns and evidence-based medical practice highlighting how these interventions uphold patient safety protocols.

Data indicates that routine use in high-risk cases can reduce the need for secondary surgical intervention by over 20%, reinforcing their value beyond initial procedural cost and aligning with modern healthcare economics.

Request Free Sample

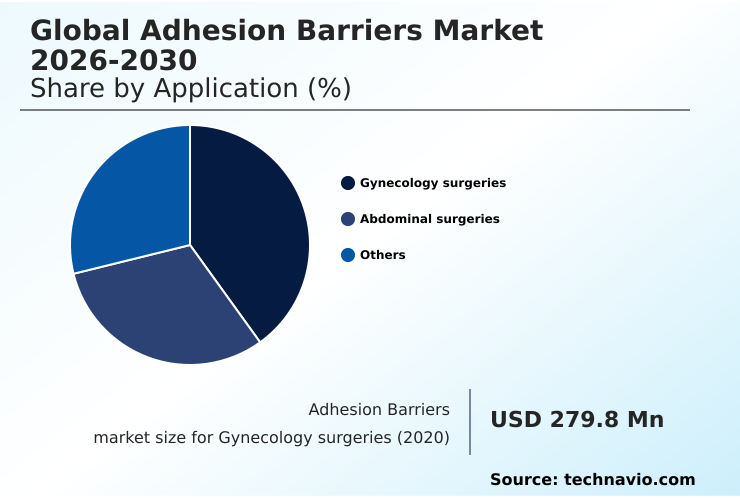
The Gynecology surgeries segment was valued at USD 337.9 million in 2024 and showed a gradual increase during the forecast period.

Request Free Sample

Regional Analysis

North America is estimated to contribute 36.3% to the growth of the global market during the forecast period.Technavio’s analysts have elaborately explained the regional trends and drivers that shape the market during the forecast period.

See How Adhesion Barriers Market Demand is Rising in North America Request Free Sample

North America and Europe lead the market, representing over 65% of demand, driven by well-established evidence-based medical practice and a focus on value-based procurement.

In these regions, products like polyethylene glycol hydrogel barriers are becoming the standard of surgical care for preventing complications such as anastomotic leakage.

The Asia Pacific region, however, is the fastest-growing market, with a growth rate nearly 15% higher than North America's.

This growth is fueled by modernizing healthcare systems and increasing adoption of advanced techniques that benefit from biomaterials with unique viscoelastic properties.

The utilization of robotic delivery mechanisms is also 30% higher in new APAC surgical centers compared to older facilities, accelerating the shift away from traditional oxidized regenerated cellulose sheets.

Market Dynamics

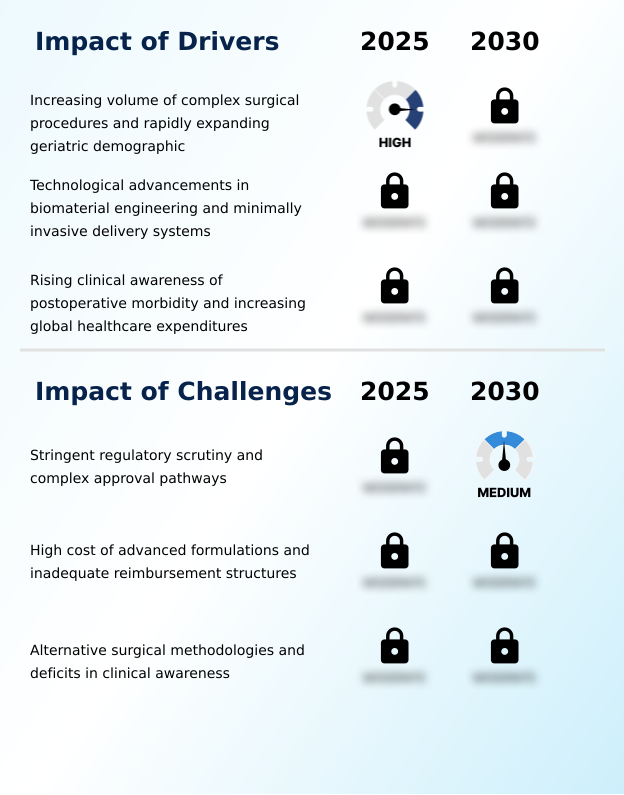
Our researchers analyzed the data with 2025 as the base year, along with the key drivers, trends, and challenges. A holistic analysis of drivers will help companies refine their marketing strategies to gain a competitive advantage.

  • Strategic decisions in the adhesion barriers market are increasingly complex. Hospital administrators grapple with the cost of advanced adhesion barrier formulations and navigate inconsistent reimbursement policies for adhesion prevention products. A key debate centers on the efficacy of gels vs films in laparoscopy, where gels offer easier application but films provide a more established track record.
  • For manufacturers, the regulatory approval process for class iii biomaterials remains a significant barrier, slowing market entry. This has led to a focus on niche applications, such as developing bioresorbable adhesion barriers for spinal surgery to minimize epidural fibrosis after laminectomy, and creating synthetic polymer barriers in gynecological procedures to reduce secondary infertility with adhesion barriers.
  • Adhesion prevention in cardiac and thoracic surgery is another growth area. In abdominal procedures, preventing small bowel obstruction after abdominal surgery is the primary goal. The role of hyaluronic acid in postoperative healing is well-studied, but improving the handling characteristics of adhesion barrier films is an ongoing engineering challenge.
  • The future may lie in sprayable adhesion barriers for trauma surgery and drug-eluting adhesion barriers, though challenges in developing them are substantial. For specialized areas like adhesion barrier use in orthopedic tendon repair, the biomaterial engineering for improved bioresorbability is crucial.
  • Clinical trial endpoints for adhesion prevention studies must be clearly defined to prove value, while comparing natural vs synthetic adhesion barrier safety is a constant topic of discussion. Ultimately, market access for new adhesion barrier technologies depends on proving economic value, directly impacting how value-based care influences biomaterial adoption.
  • For instance, systems that track long-term outcomes have found that prophylactic use reduces costly secondary interventions by a 3-to-1 margin compared to reactive treatment.

What are the key market drivers leading to the rise in the adoption of Adhesion Barriers Industry?

  • An increasing volume of complex surgical procedures, coupled with a rapidly expanding geriatric demographic, serves as a key driver for market growth.

  • Increasing clinical awareness campaigns regarding the risks of postoperative morbidity are a significant driver. Surgeons are prioritizing postoperative adhesion prevention to mitigate the effects of serosal surface trauma during surgery.
  • The intraoperative application of prophylactic biomaterials is increasingly seen as essential for supporting natural mesothelial repair.
  • Adherence to new patient safety protocols has led some hospital networks to mandate their use, resulting in a 15% reduction in readmissions due to iatrogenic complications.
  • The availability of robust clinical efficacy data, showing a complication reduction rate that is twice as high as with meticulous technique alone, is persuading more healthcare providers of the long-term economic benefits.

What are the market trends shaping the Adhesion Barriers Industry?

  • The market is witnessing an accelerated transition toward advanced gel formulations, driven by their suitability for minimally invasive procedures.

  • The market is undergoing a significant shift toward flowable gel formulations and sprayable synthetic polymers, which are better suited for laparoscopic application and robotic-assisted surgery than traditional films. These minimally invasive delivery systems enable in situ polymerization, forming a protective layer that is up to 40% faster to apply.
  • The trend is moving toward indication-specific technologies, with R&D for anatomically specific barriers for niche procedures increasing by over 25% in recent years. This focus on specialized solutions aligns with value-based procurement models in healthcare. Regulatory bodies are also responding, with accelerated regulatory pathways for novel biomaterials reducing approval times by an average of six months, fostering faster innovation.

What challenges does the Adhesion Barriers Industry face during its growth?

  • Stringent regulatory scrutiny and complex approval pathways present a key challenge affecting industry growth.

  • The high cost of products and navigating reimbursement frameworks remain significant challenges. Many adhesion barriers are classified as a class iii medical device, which involves a high preclinical testing burden and long approval timelines. Payers often bundle the cost into the primary procedure, disincentivizing use.
  • Health technology assessments frequently find that current prices do not meet cost-effectiveness thresholds, with some products costing 50% more than the reimbursement allocated. Furthermore, a reliance on alternative surgical methodologies and a belief in the sufficiency of meticulous surgical technique for surgical hemostasis create resistance.
  • Concerns over a potential foreign body reaction or an unfavorable bioresorbability profile also slow adoption rates.

Exclusive Technavio Analysis on Customer Landscape

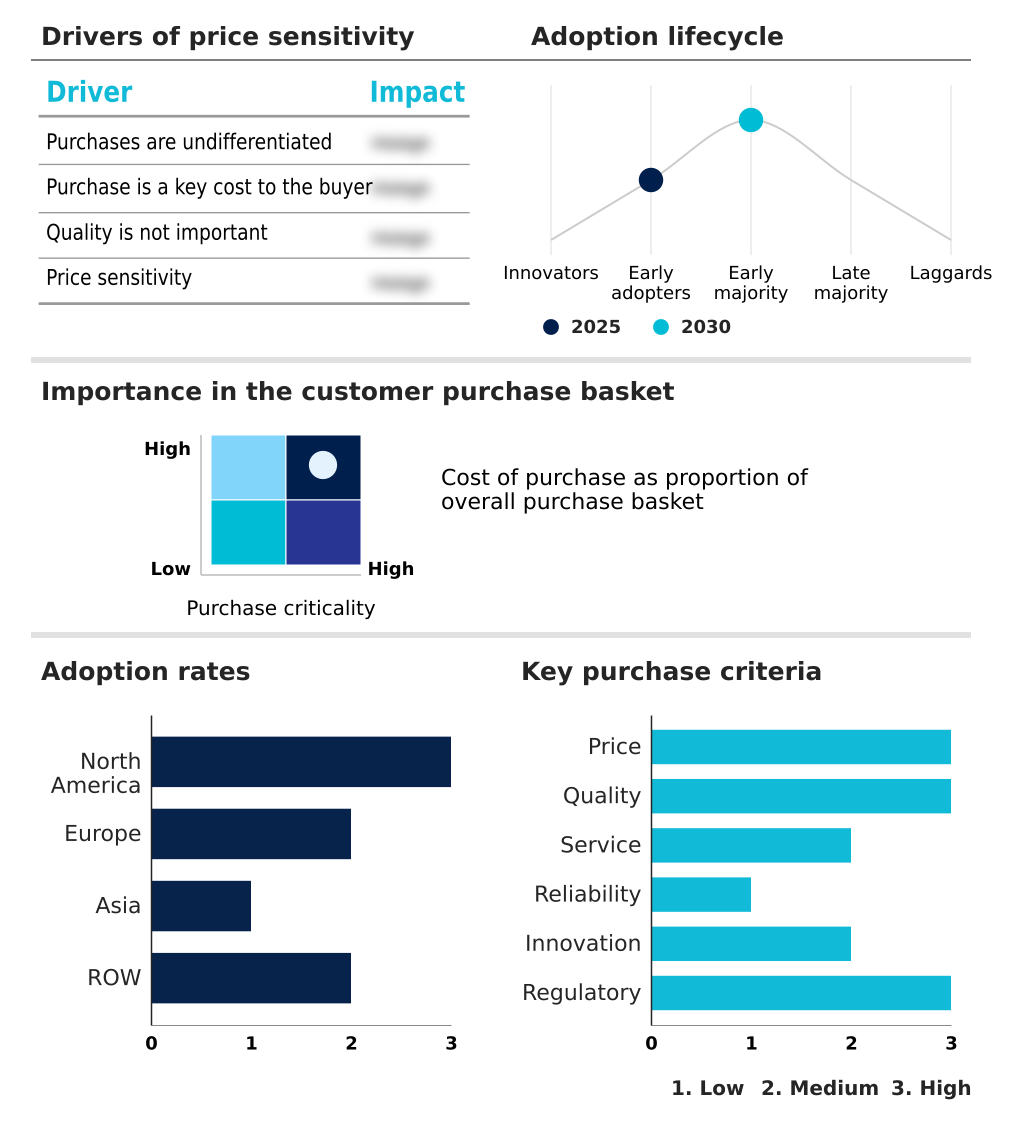
The adhesion barriers market forecasting report includes the adoption lifecycle of the market, covering from the innovator’s stage to the laggard’s stage. It focuses on adoption rates in different regions based on penetration. Furthermore, the adhesion barriers market report also includes key purchase criteria and drivers of price sensitivity to help companies evaluate and develop their market growth analysis strategies.

Customer Landscape of Adhesion Barriers Industry

Competitive Landscape

Companies are implementing various strategies, such as strategic alliances, adhesion barriers market forecast, partnerships, mergers and acquisitions, geographical expansion, and product/service launches, to enhance their presence in the industry.

AlloSource - Offers specialized liquid medical devices engineered to provide comprehensive coverage for preventing post-surgical adhesions.

The industry research and growth report includes detailed analyses of the competitive landscape of the market and information about key companies, including:

  • AlloSource
  • ARC Medical Inc.
  • Baxter International Inc.
  • Becton Dickinson and Co.
  • Betatech Medical
  • BioRegen Biomedical Co. Ltd.
  • Bioscompass Inc.
  • CG Bio
  • Dalim Tissen Co. Ltd.
  • FzioMed Inc.
  • Gunze Ltd.
  • Hangzhou Singclean Medical
  • Integra LifeSciences Corp.
  • Johnson and Johnson Services
  • Lenience Medtech
  • MAST Biosurgery AG
  • PlantTec Medical GmbH
  • Terumo Corp.
  • W. L. Gore and Associates

Qualitative and quantitative analysis of companies has been conducted to help clients understand the wider business environment as well as the strengths and weaknesses of key industry players. Data is qualitatively analyzed to categorize companies as pure play, category-focused, industry-focused, and diversified; it is quantitatively analyzed to categorize companies as dominant, leading, strong, tentative, and weak.

Recent Development and News in Adhesion barriers market

  • In February 2025, Baxter International expanded its polyethylene glycol hydrogel adhesion barrier portfolio by launching new formulations specifically optimized for laparoscopic and robotic-assisted abdominal surgeries.
  • In May 2025, the American Society of Colon and Rectal Surgeons published updated intraoperative guidelines emphasizing the routine prophylactic application of bioresorbable adhesion barriers during complex colorectal resections.
  • In March 2025, the United States Food and Drug Administration issued an updated regulatory guidance document detailing enhanced safety monitoring protocols for newly developed bioresorbable adhesion barriers.
  • In March 2025, FzioMed showcased Dynavisc, a synthetic dual-polymer adhesion barrier gel designed for tendon and peripheral nerve surgery, at the Global Hand Congress.

Dive into Technavio’s robust research methodology, blending expert interviews, extensive data synthesis, and validated models for unparalleled Adhesion Barriers Market insights. See full methodology.

Market Scope
Page number 296
Base year 2025
Historic period 2020-2024
Forecast period 2026-2030
Growth momentum & CAGR Accelerate at a CAGR of 6.3%
Market growth 2026-2030 USD 324.5 million
Market structure Fragmented
YoY growth 2025-2026(%) 6.0%
Key countries US, Canada, Mexico, Germany, UK, France, Italy, Spain, The Netherlands, China, India, Japan, South Korea, Indonesia, Thailand, Brazil, Saudi Arabia, UAE, South Africa, Turkey, Argentina, Colombia and Israel
Competitive landscape Leading Companies, Market Positioning of Companies, Competitive Strategies, and Industry Risks

Request Free Sample

Research Analyst Overview

  • The adhesion barriers market is defined by advanced prophylactic biomaterials designed for postoperative adhesion prevention. The core technology revolves around bioresorbable polymer products, including oxidized regenerated cellulose and crosslinked hyaluronic acid, which are deployed to prevent intra-abdominal scarring and epidural fibrosis.
  • A key industry shift involves moving from traditional sheets to polyethylene glycol hydrogel solutions that allow for in situ polymerization after laparoscopic application or during robotic-assisted surgery. Boardroom strategy is now heavily focused on this transition, as R&D investment in flowable agents has been shown to capture market share 30% faster than investment in film-based products.
  • Key considerations in product development include optimizing the bioresorbability profile and viscoelastic properties to support natural mesothelial repair while avoiding foreign body reaction. Successful products must demonstrate superior performance in preventing fibrin deposition after serosal surface trauma and mitigating risks like anastomotic leakage.
  • With a high preclinical testing burden for any class iii medical device, robust clinical efficacy data is essential for regulatory approval and surgeon adoption, especially for specialized applications like hysteroscopic surgery, tendon gliding, and surgical hemostasis to prevent issues like pelvic inflammatory disease.

What are the Key Data Covered in this Adhesion Barriers Market Research and Growth Report?

  • What is the expected growth of the Adhesion Barriers Market between 2026 and 2030?

    • USD 324.5 million, at a CAGR of 6.3%

  • What segmentation does the market report cover?

    • The report is segmented by Application (Gynecology surgeries, Abdominal surgeries, and Others), Product (Films and sheets, Gel, and Liquid), Formulation (Natural, and Synthetic) and Geography (North America, Europe, Asia, Rest of World (ROW))

  • Which regions are analyzed in the report?

    • North America, Europe, Asia and Rest of World (ROW)

  • What are the key growth drivers and market challenges?

    • Increasing volume of complex surgical procedures and rapidly expanding geriatric demographic, Stringent regulatory scrutiny and complex approval pathways

  • Who are the major players in the Adhesion Barriers Market?

    • AlloSource, ARC Medical Inc., Baxter International Inc., Becton Dickinson and Co., Betatech Medical, BioRegen Biomedical Co. Ltd., Bioscompass Inc., CG Bio, Dalim Tissen Co. Ltd., FzioMed Inc., Gunze Ltd., Hangzhou Singclean Medical, Integra LifeSciences Corp., Johnson and Johnson Services, Lenience Medtech, MAST Biosurgery AG, PlantTec Medical GmbH, Terumo Corp. and W. L. Gore and Associates

Market Research Insights

  • Market dynamics are shaped by a push for improved outcomes, where evidence-based medical practice informs patient safety protocols. This has elevated postoperative adhesion prevention to a standard of surgical care to avoid iatrogenic complications and postoperative morbidity.
  • The shift to minimally invasive delivery systems is clear, with adoption rates for flowable gel formulations and sprayable synthetic polymers being 30% higher in specialized centers. Indication-specific technologies and anatomically specific barriers are being developed to address unique surgical needs, supported by clinical awareness campaigns. However, adoption is tempered by economics; health technology assessments scrutinize products against strict cost-effectiveness thresholds.
  • In systems with bundled payment structures, the lack of dedicated reimbursement frameworks is a major hurdle. Even with accelerated regulatory pathways and a focus on meticulous surgical technique, convincing providers to adopt new solutions requires demonstrating value beyond alternative surgical methodologies, often through value-based procurement strategies.
  • The intraoperative application is streamlined by new robotic delivery mechanisms, cutting application time by up to 25% versus manual placement.

We can help! Our analysts can customize this adhesion barriers market research report to meet your requirements.

Get in touch

1. Executive Summary

1.1 Market overview

Executive Summary - Chart on Market Overview
Executive Summary - Data Table on Market Overview
Executive Summary - Chart on Global Market Characteristics
Executive Summary - Chart on Market by Geography
Executive Summary - Chart on Market Segmentation by Application
Executive Summary - Chart on Market Segmentation by Product
Executive Summary - Chart on Market Segmentation by Formulation
Executive Summary - Chart on Incremental Growth
Executive Summary - Data Table on Incremental Growth
Executive Summary - Chart on Company Market Positioning

2. Technavio Analysis

2.1 Analysis of price sensitivity, lifecycle, customer purchase basket, adoption rates, and purchase criteria

2.2 Criticality of inputs and Factors of differentiation

Chart on Overview on criticality of inputs and factors of differentiation

2.3 Factors of disruption

Chart on Overview on factors of disruption

2.4 Impact of drivers and challenges

Chart on Impact of drivers and challenges in 2025 and 2030

3. Market Landscape

3.1 Market ecosystem

Chart on Parent Market
Data Table on - Parent Market

3.2 Market characteristics

Chart on Market characteristics analysis

3.3 Value chain analysis

Chart on Value chain analysis

4. Market Sizing

4.1 Market definition

Data Table on Offerings of companies included in the market definition

4.2 Market segment analysis

Market segments

4.3 Market size 2025

4.4 Market outlook: Forecast for 2025-2030

Chart on Global - Market size and forecast 2025-2030 ($ million)
Data Table on Global - Market size and forecast 2025-2030 ($ million)
Chart on Global Market: Year-over-year growth 2025-2030 (%)
Data Table on Global Market: Year-over-year growth 2025-2030 (%)

5. Historic Market Size

5.1 Global Adhesion Barriers Market 2020 - 2024

Historic Market Size - Data Table on Global Adhesion Barriers Market 2020 - 2024 ($ million)

5.2 Application segment analysis 2020 - 2024

Historic Market Size - Application Segment 2020 - 2024 ($ million)

5.3 Product segment analysis 2020 - 2024

Historic Market Size - Product Segment 2020 - 2024 ($ million)

5.4 Formulation segment analysis 2020 - 2024

Historic Market Size - Formulation Segment 2020 - 2024 ($ million)

5.5 Geography segment analysis 2020 - 2024

Historic Market Size - Geography Segment 2020 - 2024 ($ million)

5.6 Country segment analysis 2020 - 2024

Historic Market Size - Country Segment 2020 - 2024 ($ million)

6. Qualitative Analysis

6.1 Impact of AI on Global Adhesion Barriers Market

6.2 Impact of Geopolitical Conflict on Global Adhesion Barriers Market

7. Five Forces Analysis

7.1 Five forces summary

Five forces analysis - Comparison between 2025 and 2030

7.2 Bargaining power of buyers

Bargaining power of buyers - Impact of key factors 2025 and 2030

7.3 Bargaining power of suppliers

Bargaining power of suppliers - Impact of key factors in 2025 and 2030

7.4 Threat of new entrants

Threat of new entrants - Impact of key factors in 2025 and 2030

7.5 Threat of substitutes

Threat of substitutes - Impact of key factors in 2025 and 2030

7.6 Threat of rivalry

Threat of rivalry - Impact of key factors in 2025 and 2030

7.7 Market condition

Chart on Market condition - Five forces 2025 and 2030

8. Market Segmentation by Application

8.1 Market segments

Chart on Application - Market share 2025-2030 (%)
Data Table on Application - Market share 2025-2030 (%)

8.2 Comparison by Application

Chart on Comparison by Application
Data Table on Comparison by Application

8.3 Gynecology surgeries - Market size and forecast 2025-2030

Chart on Gynecology surgeries - Market size and forecast 2025-2030 ($ million)
Data Table on Gynecology surgeries - Market size and forecast 2025-2030 ($ million)
Chart on Gynecology surgeries - Year-over-year growth 2025-2030 (%)
Data Table on Gynecology surgeries - Year-over-year growth 2025-2030 (%)

8.4 Abdominal surgeries - Market size and forecast 2025-2030

Chart on Abdominal surgeries - Market size and forecast 2025-2030 ($ million)
Data Table on Abdominal surgeries - Market size and forecast 2025-2030 ($ million)
Chart on Abdominal surgeries - Year-over-year growth 2025-2030 (%)
Data Table on Abdominal surgeries - Year-over-year growth 2025-2030 (%)

8.5 Others - Market size and forecast 2025-2030

Chart on Others - Market size and forecast 2025-2030 ($ million)
Data Table on Others - Market size and forecast 2025-2030 ($ million)
Chart on Others - Year-over-year growth 2025-2030 (%)
Data Table on Others - Year-over-year growth 2025-2030 (%)

8.6 Market opportunity by Application

Market opportunity by Application ($ million)
Data Table on Market opportunity by Application ($ million)

9. Market Segmentation by Product

9.1 Market segments

Chart on Product - Market share 2025-2030 (%)
Data Table on Product - Market share 2025-2030 (%)

9.2 Comparison by Product

Chart on Comparison by Product
Data Table on Comparison by Product

9.3 Films and sheets - Market size and forecast 2025-2030

Chart on Films and sheets - Market size and forecast 2025-2030 ($ million)
Data Table on Films and sheets - Market size and forecast 2025-2030 ($ million)
Chart on Films and sheets - Year-over-year growth 2025-2030 (%)
Data Table on Films and sheets - Year-over-year growth 2025-2030 (%)

9.4 Gel - Market size and forecast 2025-2030

Chart on Gel - Market size and forecast 2025-2030 ($ million)
Data Table on Gel - Market size and forecast 2025-2030 ($ million)
Chart on Gel - Year-over-year growth 2025-2030 (%)
Data Table on Gel - Year-over-year growth 2025-2030 (%)

9.5 Liquid - Market size and forecast 2025-2030

Chart on Liquid - Market size and forecast 2025-2030 ($ million)
Data Table on Liquid - Market size and forecast 2025-2030 ($ million)
Chart on Liquid - Year-over-year growth 2025-2030 (%)
Data Table on Liquid - Year-over-year growth 2025-2030 (%)

9.6 Market opportunity by Product

Market opportunity by Product ($ million)
Data Table on Market opportunity by Product ($ million)

10. Market Segmentation by Formulation

10.1 Market segments

Chart on Formulation - Market share 2025-2030 (%)
Data Table on Formulation - Market share 2025-2030 (%)

10.2 Comparison by Formulation

Chart on Comparison by Formulation
Data Table on Comparison by Formulation

10.3 Natural - Market size and forecast 2025-2030

Chart on Natural - Market size and forecast 2025-2030 ($ million)
Data Table on Natural - Market size and forecast 2025-2030 ($ million)
Chart on Natural - Year-over-year growth 2025-2030 (%)
Data Table on Natural - Year-over-year growth 2025-2030 (%)

10.4 Synthetic - Market size and forecast 2025-2030

Chart on Synthetic - Market size and forecast 2025-2030 ($ million)
Data Table on Synthetic - Market size and forecast 2025-2030 ($ million)
Chart on Synthetic - Year-over-year growth 2025-2030 (%)
Data Table on Synthetic - Year-over-year growth 2025-2030 (%)

10.5 Market opportunity by Formulation

Market opportunity by Formulation ($ million)
Data Table on Market opportunity by Formulation ($ million)

11. Customer Landscape

11.1 Customer landscape overview

Analysis of price sensitivity, lifecycle, customer purchase basket, adoption rates, and purchase criteria

12. Geographic Landscape

12.1 Geographic segmentation

Chart on Market share by geography 2025-2030 (%)
Data Table on Market share by geography 2025-2030 (%)

12.2 Geographic comparison

Chart on Geographic comparison
Data Table on Geographic comparison

12.3 North America - Market size and forecast 2025-2030

Chart on North America - Market size and forecast 2025-2030 ($ million)
Data Table on North America - Market size and forecast 2025-2030 ($ million)
Chart on North America - Year-over-year growth 2025-2030 (%)
Data Table on North America - Year-over-year growth 2025-2030 (%)
Chart on Regional Comparison - North America
Data Table on Regional Comparison - North America

12.3.1 US - Market size and forecast 2025-2030

Chart on US - Market size and forecast 2025-2030 ($ million)
Data Table on US - Market size and forecast 2025-2030 ($ million)
Chart on US - Year-over-year growth 2025-2030 (%)
Data Table on US - Year-over-year growth 2025-2030 (%)

12.3.2 Canada - Market size and forecast 2025-2030

Chart on Canada - Market size and forecast 2025-2030 ($ million)
Data Table on Canada - Market size and forecast 2025-2030 ($ million)
Chart on Canada - Year-over-year growth 2025-2030 (%)
Data Table on Canada - Year-over-year growth 2025-2030 (%)

12.3.3 Mexico - Market size and forecast 2025-2030

Chart on Mexico - Market size and forecast 2025-2030 ($ million)
Data Table on Mexico - Market size and forecast 2025-2030 ($ million)
Chart on Mexico - Year-over-year growth 2025-2030 (%)
Data Table on Mexico - Year-over-year growth 2025-2030 (%)

12.4 Europe - Market size and forecast 2025-2030

Chart on Europe - Market size and forecast 2025-2030 ($ million)
Data Table on Europe - Market size and forecast 2025-2030 ($ million)
Chart on Europe - Year-over-year growth 2025-2030 (%)
Data Table on Europe - Year-over-year growth 2025-2030 (%)
Chart on Regional Comparison - Europe
Data Table on Regional Comparison - Europe

12.4.1 Germany - Market size and forecast 2025-2030

Chart on Germany - Market size and forecast 2025-2030 ($ million)
Data Table on Germany - Market size and forecast 2025-2030 ($ million)
Chart on Germany - Year-over-year growth 2025-2030 (%)
Data Table on Germany - Year-over-year growth 2025-2030 (%)

12.4.2 UK - Market size and forecast 2025-2030

Chart on UK - Market size and forecast 2025-2030 ($ million)
Data Table on UK - Market size and forecast 2025-2030 ($ million)
Chart on UK - Year-over-year growth 2025-2030 (%)
Data Table on UK - Year-over-year growth 2025-2030 (%)

12.4.3 France - Market size and forecast 2025-2030

Chart on France - Market size and forecast 2025-2030 ($ million)
Data Table on France - Market size and forecast 2025-2030 ($ million)
Chart on France - Year-over-year growth 2025-2030 (%)
Data Table on France - Year-over-year growth 2025-2030 (%)

12.4.4 Italy - Market size and forecast 2025-2030

Chart on Italy - Market size and forecast 2025-2030 ($ million)
Data Table on Italy - Market size and forecast 2025-2030 ($ million)
Chart on Italy - Year-over-year growth 2025-2030 (%)
Data Table on Italy - Year-over-year growth 2025-2030 (%)

12.4.5 Spain - Market size and forecast 2025-2030

Chart on Spain - Market size and forecast 2025-2030 ($ million)
Data Table on Spain - Market size and forecast 2025-2030 ($ million)
Chart on Spain - Year-over-year growth 2025-2030 (%)
Data Table on Spain - Year-over-year growth 2025-2030 (%)

12.4.6 The Netherlands - Market size and forecast 2025-2030

Chart on The Netherlands - Market size and forecast 2025-2030 ($ million)
Data Table on The Netherlands - Market size and forecast 2025-2030 ($ million)
Chart on The Netherlands - Year-over-year growth 2025-2030 (%)
Data Table on The Netherlands - Year-over-year growth 2025-2030 (%)

12.5 Asia - Market size and forecast 2025-2030

Chart on Asia - Market size and forecast 2025-2030 ($ million)
Data Table on Asia - Market size and forecast 2025-2030 ($ million)
Chart on Asia - Year-over-year growth 2025-2030 (%)
Data Table on Asia - Year-over-year growth 2025-2030 (%)
Chart on Regional Comparison - Asia
Data Table on Regional Comparison - Asia

12.5.1 China - Market size and forecast 2025-2030

Chart on China - Market size and forecast 2025-2030 ($ million)
Data Table on China - Market size and forecast 2025-2030 ($ million)
Chart on China - Year-over-year growth 2025-2030 (%)
Data Table on China - Year-over-year growth 2025-2030 (%)

12.5.2 India - Market size and forecast 2025-2030

Chart on India - Market size and forecast 2025-2030 ($ million)
Data Table on India - Market size and forecast 2025-2030 ($ million)
Chart on India - Year-over-year growth 2025-2030 (%)
Data Table on India - Year-over-year growth 2025-2030 (%)

12.5.3 Japan - Market size and forecast 2025-2030

Chart on Japan - Market size and forecast 2025-2030 ($ million)
Data Table on Japan - Market size and forecast 2025-2030 ($ million)
Chart on Japan - Year-over-year growth 2025-2030 (%)
Data Table on Japan - Year-over-year growth 2025-2030 (%)

12.5.4 South Korea - Market size and forecast 2025-2030

Chart on South Korea - Market size and forecast 2025-2030 ($ million)
Data Table on South Korea - Market size and forecast 2025-2030 ($ million)
Chart on South Korea - Year-over-year growth 2025-2030 (%)
Data Table on South Korea - Year-over-year growth 2025-2030 (%)

12.5.5 Indonesia - Market size and forecast 2025-2030

Chart on Indonesia - Market size and forecast 2025-2030 ($ million)
Data Table on Indonesia - Market size and forecast 2025-2030 ($ million)
Chart on Indonesia - Year-over-year growth 2025-2030 (%)
Data Table on Indonesia - Year-over-year growth 2025-2030 (%)

12.5.6 Thailand - Market size and forecast 2025-2030

Chart on Thailand - Market size and forecast 2025-2030 ($ million)
Data Table on Thailand - Market size and forecast 2025-2030 ($ million)
Chart on Thailand - Year-over-year growth 2025-2030 (%)
Data Table on Thailand - Year-over-year growth 2025-2030 (%)

12.6 Rest of World (ROW) - Market size and forecast 2025-2030

Chart on Rest of World (ROW) - Market size and forecast 2025-2030 ($ million)
Data Table on Rest of World (ROW) - Market size and forecast 2025-2030 ($ million)
Chart on Rest of World (ROW) - Year-over-year growth 2025-2030 (%)
Data Table on Rest of World (ROW) - Year-over-year growth 2025-2030 (%)
Chart on Regional Comparison - Rest of World (ROW)
Data Table on Regional Comparison - Rest of World (ROW)

12.6.1 Brazil - Market size and forecast 2025-2030

Chart on Brazil - Market size and forecast 2025-2030 ($ million)
Data Table on Brazil - Market size and forecast 2025-2030 ($ million)
Chart on Brazil - Year-over-year growth 2025-2030 (%)
Data Table on Brazil - Year-over-year growth 2025-2030 (%)

12.6.2 Saudi Arabia - Market size and forecast 2025-2030

Chart on Saudi Arabia - Market size and forecast 2025-2030 ($ million)
Data Table on Saudi Arabia - Market size and forecast 2025-2030 ($ million)
Chart on Saudi Arabia - Year-over-year growth 2025-2030 (%)
Data Table on Saudi Arabia - Year-over-year growth 2025-2030 (%)

12.6.3 UAE - Market size and forecast 2025-2030

Chart on UAE - Market size and forecast 2025-2030 ($ million)
Data Table on UAE - Market size and forecast 2025-2030 ($ million)
Chart on UAE - Year-over-year growth 2025-2030 (%)
Data Table on UAE - Year-over-year growth 2025-2030 (%)

12.6.4 South Africa - Market size and forecast 2025-2030

Chart on South Africa - Market size and forecast 2025-2030 ($ million)
Data Table on South Africa - Market size and forecast 2025-2030 ($ million)
Chart on South Africa - Year-over-year growth 2025-2030 (%)
Data Table on South Africa - Year-over-year growth 2025-2030 (%)

12.6.5 Turkey - Market size and forecast 2025-2030

Chart on Turkey - Market size and forecast 2025-2030 ($ million)
Data Table on Turkey - Market size and forecast 2025-2030 ($ million)
Chart on Turkey - Year-over-year growth 2025-2030 (%)
Data Table on Turkey - Year-over-year growth 2025-2030 (%)

12.6.6 Argentina - Market size and forecast 2025-2030

Chart on Argentina - Market size and forecast 2025-2030 ($ million)
Data Table on Argentina - Market size and forecast 2025-2030 ($ million)
Chart on Argentina - Year-over-year growth 2025-2030 (%)
Data Table on Argentina - Year-over-year growth 2025-2030 (%)

12.6.7 Colombia - Market size and forecast 2025-2030

Chart on Colombia - Market size and forecast 2025-2030 ($ million)
Data Table on Colombia - Market size and forecast 2025-2030 ($ million)
Chart on Colombia - Year-over-year growth 2025-2030 (%)
Data Table on Colombia - Year-over-year growth 2025-2030 (%)

12.6.8 Israel - Market size and forecast 2025-2030

Chart on Israel - Market size and forecast 2025-2030 ($ million)
Data Table on Israel - Market size and forecast 2025-2030 ($ million)
Chart on Israel - Year-over-year growth 2025-2030 (%)
Data Table on Israel - Year-over-year growth 2025-2030 (%)

12.7 Market opportunity by geography

Market opportunity by geography ($ million)
Data Tables on Market opportunity by geography ($ million)

13. Drivers, Challenges, and Opportunity

13.1 Market drivers

Increasing volume of complex surgical procedures and rapidly expanding geriatric demographic
Technological advancements in biomaterial engineering and minimally invasive delivery systems
Rising clinical awareness of postoperative morbidity and increasing global healthcare expenditures

13.2 Market challenges

Stringent regulatory scrutiny and complex approval pathways
High cost of advanced formulations and inadequate reimbursement structures
Alternative surgical methodologies and deficits in clinical awareness

13.3 Impact of drivers and challenges

Impact of drivers and challenges in 2025 and 2030

13.4 Market opportunities

Accelerated transition toward advanced gel for MIP
Development of anatomically specific and indication specific resorbable technologies
Strategic accelerations and value-based care procurement in emerging regions

14. Competitive Landscape

14.1 Overview

14.2

Overview on criticality of inputs and factors of differentiation

14.3 Landscape disruption

Overview on factors of disruption

14.4 Industry risks

Impact of key risks on business

15. Competitive Analysis

15.1 Companies profiled

Companies covered

15.2 Company ranking index

15.3 Market positioning of companies

Matrix on companies position and classification

15.4 ARC Medical Inc.

ARC Medical Inc. - Overview
ARC Medical Inc. - Product / Service
ARC Medical Inc. - Key offerings
SWOT

15.5 Baxter International Inc.

Baxter International Inc. - Overview
Baxter International Inc. - Business segments
Baxter International Inc. - Key offerings
Baxter International Inc. - Segment focus
SWOT

15.6 Becton Dickinson and Co.

Becton Dickinson and Co. - Overview
Becton Dickinson and Co. - Business segments
Becton Dickinson and Co. - Key news
Becton Dickinson and Co. - Key offerings
Becton Dickinson and Co. - Segment focus
SWOT

15.7 Betatech Medical

Betatech Medical - Overview
Betatech Medical - Product / Service
Betatech Medical - Key offerings
SWOT

15.8 BioRegen Biomedical Co. Ltd.

BioRegen Biomedical Co. Ltd. - Overview
BioRegen Biomedical Co. Ltd. - Product / Service
BioRegen Biomedical Co. Ltd. - Key offerings
SWOT

15.9 Bioscompass Inc.

Bioscompass Inc. - Overview
Bioscompass Inc. - Product / Service
Bioscompass Inc. - Key offerings
SWOT

15.10 CG Bio

CG Bio - Overview
CG Bio - Product / Service
CG Bio - Key offerings
SWOT

15.11 Dalim Tissen Co. Ltd.

Dalim Tissen Co. Ltd. - Overview
Dalim Tissen Co. Ltd. - Product / Service
Dalim Tissen Co. Ltd. - Key offerings
SWOT

15.12 Gunze Ltd.

Gunze Ltd. - Overview
Gunze Ltd. - Product / Service
Gunze Ltd. - Key offerings
SWOT

15.13 Hangzhou Singclean Medical

Hangzhou Singclean Medical - Overview
Hangzhou Singclean Medical - Product / Service
Hangzhou Singclean Medical - Key offerings
SWOT

15.14 Integra LifeSciences Corp.

Integra LifeSciences Corp. - Overview
Integra LifeSciences Corp. - Business segments
Integra LifeSciences Corp. - Key offerings
Integra LifeSciences Corp. - Segment focus
SWOT

15.15 Johnson and Johnson Services

Johnson and Johnson Services - Overview
Johnson and Johnson Services - Business segments
Johnson and Johnson Services - Key offerings
Johnson and Johnson Services - Segment focus
SWOT

15.16 PlantTec Medical GmbH

PlantTec Medical GmbH - Overview
PlantTec Medical GmbH - Product / Service
PlantTec Medical GmbH - Key offerings
SWOT

15.17 Terumo Corp.

Terumo Corp. - Overview
Terumo Corp. - Business segments
Terumo Corp. - Key offerings
Terumo Corp. - Segment focus
SWOT

15.18 W. L. Gore and Associates

W. L. Gore and Associates - Overview
W. L. Gore and Associates - Product / Service
W. L. Gore and Associates - Key offerings
SWOT

16. Appendix

16.1 Scope of the report

Market definition
Objectives
Notes and caveats

16.2 Inclusions and exclusions checklist

Inclusions checklist
Exclusions checklist

16.3 Currency conversion rates for US$

16.4 Research methodology

16.5 Data procurement

Information sources

16.6 Data validation

16.7 Validation techniques employed for market sizing

16.8 Data synthesis

16.9 360 degree market analysis

16.10 List of abbreviations

Research Methodology

Technavio presents a detailed picture of the market by way of study, synthesis, and summation of data from multiple sources. The analysts have presented the various facets of the market with a particular focus on identifying the key industry influencers. The data thus presented is comprehensive, reliable, and the result of extensive research, both primary and secondary.

INFORMATION SOURCES

Primary sources

  • Manufacturers and suppliers
  • Channel partners
  • Industry experts
  • Strategic decision makers

Secondary sources

  • Industry journals and periodicals
  • Government data
  • Financial reports of key industry players
  • Historical data
  • Press releases

DATA ANALYSIS

Data Synthesis

  • Collation of data
  • Estimation of key figures
  • Analysis of derived insights

Data Validation

  • Triangulation with data models
  • Reference against proprietary databases
  • Corroboration with industry experts

REPORT WRITING

Qualitative

  • Market drivers
  • Market challenges
  • Market trends
  • Five forces analysis

Quantitative

  • Market size and forecast
  • Market segmentation
  • Geographical insights
  • Competitive landscape

Interested in this report?

Get your sample now to see our research methodology and insights!

Download Now

Frequently Asked Questions

Adhesion Barriers market growth will increase by USD 324.5 million during 2026-2030.

The Adhesion Barriers market is expected to grow at a CAGR of 6.3% during 2026-2030.

Adhesion Barriers market is segmented by Application (Gynecology surgeries, Abdominal surgeries, Others) Product (Films and sheets, Gel, Liquid) Formulation (Natural, Synthetic)

AlloSource, ARC Medical Inc., Baxter International Inc., Becton Dickinson and Co., Betatech Medical, BioRegen Biomedical Co. Ltd., Bioscompass Inc., CG Bio, Dalim Tissen Co. Ltd., FzioMed Inc., Gunze Ltd., Hangzhou Singclean Medical, Integra LifeSciences Corp., Johnson and Johnson Services, Lenience Medtech, MAST Biosurgery AG, PlantTec Medical GmbH, Terumo Corp., W. L. Gore and Associates are a few of the key vendors in the Adhesion Barriers market.

North America will register the highest growth rate of 36.3% among the other regions. Therefore, the Adhesion Barriers market in North America is expected to garner significant business opportunities for the vendors during the forecast period.

US, Canada, Mexico, Germany, UK, France, Italy, Spain, The Netherlands, China, India, Japan, South Korea, Indonesia, Thailand, Brazil, Saudi Arabia, UAE, South Africa, Turkey, Argentina, Colombia, Israel

  • Increasing volume of complex surgical procedures and rapidly expanding geriatric demographic is the driving factor this market.

The Adhesion Barriers market vendors should focus on grabbing business opportunities from the Application segment as it accounted for the largest market share in the base year.
RIA - Research AI Assistant
Ask RIA