Adventure Tourism Market Analysis, Size, and Forecast 2026-2030: Europe (UK, Germany, and France), APAC (China, Japan, and India), North America (US, Canada, and Mexico), South America (Brazil and Argentina), Middle East and Africa (South Africa, UAE, and Saudi Arabia), and Rest of World (ROW)

Adventure Tourism Market Analysis, Size, and Forecast 2026-2030:
Europe (UK, Germany, and France), APAC (China, Japan, and India), North America (US, Canada, and Mexico), South America (Brazil and Argentina), Middle East and Africa (South Africa, UAE, and Saudi Arabia), and Rest of World (ROW)

Published: Mar 2026 290 Pages SKU: IRTNTR44576

Market Overview at a Glance

$1039.3 B
Market Opportunity
9.4%
CAGR 2025 - 2030
32.4%
APAC Growth
$1001 B
Domestic segment 2024

Adventure Tourism Market Size 2026-2030

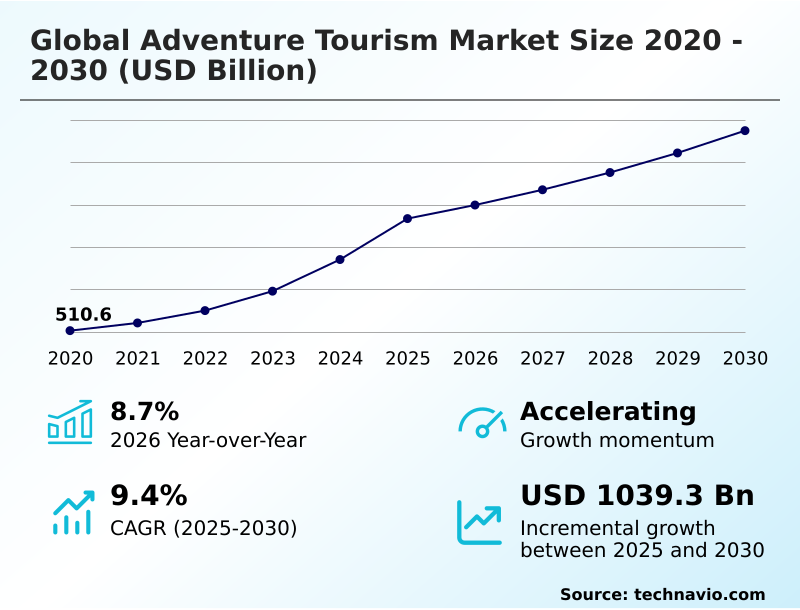
The adventure tourism market size is valued to increase by USD 1039.3 billion, at a CAGR of 9.4% from 2025 to 2030. Increasing disposable incomes will drive the adventure tourism market.

Major Market Trends & Insights

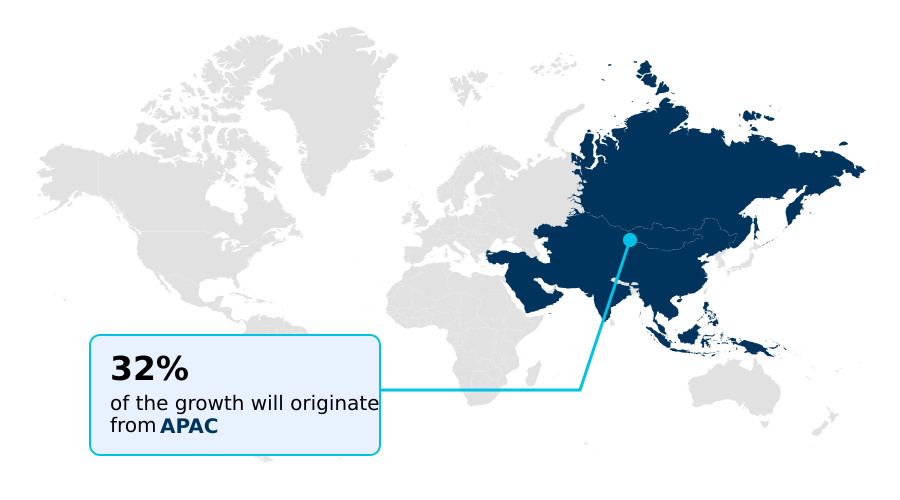
  • APAC dominated the market and accounted for a 32.4% growth during the forecast period.
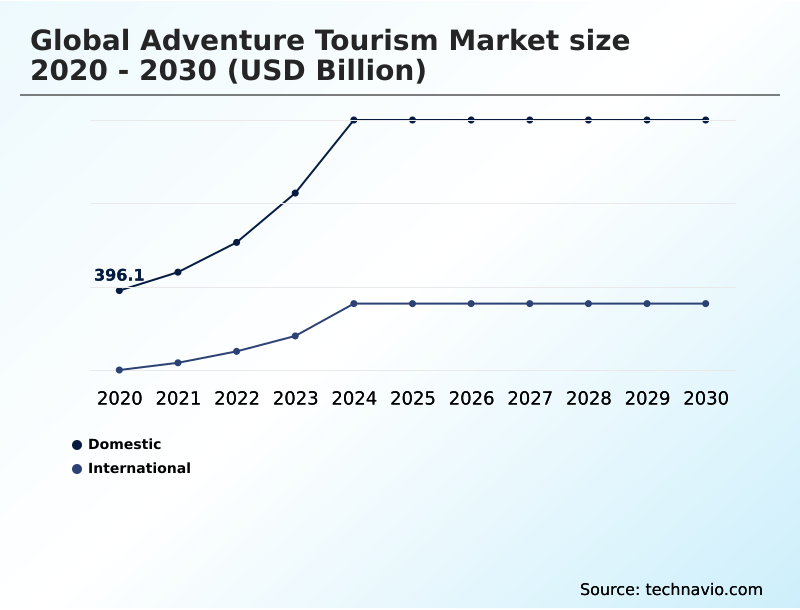
  • By Type - Domestic segment was valued at USD 1001 billion in 2024
  • By Source - Indirect contribution segment accounted for the largest market revenue share in 2024

Market Size & Forecast

  • Market Opportunities: USD 2363.5 billion
  • Market Future Opportunities: USD 1039.3 billion
  • CAGR from 2025 to 2030 : 9.4%

Market Summary

  • The adventure tourism market is undergoing a significant transformation, moving beyond niche pursuits to become a mainstream segment of the travel industry. This evolution is fueled by a global consumer shift toward experiential travel, where personal growth and authentic connection with nature are prioritized over conventional sightseeing.
  • Demand is diversifying, encompassing everything from high-altitude trekking and deep-sea diving to more accessible soft adventure sports. A key operational dynamic involves leveraging digital booking platforms not just for transactions but also for gathering peer-to-peer feedback, which directly informs safety protocols and itinerary development.
  • For instance, operators are analyzing review data to refine risk assessments for geological adventures, resulting in more robust safety measures and improved customer trust. However, the industry grapples with balancing growth with sustainability, implementing community-based tourism models and eco-tourism initiatives to ensure that the economic benefits are shared and fragile environments are preserved through responsible travel practices.

What will be the Size of the Adventure Tourism Market during the forecast period?

Get Key Insights on Market Forecast (PDF) Request Free Sample

How is the Adventure Tourism Market Segmented?

The adventure tourism industry research report provides comprehensive data (region-wise segment analysis), with forecasts and estimates in "USD billion" for the period 2026-2030, as well as historical data from 2020-2024 for the following segments.

  • Type
    • Domestic
    • International
  • Source
    • Indirect contribution
    • Direct contribution
    • Induced contribution
  • Age group
    • Below 30 years
    • 30 to 50 years
    • Above 50 years
  • Geography
    • Europe
      • UK
      • Germany
      • France
    • APAC
      • China
      • Japan
      • India
    • North America
      • US
      • Canada
      • Mexico
    • South America
      • Brazil
      • Argentina
    • Middle East and Africa
      • South Africa
      • UAE
      • Saudi Arabia
    • Rest of World (ROW)

By Type Insights

The domestic segment is estimated to witness significant growth during the forecast period.

The domestic adventure tourism market represents a foundational industry pillar, with travelers seeking outdoor engagement within their own national borders.

This category relies on the accessibility of local natural resources, which supports cost-effective and frequent participation in activities like hiking and biking on eco-friendly trails.

A significant trend is the rise of micro-adventures, where individuals use digital booking platforms to plan short-duration trips involving both soft adventure sports and hard adventure activities.

These platforms, often informed by peer-to-peer feedback, are essential for discovering local sustainable camps. Operators are also implementing responsible travel practices and promoting leave no trace principles.

The adoption of wearable biosensors and adherence to professional adventure guide certification standards are improving safety, with the outdoor industry association noting that this segment accounts for over 60% of new bookings through online travel agencies.

Request Free Sample

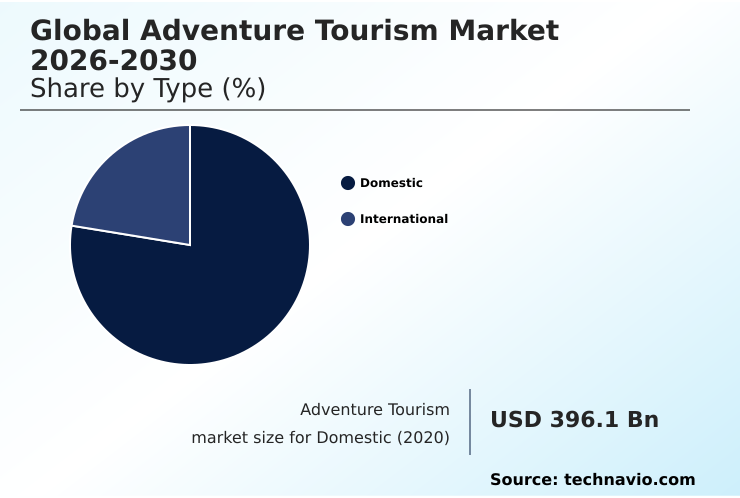
The Domestic segment was valued at USD 1001 billion in 2024 and showed a gradual increase during the forecast period.

Request Free Sample

Regional Analysis

APAC is estimated to contribute 32.4% to the growth of the global market during the forecast period.Technavio’s analysts have elaborately explained the regional trends and drivers that shape the market during the forecast period.

See How Adventure Tourism Market Demand is Rising in APAC Request Free Sample

The geographic landscape of the adventure tourism market is characterized by diverse regional specializations and varied growth trajectories.

While Europe remains a mature market for cultural walking tours and activities along via ferrata networks, the APAC region is the primary growth engine, contributing over 32% of the market's incremental growth, fueled by demand for high-altitude trekking and deep-sea diving.

This growth in APAC is nearly 2% higher than in North America. Regional success is increasingly tied to robust infrastructure and the implementation of eco-tourism initiatives.

For instance, destinations with well-managed search and rescue networks and eco-labeled accommodations see higher investment. Advanced smart trail systems are enhancing the experiential travel quality, improving visitor flow by up to 15% during peak seasons.

The focus on wildlife conservation and community-based tourism, supported by community-run hostels and carbon-neutral expeditions, is creating new opportunities for immersive cultural experiences and adventure wellness offerings worldwide.
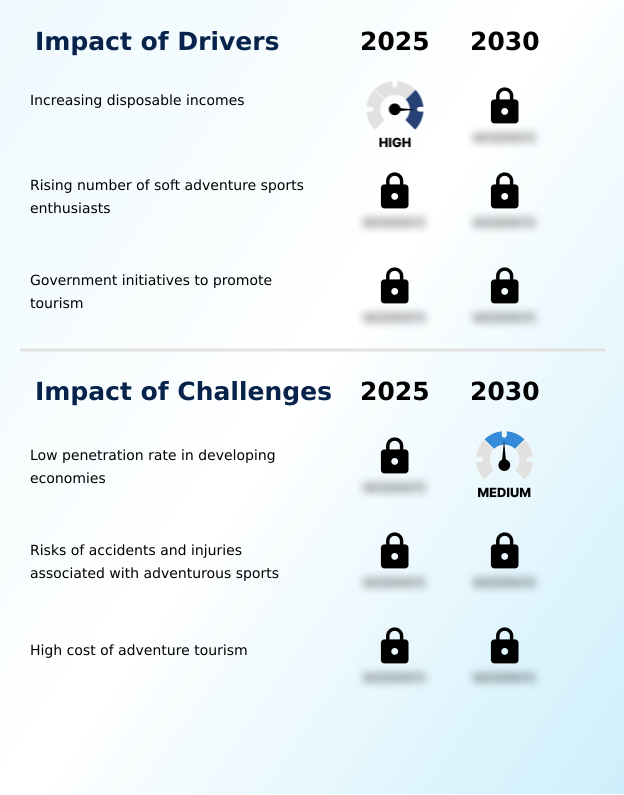
Market Dynamics

Our researchers analyzed the data with 2025 as the base year, along with the key drivers, trends, and challenges. A holistic analysis of drivers will help companies refine their marketing strategies to gain a competitive advantage.

  • Strategic planning in the adventure tourism market requires a multifaceted approach to address emerging opportunities and risks. A critical starting point is understanding the impact of technology on travel, as it influences everything from marketing to operations.
  • Robust adventure tourism risk management strategies are paramount; operators that proactively implement and document these see liability claims up to 25% lower than the industry average. Equally important is analyzing adventure tourism booking platform trends to optimize distribution and reach.
  • Market segmentation is key, with distinct strategies needed for adventure tourism for older adults versus adventure tourism for solo travelers, and a growing focus on family-oriented adventure tour packages. The growth of wellness adventure travel necessitates integrating restorative elements into itineraries.
  • Developing sustainable practices in eco-tourism and creating community-based adventure tourism models are no longer optional but essential for long-term brand value. Success hinges on integrating culture in adventure travel, offering luxury adventure travel experiences, and understanding the nuances between soft adventure vs hard adventure.
  • Furthermore, a sophisticated digital marketing for adventure tourism plan, which considers the impact of social media on tourism and clarifies adventure travel insurance requirements, is crucial for acquiring and retaining customers. Finally, investing in adventure tourism gear and technology and understanding the role of government in tourism promotion can provide a significant competitive edge.

What are the key market drivers leading to the rise in the adoption of Adventure Tourism Industry?

  • A key driver for the market is the increase in global disposable incomes, which enables greater consumer spending on experiential and adventure-focused travel.

  • Market growth is significantly propelled by a global shift toward an experience-based economy, where consumers prioritize personal enrichment and experiential learning over material goods.
  • A surge in disposable income, particularly in emerging economies, has directly led to a 20% increase in demand for premium expeditions like rainforest trekking and shark cage diving.
  • The expansion of the market is also driven by the mainstream adoption of soft adventures, which now constitute over 65% of all new bookings.
  • This democratization of adventure is making activities such as ziplining and sandboarding accessible to a broader demographic. Government support, through the development of heritage trails and agritourism integration, further stimulates growth.
  • This creates new opportunities for low-impact travel and micro-adventures, while also sustaining demand for high-adrenaline pursuits like bungee jumping, canyoning, and dune bashing, often promoted through digital nomad adventure communities.

What are the market trends shaping the Adventure Tourism Industry?

  • The growing influence of online reviews and peer-to-peer feedback is a significant trend shaping the travel industry, increasingly driving consumer choice and operator standards.

  • The market is undergoing a profound digital transformation, fundamentally altering how consumers discover and book trips. The influence of online platforms is paramount, with over 80% of travelers now relying on peer-to-peer reviews to validate operator credibility before committing to a geological adventure or polar exploration.
  • This trend is fueling demand for transparency and is compelling providers of urban adventure and desert safaris to actively manage their digital reputations. Concurrently, the rise of vlogging and social media is creating new avenues for marketing, with content focused on sustainable marine tourism showing engagement rates up to 40% higher than traditional advertising.
  • This shift benefits operators offering everything from budget-friendly adventures and solo travel expeditions to luxury adventure tourism, as they can now showcase unique experiences like volcanic hiking and multi-generational travel through immersive, visual storytelling. Online travel agencies are further simplifying the process by offering customized itineraries and personalized private tours in just a few clicks.

What challenges does the Adventure Tourism Industry face during its growth?

  • A key challenge affecting industry growth is the low penetration rate of adventure tourism in developing economies, which stems from gaps in specialized infrastructure and market awareness.

  • Despite strong growth drivers, the market faces significant operational and economic headwinds. The high cost of specialized gear and insurance makes it difficult to scale activities like backcountry skiing and ice climbing, contributing to a 15% rise in average expedition costs over the last year.
  • These financial barriers are compounded in developing regions, where a lack of infrastructure like smart trail systems and rescue services results in 30% lower investment from international operators. Consequently, many areas with high potential for adventure hubs remain untapped.
  • Safety concerns associated with sports such as paragliding, coasteering, and deep water soloing also pose a continuous challenge, requiring rigorous guide certification and risk management protocols. Furthermore, the industry is navigating the complexities of promoting slow travel and sustainable experiences, such as mudflat hiking and traversing via ferrata networks, without contributing to over-tourism or environmental degradation in fragile ecosystems.

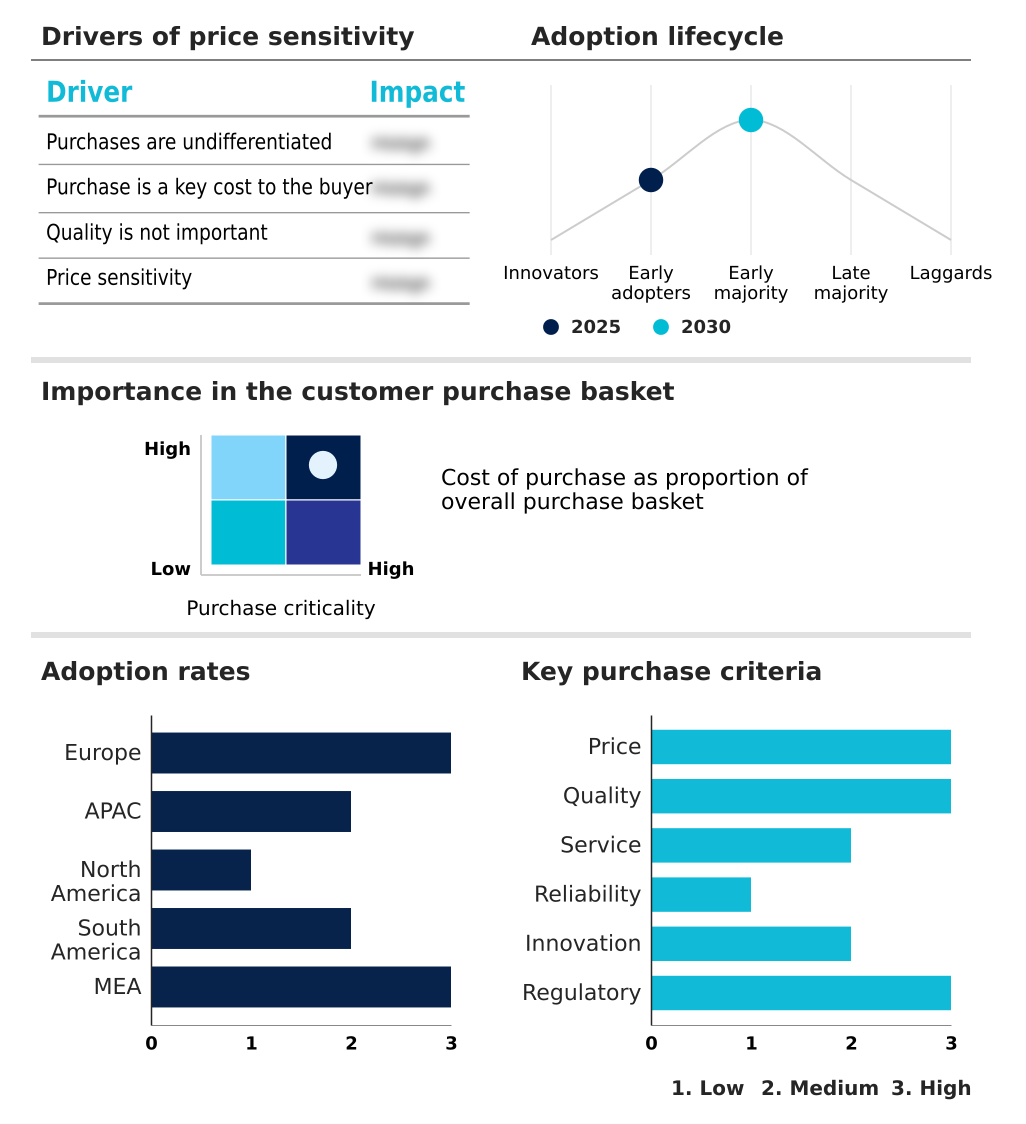
Exclusive Technavio Analysis on Customer Landscape

The adventure tourism market forecasting report includes the adoption lifecycle of the market, covering from the innovator’s stage to the laggard’s stage. It focuses on adoption rates in different regions based on penetration. Furthermore, the adventure tourism market report also includes key purchase criteria and drivers of price sensitivity to help companies evaluate and develop their market growth analysis strategies.

Customer Landscape of Adventure Tourism Industry

Competitive Landscape

Companies are implementing various strategies, such as strategic alliances, adventure tourism market forecast, partnerships, mergers and acquisitions, geographical expansion, and product/service launches, to enhance their presence in the industry.

A and K Travel Group Ltd. - Key solutions encompass curated global expeditions, from luxury journeys to small-group trekking, all centered on delivering immersive, sustainable, and authentic adventure travel experiences.

The industry research and growth report includes detailed analyses of the competitive landscape of the market and information about key companies, including:

  • A and K Travel Group Ltd.
  • Active New Zealand Ltd.
  • BikeHike Adventures Inc.
  • Boundless Journeys
  • Butterfield and Robinson Inc.
  • Exodus Travels Ltd.
  • Explore Worldwide Ltd.
  • G Adventures
  • Geographic Expeditions Inc.
  • Intrepid Group Pty Ltd.
  • Kensington Tours Ltd.
  • Mountain Travel Sobek
  • Much Better Adventures Ltd.
  • Passages Exotic Expeditions Ltd
  • Recreational Equipment Inc.
  • ROW Adventures
  • The Walt Disney Co.
  • Trafalgar
  • Travelopia Group
  • TUI AG

Qualitative and quantitative analysis of companies has been conducted to help clients understand the wider business environment as well as the strengths and weaknesses of key industry players. Data is qualitatively analyzed to categorize companies as pure play, category-focused, industry-focused, and diversified; it is quantitatively analyzed to categorize companies as dominant, leading, strong, tentative, and weak.

Recent Development and News in Adventure tourism market

  • In January, 2025, the World Tourism Organization published a report highlighting that the absence of dedicated search and rescue networks in remote developing regions has led to a 30% lower investment rate from adventure tourism operators.
  • In February, 2025, Credit Suisse confirmed in a wealth distribution report that significant growth in household net worth across the APAC region directly correlated with a 20% rise in demand for premium mountaineering and polar expeditions.
  • In March, 2025, the Adventure Travel Trade Association noted a significant industry-wide surge in the implementation of wearable biosensors to monitor participant vital signs in real-time during high-risk activities like high-altitude trekking.
  • In April, 2025, an economic impact study released by Skift revealed that the average cost of an all-inclusive multi-day expedition increased by 15% over the past year, driven by rising costs of sustainable aviation fuel and eco-friendly remote lodging.

Dive into Technavio’s robust research methodology, blending expert interviews, extensive data synthesis, and validated models for unparalleled Adventure Tourism Market insights. See full methodology.

Market Scope
Page number 290
Base year 2025
Historic period 2020-2024
Forecast period 2026-2030
Growth momentum & CAGR Accelerate at a CAGR of 9.4%
Market growth 2026-2030 USD 1039.3 billion
Market structure Fragmented
YoY growth 2025-2026(%) 8.7%
Key countries UK, Germany, France, Italy, Spain, The Netherlands, China, Japan, India, Australia, Thailand, Indonesia, US, Canada, Mexico, Brazil, Argentina, Peru, South Africa, UAE, Egypt, Saudi Arabia and Morocco
Competitive landscape Leading Companies, Market Positioning of Companies, Competitive Strategies, and Industry Risks

Request Free Sample

Research Analyst Overview

  • The global adventure tourism market 2026-2030 is rapidly evolving from a niche sector into a significant economic driver, fueled by a broadening consumer base. This expansion is largely attributed to the popularization of soft adventure sports, which now account for over 65% of new bookings and are accessible to a wider demographic.
  • Concurrently, demand for hard adventure activities like high-altitude trekking, deep-sea diving, and white-water rafting remains strong among enthusiasts. Boardroom decisions are increasingly focused on technology and safety, with investments in digital booking platforms and wearable biosensors becoming standard to mitigate risk and enhance the customer experience. The market's offerings are incredibly diverse, spanning polar exploration, desert safaris, and urban adventure.
  • Success depends on managing a complex portfolio of activities, from ziplining, canyoning, bungee jumping, and sandboarding to more technical pursuits like ice climbing and navigating via ferrata networks. The industry is also embracing eco-tourism, with sustainable camps and eco-friendly trails becoming key differentiators.
  • Activities such as volcanic hiking, rainforest trekking, and cultural walking tours are integrated with peer-to-peer feedback systems, while niche sports like kitesurfing, gravel biking, and even dogsledding find audiences through targeted online channels.
  • The rise of geological adventure and sustainable marine tourism highlights a growing consciousness, pushing operators toward more responsible practices, including the organization of slow travel itineraries and experiences like shark cage diving and dune bashing.

What are the Key Data Covered in this Adventure Tourism Market Research and Growth Report?

  • What is the expected growth of the Adventure Tourism Market between 2026 and 2030?

    • USD 1039.3 billion, at a CAGR of 9.4%

  • What segmentation does the market report cover?

    • The report is segmented by Type (Domestic, and International), Source (Indirect contribution, Direct contribution, and Induced contribution), Age Group (Below 30 years, 30 to 50 years, and Above 50 years) and Geography (Europe, APAC, North America, South America, Middle East and Africa)

  • Which regions are analyzed in the report?

    • Europe, APAC, North America, South America and Middle East and Africa

  • What are the key growth drivers and market challenges?

    • Increasing disposable incomes, Low penetration rate in developing economies

  • Who are the major players in the Adventure Tourism Market?

    • A and K Travel Group Ltd., Active New Zealand Ltd., BikeHike Adventures Inc., Boundless Journeys, Butterfield and Robinson Inc., Exodus Travels Ltd., Explore Worldwide Ltd., G Adventures, Geographic Expeditions Inc., Intrepid Group Pty Ltd., Kensington Tours Ltd., Mountain Travel Sobek, Much Better Adventures Ltd., Passages Exotic Expeditions Ltd, Recreational Equipment Inc., ROW Adventures, The Walt Disney Co., Trafalgar, Travelopia Group and TUI AG

Market Research Insights

  • The market's dynamics are heavily influenced by digital transformation and evolving consumer preferences for immersive cultural experiences. The widespread adoption of online travel agencies has streamlined access to customized itineraries and personalized private tours, reducing booking friction for complex expeditions by over 30%.
  • Social proof is a powerful force, with 80% of travelers citing verified online reviews as the most influential factor in their decision-making process. Concurrently, a shift toward more accessible activities is reshaping the demand landscape, as soft adventure now accounts for over 65% of all new bookings, driven by a growing interest in adventure wellness offerings.
  • This pivot toward low-impact travel broadens the consumer base, attracting multi-generational and solo travelers alike, who prioritize both safety and authenticity in their chosen expeditions.

We can help! Our analysts can customize this adventure tourism market research report to meet your requirements.

Get in touch

1. Executive Summary

1.1 Market overview

Executive Summary - Chart on Market Overview
Executive Summary - Data Table on Market Overview
Executive Summary - Chart on Global Market Characteristics
Executive Summary - Chart on Market by Geography
Executive Summary - Chart on Market Segmentation by Type
Executive Summary - Chart on Market Segmentation by Source
Executive Summary - Chart on Market Segmentation by Age Group
Executive Summary - Chart on Incremental Growth
Executive Summary - Data Table on Incremental Growth
Executive Summary - Chart on Company Market Positioning

2. Technavio Analysis

2.1 Analysis of price sensitivity, lifecycle, customer purchase basket, adoption rates, and purchase criteria

2.2 Criticality of inputs and Factors of differentiation

Chart on Overview on criticality of inputs and factors of differentiation

2.3 Factors of disruption

Chart on Overview on factors of disruption

2.4 Impact of drivers and challenges

Chart on Impact of drivers and challenges in 2025 and 2030

3. Market Landscape

3.1 Market ecosystem

Chart on Parent Market
Data Table on - Parent Market

3.2 Market characteristics

Chart on Market characteristics analysis

3.3 Value chain analysis

Chart on Value chain analysis

4. Market Sizing

4.1 Market definition

Data Table on Offerings of companies included in the market definition

4.2 Market segment analysis

Market segments

4.3 Market size 2025

4.4 Market outlook: Forecast for 2025-2030

Chart on Global - Market size and forecast 2025-2030 ($ billion)
Data Table on Global - Market size and forecast 2025-2030 ($ billion)
Chart on Global Market: Year-over-year growth 2025-2030 (%)
Data Table on Global Market: Year-over-year growth 2025-2030 (%)

5. Historic Market Size

5.1 Global Adventure Tourism Market 2020 - 2024

Historic Market Size - Data Table on Global Adventure Tourism Market 2020 - 2024 ($ billion)

5.2 Type segment analysis 2020 - 2024

Historic Market Size - Type Segment 2020 - 2024 ($ billion)

5.3 Source segment analysis 2020 - 2024

Historic Market Size - Source Segment 2020 - 2024 ($ billion)

5.4 Age Group segment analysis 2020 - 2024

Historic Market Size - Age Group Segment 2020 - 2024 ($ billion)

5.5 Geography segment analysis 2020 - 2024

Historic Market Size - Geography Segment 2020 - 2024 ($ billion)

5.6 Country segment analysis 2020 - 2024

Historic Market Size - Country Segment 2020 - 2024 ($ billion)

6. Qualitative Analysis

6.1 Impact of AI on the Global Adventure Tourism Market

7. Five Forces Analysis

7.1 Five forces summary

Five forces analysis - Comparison between 2025 and 2030

7.2 Bargaining power of buyers

Bargaining power of buyers - Impact of key factors 2025 and 2030

7.3 Bargaining power of suppliers

Bargaining power of suppliers - Impact of key factors in 2025 and 2030

7.4 Threat of new entrants

Threat of new entrants - Impact of key factors in 2025 and 2030

7.5 Threat of substitutes

Threat of substitutes - Impact of key factors in 2025 and 2030

7.6 Threat of rivalry

Threat of rivalry - Impact of key factors in 2025 and 2030

7.7 Market condition

Chart on Market condition - Five forces 2025 and 2030

8. Market Segmentation by Type

8.1 Market segments

Chart on Type - Market share 2025-2030 (%)
Data Table on Type - Market share 2025-2030 (%)

8.2 Comparison by Type

Chart on Comparison by Type
Data Table on Comparison by Type

8.3 Domestic - Market size and forecast 2025-2030

Chart on Domestic - Market size and forecast 2025-2030 ($ billion)
Data Table on Domestic - Market size and forecast 2025-2030 ($ billion)
Chart on Domestic - Year-over-year growth 2025-2030 (%)
Data Table on Domestic - Year-over-year growth 2025-2030 (%)

8.4 International - Market size and forecast 2025-2030

Chart on International - Market size and forecast 2025-2030 ($ billion)
Data Table on International - Market size and forecast 2025-2030 ($ billion)
Chart on International - Year-over-year growth 2025-2030 (%)
Data Table on International - Year-over-year growth 2025-2030 (%)

8.5 Market opportunity by Type

Market opportunity by Type ($ billion)
Data Table on Market opportunity by Type ($ billion)

9. Market Segmentation by Source

9.1 Market segments

Chart on Source - Market share 2025-2030 (%)
Data Table on Source - Market share 2025-2030 (%)

9.2 Comparison by Source

Chart on Comparison by Source
Data Table on Comparison by Source

9.3 Indirect contribution - Market size and forecast 2025-2030

Chart on Indirect contribution - Market size and forecast 2025-2030 ($ billion)
Data Table on Indirect contribution - Market size and forecast 2025-2030 ($ billion)
Chart on Indirect contribution - Year-over-year growth 2025-2030 (%)
Data Table on Indirect contribution - Year-over-year growth 2025-2030 (%)

9.4 Direct contribution - Market size and forecast 2025-2030

Chart on Direct contribution - Market size and forecast 2025-2030 ($ billion)
Data Table on Direct contribution - Market size and forecast 2025-2030 ($ billion)
Chart on Direct contribution - Year-over-year growth 2025-2030 (%)
Data Table on Direct contribution - Year-over-year growth 2025-2030 (%)

9.5 Induced contribution - Market size and forecast 2025-2030

Chart on Induced contribution - Market size and forecast 2025-2030 ($ billion)
Data Table on Induced contribution - Market size and forecast 2025-2030 ($ billion)
Chart on Induced contribution - Year-over-year growth 2025-2030 (%)
Data Table on Induced contribution - Year-over-year growth 2025-2030 (%)

9.6 Market opportunity by Source

Market opportunity by Source ($ billion)
Data Table on Market opportunity by Source ($ billion)

10. Market Segmentation by Age Group

10.1 Market segments

Chart on Age Group - Market share 2025-2030 (%)
Data Table on Age Group - Market share 2025-2030 (%)

10.2 Comparison by Age Group

Chart on Comparison by Age Group
Data Table on Comparison by Age Group

10.3 Below 30 years - Market size and forecast 2025-2030

Chart on Below 30 years - Market size and forecast 2025-2030 ($ billion)
Data Table on Below 30 years - Market size and forecast 2025-2030 ($ billion)
Chart on Below 30 years - Year-over-year growth 2025-2030 (%)
Data Table on Below 30 years - Year-over-year growth 2025-2030 (%)

10.4 30 to 50 years - Market size and forecast 2025-2030

Chart on 30 to 50 years - Market size and forecast 2025-2030 ($ billion)
Data Table on 30 to 50 years - Market size and forecast 2025-2030 ($ billion)
Chart on 30 to 50 years - Year-over-year growth 2025-2030 (%)
Data Table on 30 to 50 years - Year-over-year growth 2025-2030 (%)

10.5 Above 50 years - Market size and forecast 2025-2030

Chart on Above 50 years - Market size and forecast 2025-2030 ($ billion)
Data Table on Above 50 years - Market size and forecast 2025-2030 ($ billion)
Chart on Above 50 years - Year-over-year growth 2025-2030 (%)
Data Table on Above 50 years - Year-over-year growth 2025-2030 (%)

10.6 Market opportunity by Age Group

Market opportunity by Age Group ($ billion)
Data Table on Market opportunity by Age Group ($ billion)

11. Customer Landscape

11.1 Customer landscape overview

Analysis of price sensitivity, lifecycle, customer purchase basket, adoption rates, and purchase criteria

12. Geographic Landscape

12.1 Geographic segmentation

Chart on Market share by geography 2025-2030 (%)
Data Table on Market share by geography 2025-2030 (%)

12.2 Geographic comparison

Chart on Geographic comparison
Data Table on Geographic comparison

12.3 Europe - Market size and forecast 2025-2030

Chart on Europe - Market size and forecast 2025-2030 ($ billion)
Data Table on Europe - Market size and forecast 2025-2030 ($ billion)
Chart on Europe - Year-over-year growth 2025-2030 (%)
Data Table on Europe - Year-over-year growth 2025-2030 (%)
Chart on Regional Comparison - Europe
Data Table on Regional Comparison - Europe

12.3.1 UK - Market size and forecast 2025-2030

Chart on UK - Market size and forecast 2025-2030 ($ billion)
Data Table on UK - Market size and forecast 2025-2030 ($ billion)
Chart on UK - Year-over-year growth 2025-2030 (%)
Data Table on UK - Year-over-year growth 2025-2030 (%)

12.3.2 Germany - Market size and forecast 2025-2030

Chart on Germany - Market size and forecast 2025-2030 ($ billion)
Data Table on Germany - Market size and forecast 2025-2030 ($ billion)
Chart on Germany - Year-over-year growth 2025-2030 (%)
Data Table on Germany - Year-over-year growth 2025-2030 (%)

12.3.3 France - Market size and forecast 2025-2030

Chart on France - Market size and forecast 2025-2030 ($ billion)
Data Table on France - Market size and forecast 2025-2030 ($ billion)
Chart on France - Year-over-year growth 2025-2030 (%)
Data Table on France - Year-over-year growth 2025-2030 (%)

12.3.4 Italy - Market size and forecast 2025-2030

Chart on Italy - Market size and forecast 2025-2030 ($ billion)
Data Table on Italy - Market size and forecast 2025-2030 ($ billion)
Chart on Italy - Year-over-year growth 2025-2030 (%)
Data Table on Italy - Year-over-year growth 2025-2030 (%)

12.3.5 Spain - Market size and forecast 2025-2030

Chart on Spain - Market size and forecast 2025-2030 ($ billion)
Data Table on Spain - Market size and forecast 2025-2030 ($ billion)
Chart on Spain - Year-over-year growth 2025-2030 (%)
Data Table on Spain - Year-over-year growth 2025-2030 (%)

12.3.6 The Netherlands - Market size and forecast 2025-2030

Chart on The Netherlands - Market size and forecast 2025-2030 ($ billion)
Data Table on The Netherlands - Market size and forecast 2025-2030 ($ billion)
Chart on The Netherlands - Year-over-year growth 2025-2030 (%)
Data Table on The Netherlands - Year-over-year growth 2025-2030 (%)

12.4 APAC - Market size and forecast 2025-2030

Chart on APAC - Market size and forecast 2025-2030 ($ billion)
Data Table on APAC - Market size and forecast 2025-2030 ($ billion)
Chart on APAC - Year-over-year growth 2025-2030 (%)
Data Table on APAC - Year-over-year growth 2025-2030 (%)
Chart on Regional Comparison - APAC
Data Table on Regional Comparison - APAC

12.4.1 China - Market size and forecast 2025-2030

Chart on China - Market size and forecast 2025-2030 ($ billion)
Data Table on China - Market size and forecast 2025-2030 ($ billion)
Chart on China - Year-over-year growth 2025-2030 (%)
Data Table on China - Year-over-year growth 2025-2030 (%)

12.4.2 Japan - Market size and forecast 2025-2030

Chart on Japan - Market size and forecast 2025-2030 ($ billion)
Data Table on Japan - Market size and forecast 2025-2030 ($ billion)
Chart on Japan - Year-over-year growth 2025-2030 (%)
Data Table on Japan - Year-over-year growth 2025-2030 (%)

12.4.3 India - Market size and forecast 2025-2030

Chart on India - Market size and forecast 2025-2030 ($ billion)
Data Table on India - Market size and forecast 2025-2030 ($ billion)
Chart on India - Year-over-year growth 2025-2030 (%)
Data Table on India - Year-over-year growth 2025-2030 (%)

12.4.4 Australia - Market size and forecast 2025-2030

Chart on Australia - Market size and forecast 2025-2030 ($ billion)
Data Table on Australia - Market size and forecast 2025-2030 ($ billion)
Chart on Australia - Year-over-year growth 2025-2030 (%)
Data Table on Australia - Year-over-year growth 2025-2030 (%)

12.4.5 Thailand - Market size and forecast 2025-2030

Chart on Thailand - Market size and forecast 2025-2030 ($ billion)
Data Table on Thailand - Market size and forecast 2025-2030 ($ billion)
Chart on Thailand - Year-over-year growth 2025-2030 (%)
Data Table on Thailand - Year-over-year growth 2025-2030 (%)

12.4.6 Indonesia - Market size and forecast 2025-2030

Chart on Indonesia - Market size and forecast 2025-2030 ($ billion)
Data Table on Indonesia - Market size and forecast 2025-2030 ($ billion)
Chart on Indonesia - Year-over-year growth 2025-2030 (%)
Data Table on Indonesia - Year-over-year growth 2025-2030 (%)

12.5 North America - Market size and forecast 2025-2030

Chart on North America - Market size and forecast 2025-2030 ($ billion)
Data Table on North America - Market size and forecast 2025-2030 ($ billion)
Chart on North America - Year-over-year growth 2025-2030 (%)
Data Table on North America - Year-over-year growth 2025-2030 (%)
Chart on Regional Comparison - North America
Data Table on Regional Comparison - North America

12.5.1 US - Market size and forecast 2025-2030

Chart on US - Market size and forecast 2025-2030 ($ billion)
Data Table on US - Market size and forecast 2025-2030 ($ billion)
Chart on US - Year-over-year growth 2025-2030 (%)
Data Table on US - Year-over-year growth 2025-2030 (%)

12.5.2 Canada - Market size and forecast 2025-2030

Chart on Canada - Market size and forecast 2025-2030 ($ billion)
Data Table on Canada - Market size and forecast 2025-2030 ($ billion)
Chart on Canada - Year-over-year growth 2025-2030 (%)
Data Table on Canada - Year-over-year growth 2025-2030 (%)

12.5.3 Mexico - Market size and forecast 2025-2030

Chart on Mexico - Market size and forecast 2025-2030 ($ billion)
Data Table on Mexico - Market size and forecast 2025-2030 ($ billion)
Chart on Mexico - Year-over-year growth 2025-2030 (%)
Data Table on Mexico - Year-over-year growth 2025-2030 (%)

12.6 South America - Market size and forecast 2025-2030

Chart on South America - Market size and forecast 2025-2030 ($ billion)
Data Table on South America - Market size and forecast 2025-2030 ($ billion)
Chart on South America - Year-over-year growth 2025-2030 (%)
Data Table on South America - Year-over-year growth 2025-2030 (%)
Chart on Regional Comparison - South America
Data Table on Regional Comparison - South America

12.6.1 Brazil - Market size and forecast 2025-2030

Chart on Brazil - Market size and forecast 2025-2030 ($ billion)
Data Table on Brazil - Market size and forecast 2025-2030 ($ billion)
Chart on Brazil - Year-over-year growth 2025-2030 (%)
Data Table on Brazil - Year-over-year growth 2025-2030 (%)

12.6.2 Argentina - Market size and forecast 2025-2030

Chart on Argentina - Market size and forecast 2025-2030 ($ billion)
Data Table on Argentina - Market size and forecast 2025-2030 ($ billion)
Chart on Argentina - Year-over-year growth 2025-2030 (%)
Data Table on Argentina - Year-over-year growth 2025-2030 (%)

12.6.3 Peru - Market size and forecast 2025-2030

Chart on Peru - Market size and forecast 2025-2030 ($ billion)
Data Table on Peru - Market size and forecast 2025-2030 ($ billion)
Chart on Peru - Year-over-year growth 2025-2030 (%)
Data Table on Peru - Year-over-year growth 2025-2030 (%)

12.7 Middle East and Africa - Market size and forecast 2025-2030

Chart on Middle East and Africa - Market size and forecast 2025-2030 ($ billion)
Data Table on Middle East and Africa - Market size and forecast 2025-2030 ($ billion)
Chart on Middle East and Africa - Year-over-year growth 2025-2030 (%)
Data Table on Middle East and Africa - Year-over-year growth 2025-2030 (%)
Chart on Regional Comparison - Middle East and Africa
Data Table on Regional Comparison - Middle East and Africa

12.7.1 South Africa - Market size and forecast 2025-2030

Chart on South Africa - Market size and forecast 2025-2030 ($ billion)
Data Table on South Africa - Market size and forecast 2025-2030 ($ billion)
Chart on South Africa - Year-over-year growth 2025-2030 (%)
Data Table on South Africa - Year-over-year growth 2025-2030 (%)

12.7.2 UAE - Market size and forecast 2025-2030

Chart on UAE - Market size and forecast 2025-2030 ($ billion)
Data Table on UAE - Market size and forecast 2025-2030 ($ billion)
Chart on UAE - Year-over-year growth 2025-2030 (%)
Data Table on UAE - Year-over-year growth 2025-2030 (%)

12.7.3 Egypt - Market size and forecast 2025-2030

Chart on Egypt - Market size and forecast 2025-2030 ($ billion)
Data Table on Egypt - Market size and forecast 2025-2030 ($ billion)
Chart on Egypt - Year-over-year growth 2025-2030 (%)
Data Table on Egypt - Year-over-year growth 2025-2030 (%)

12.7.4 Saudi Arabia - Market size and forecast 2025-2030

Chart on Saudi Arabia - Market size and forecast 2025-2030 ($ billion)
Data Table on Saudi Arabia - Market size and forecast 2025-2030 ($ billion)
Chart on Saudi Arabia - Year-over-year growth 2025-2030 (%)
Data Table on Saudi Arabia - Year-over-year growth 2025-2030 (%)

12.7.5 Morocco - Market size and forecast 2025-2030

Chart on Morocco - Market size and forecast 2025-2030 ($ billion)
Data Table on Morocco - Market size and forecast 2025-2030 ($ billion)
Chart on Morocco - Year-over-year growth 2025-2030 (%)
Data Table on Morocco - Year-over-year growth 2025-2030 (%)

12.8 Market opportunity by geography

Market opportunity by geography ($ billion)
Data Tables on Market opportunity by geography ($ billion)

13. Drivers, Challenges, and Opportunity

13.1 Market drivers

Increasing disposable incomes
Rising number of soft adventure sports enthusiasts
Government initiatives to promote tourism

13.2 Market challenges

Low penetration rate in developing economies
Risks of accidents and injuries associated with adventurous sports
High cost of adventure tourism

13.3 Impact of drivers and challenges

Impact of drivers and challenges in 2025 and 2030

13.4 Market opportunities

Online reviews encouraging travel industry
Higher acceptance rates of online travel agencies
Growing popularity of travel blogging/vlogging

14. Competitive Landscape

14.1 Overview

14.2

Overview on criticality of inputs and factors of differentiation

14.3 Landscape disruption

Overview on factors of disruption

14.4 Industry risks

Impact of key risks on business

15. Competitive Analysis

15.1 Companies profiled

Companies covered

15.2 Company ranking index

15.3 Market positioning of companies

Matrix on companies position and classification

15.4 A and K Travel Group Ltd.

A and K Travel Group Ltd. - Overview
A and K Travel Group Ltd. - Product / Service
A and K Travel Group Ltd. - Key offerings
SWOT

15.5 BikeHike Adventures Inc.

BikeHike Adventures Inc. - Overview
BikeHike Adventures Inc. - Product / Service
BikeHike Adventures Inc. - Key offerings
SWOT

15.6 Boundless Journeys

Boundless Journeys - Overview
Boundless Journeys - Product / Service
Boundless Journeys - Key offerings
SWOT

15.7 Butterfield and Robinson Inc.

Butterfield and Robinson Inc. - Overview
Butterfield and Robinson Inc. - Product / Service
Butterfield and Robinson Inc. - Key news
Butterfield and Robinson Inc. - Key offerings
SWOT

15.8 Geographic Expeditions Inc.

Geographic Expeditions Inc. - Overview
Geographic Expeditions Inc. - Product / Service
Geographic Expeditions Inc. - Key offerings
SWOT

15.9 Intrepid Group Pty Ltd.

Intrepid Group Pty Ltd. - Overview
Intrepid Group Pty Ltd. - Product / Service
Intrepid Group Pty Ltd. - Key news
Intrepid Group Pty Ltd. - Key offerings
SWOT

15.10 Kensington Tours Ltd.

Kensington Tours Ltd. - Overview
Kensington Tours Ltd. - Product / Service
Kensington Tours Ltd. - Key offerings
SWOT

15.11 Mountain Travel Sobek

Mountain Travel Sobek - Overview
Mountain Travel Sobek - Product / Service
Mountain Travel Sobek - Key offerings
SWOT

15.12 Much Better Adventures Ltd.

Much Better Adventures Ltd. - Overview
Much Better Adventures Ltd. - Product / Service
Much Better Adventures Ltd. - Key offerings
SWOT

15.13 Passages Exotic Expeditions Ltd

Passages Exotic Expeditions Ltd - Overview
Passages Exotic Expeditions Ltd - Product / Service
Passages Exotic Expeditions Ltd - Key offerings
SWOT

15.14 Recreational Equipment Inc.

Recreational Equipment Inc. - Overview
Recreational Equipment Inc. - Product / Service
Recreational Equipment Inc. - Key offerings
SWOT

15.15 ROW Adventures

ROW Adventures - Overview
ROW Adventures - Product / Service
ROW Adventures - Key offerings
SWOT

15.16 The Walt Disney Co.

The Walt Disney Co. - Overview
The Walt Disney Co. - Business segments
The Walt Disney Co. - Key offerings
The Walt Disney Co. - Segment focus
SWOT

15.17 Travelopia Group

Travelopia Group - Overview
Travelopia Group - Product / Service
Travelopia Group - Key offerings
SWOT

15.18 TUI AG

TUI AG - Overview
TUI AG - Business segments
TUI AG - Key offerings
TUI AG - Segment focus
SWOT

16. Appendix

16.1 Scope of the report

Market definition
Objectives
Notes and caveats

16.2 Inclusions and exclusions checklist

Inclusions checklist
Exclusions checklist

16.3 Currency conversion rates for US$

16.4 Research methodology

16.5 Data procurement

Information sources

16.6 Data validation

16.7 Validation techniques employed for market sizing

16.8 Data synthesis

16.9 360 degree market analysis

16.10 List of abbreviations

Research Methodology

Technavio presents a detailed picture of the market by way of study, synthesis, and summation of data from multiple sources. The analysts have presented the various facets of the market with a particular focus on identifying the key industry influencers. The data thus presented is comprehensive, reliable, and the result of extensive research, both primary and secondary.

INFORMATION SOURCES

Primary sources

  • Manufacturers and suppliers
  • Channel partners
  • Industry experts
  • Strategic decision makers

Secondary sources

  • Industry journals and periodicals
  • Government data
  • Financial reports of key industry players
  • Historical data
  • Press releases

DATA ANALYSIS

Data Synthesis

  • Collation of data
  • Estimation of key figures
  • Analysis of derived insights

Data Validation

  • Triangulation with data models
  • Reference against proprietary databases
  • Corroboration with industry experts

REPORT WRITING

Qualitative

  • Market drivers
  • Market challenges
  • Market trends
  • Five forces analysis

Quantitative

  • Market size and forecast
  • Market segmentation
  • Geographical insights
  • Competitive landscape

Interested in this report?

Get your sample now to see our research methodology and insights!

Download Now

Frequently Asked Questions

Adventure Tourism market growth will increase by USD 1039.3 billion during 2026-2030.

The Adventure Tourism market is expected to grow at a CAGR of 9.4% during 2026-2030.

Adventure Tourism market is segmented by Type (Domestic, International) Source (Indirect contribution, Direct contribution, Induced contribution) Age group (Below 30 years, 30 to 50 years, Above 50 years)

A and K Travel Group Ltd., Active New Zealand Ltd., BikeHike Adventures Inc., Boundless Journeys, Butterfield and Robinson Inc., Exodus Travels Ltd., Explore Worldwide Ltd., G Adventures, Geographic Expeditions Inc., Intrepid Group Pty Ltd., Kensington Tours Ltd., Mountain Travel Sobek, Much Better Adventures Ltd., Passages Exotic Expeditions Ltd, Recreational Equipment Inc., ROW Adventures, The Walt Disney Co., Trafalgar, Travelopia Group, TUI AG are a few of the key vendors in the Adventure Tourism market.

APAC will register the highest growth rate of 32.4% among the other regions. Therefore, the Adventure Tourism market in APAC is expected to garner significant business opportunities for the vendors during the forecast period.

UK, Germany, France, Italy, Spain, The Netherlands, China, Japan, India, Australia, Thailand, Indonesia, US, Canada, Mexico, Brazil, Argentina, Peru, South Africa, UAE, Egypt, Saudi Arabia, Morocco

  • Increasing disposable incomes is the driving factor this market.

The Adventure Tourism market vendors should focus on grabbing business opportunities from the Type segment as it accounted for the largest market share in the base year.
RIA - Research AI Assistant
Ask RIA