Ai-based Assessment Authoring Tools Market Analysis, Size, and Forecast 2026-2030: North America (US, Canada, and Mexico), Europe (UK, Germany, and France), APAC (China, India, and Japan), Middle East and Africa (UAE, Saudi Arabia, and South Africa), South America (Brazil, Argentina, and Colombia), and Rest of World (ROW)

Ai-based Assessment Authoring Tools Market Analysis, Size, and Forecast 2026-2030:
North America (US, Canada, and Mexico), Europe (UK, Germany, and France), APAC (China, India, and Japan), Middle East and Africa (UAE, Saudi Arabia, and South Africa), South America (Brazil, Argentina, and Colombia), and Rest of World (ROW)

Published: Mar 2026 297 Pages SKU: IRTNTR81306

Market Overview at a Glance

$2.17 B
Market Opportunity
16.5%
CAGR 2025 - 2030
42.1%
North America Growth
$542.6 Mn
Automated grading segment 2024

Ai-based Assessment Authoring Tools Market Size 2026-2030

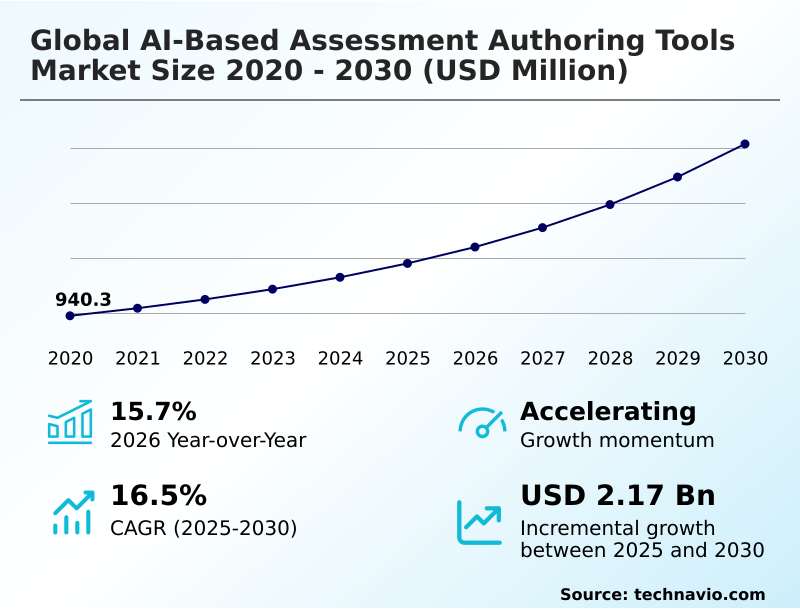
The ai-based assessment authoring tools market size is valued to increase by USD 2.17 billion, at a CAGR of 16.5% from 2025 to 2030. Proliferation of personalized and adaptive learning ecosystems will drive the ai-based assessment authoring tools market.

Major Market Trends & Insights

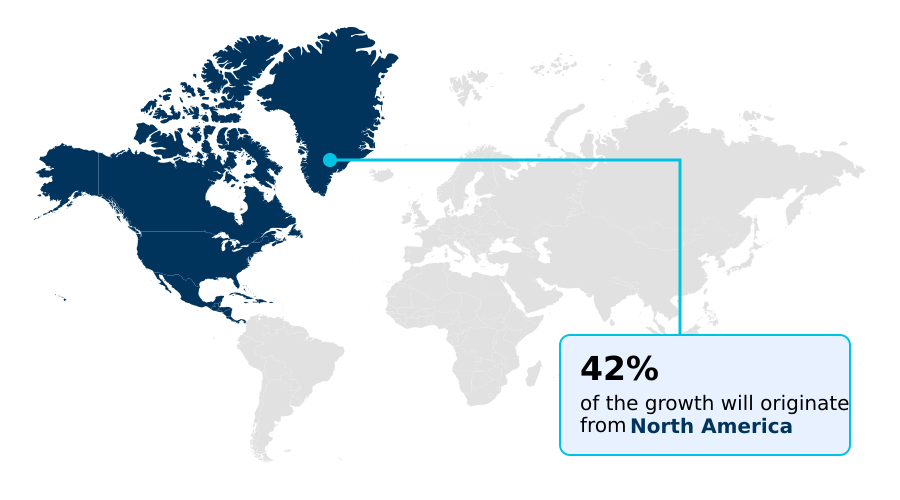
  • North America dominated the market and accounted for a 42.1% growth during the forecast period.
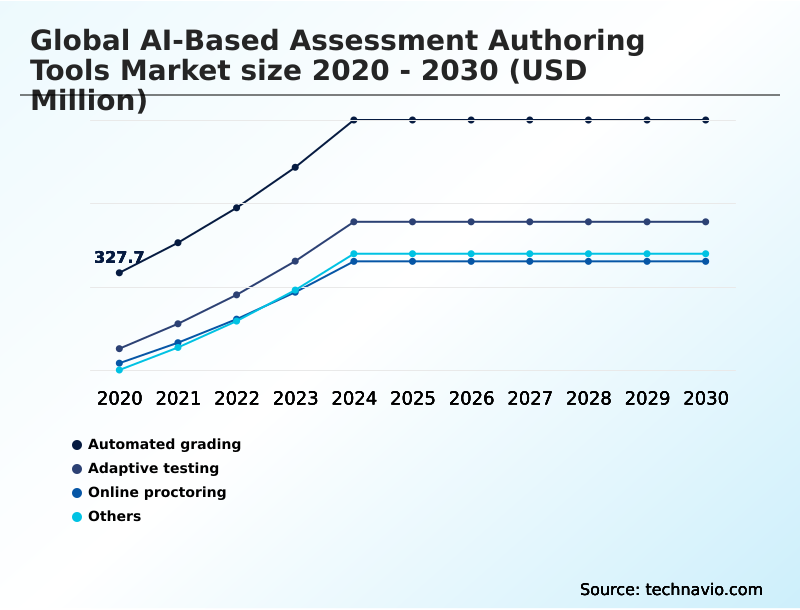
  • By Type - Automated grading segment was valued at USD 542.6 million in 2024
  • By Application - Higher education segment accounted for the largest market revenue share in 2024

Market Size & Forecast

  • Market Opportunities: USD 3.12 billion
  • Market Future Opportunities: USD 2.17 billion
  • CAGR from 2025 to 2030 : 16.5%

Market Summary

  • The AI-based assessment authoring tools market is undergoing a significant transformation, moving away from labor-intensive manual processes toward instructional design automation. This evolution is driven by the adoption of generative models and natural language processing to create dynamic and varied evaluation materials.
  • A core application is the move toward personalized learning paths, where adaptive testing algorithms adjust question difficulty in real time, a process underpinned by item response theory. This enhances engagement and provides more accurate technical skills validation.
  • For instance, a global corporation can leverage these tools for assessment for corporate compliance, automatically generating standards-aligned content from updated policy handbooks, ensuring the workforce remains proficient. The rise of multimodal assessment generation and gamified assessment design represents a key trend, catering to diverse cognitive processing styles.
  • However, the industry grapples with challenges like algorithmic bias mitigation and ensuring assessment data sovereignty to maintain ethical AI in education. The goal is to achieve seamless psychometric validation for all ai-generated test forms while ensuring exam content security.

What will be the Size of the Ai-based Assessment Authoring Tools Market during the forecast period?

Get Key Insights on Market Forecast (PDF) Request Free Sample

How is the Ai-based Assessment Authoring Tools Market Segmented?

The ai-based assessment authoring tools industry research report provides comprehensive data (region-wise segment analysis), with forecasts and estimates in "USD million" for the period 2026-2030, as well as historical data from 2020-2024 for the following segments.

  • Type
    • Automated grading
    • Adaptive testing
    • Online proctoring
    • Others
  • Application
    • Higher education
    • Corporate training
    • K-12 education
    • Online learning
    • Certification exams
  • Deployment
    • Cloud based
    • On premises
  • Geography
    • North America
      • US
      • Canada
      • Mexico
    • Europe
      • UK
      • Germany
      • France
    • APAC
      • China
      • India
      • Japan
    • Middle East and Africa
      • UAE
      • Saudi Arabia
      • South Africa
    • South America
      • Brazil
      • Argentina
      • Colombia
    • Rest of World (ROW)

By Type Insights

The automated grading segment is estimated to witness significant growth during the forecast period.

Automated grading is transforming evaluation processes through sophisticated machine learning models and automated grading algorithms. These systems provide rapid, scalable solutions for assessing student work, moving beyond simple answer matching to analyze conceptual accuracy.

By providing real-time performance analytics, the technology enables a data-driven instructional strategy that supports diverse cognitive processing styles. This formative assessment automation allows instructors to implement real-time feedback mechanisms, a core component of modern higher education evaluation tools.

The emphasis on explainable artificial intelligence ensures that the logic behind scoring is transparent, building trust among educators using ai-assisted instructional design.

These tools can reduce grading time for complex assignments by over 75%, allowing faculty to focus on mentorship and curriculum development.

Request Free Sample

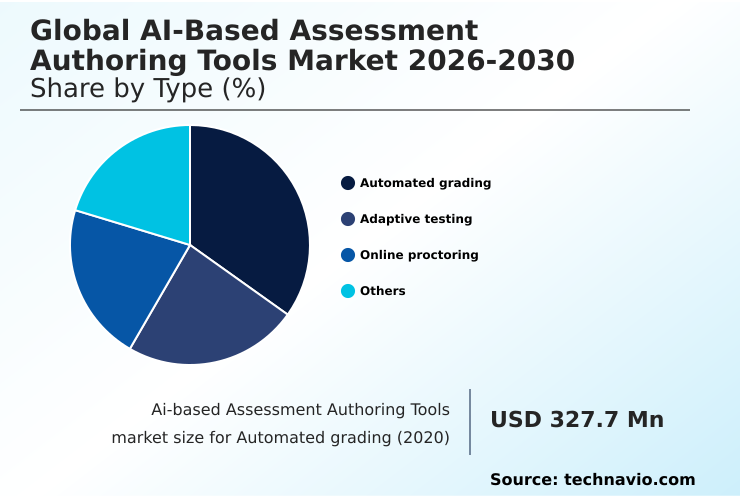
The Automated grading segment was valued at USD 542.6 million in 2024 and showed a gradual increase during the forecast period.

Request Free Sample

Regional Analysis

North America is estimated to contribute 42.1% to the growth of the global market during the forecast period.Technavio’s analysts have elaborately explained the regional trends and drivers that shape the market during the forecast period.

See How Ai-based Assessment Authoring Tools Market Demand is Rising in North America Request Free Sample

The market's geographic landscape is diverse, with North America representing the most mature segment, set to contribute over 42% of new growth, driven by early adoption of cloud-native authoring platforms.

In contrast, the APAC region is expanding most rapidly as governments invest in digital education, creating demand for language localization for assessments. European markets prioritize regulatory compliance, fostering innovation in secure on-premises ai deployment.

Across all regions, the focus on high-stakes exam authoring and the need for robust learning outcome mapping are universal drivers. Tools enabling dynamic question authoring and automated rubric creation are gaining traction globally.

This reflects a worldwide shift in ai-assisted instructional design, where institutions leverage technology to meet both regional standards and global best practices, with k-12 curriculum alignment being a key focus for public sector adoption.

Market Dynamics

Our researchers analyzed the data with 2025 as the base year, along with the key drivers, trends, and challenges. A holistic analysis of drivers will help companies refine their marketing strategies to gain a competitive advantage.

  • The adoption of AI-based assessment authoring is creating distinct opportunities across various educational and professional sectors. The drive for corporate training assessment automation is particularly strong, as companies use these tools for creating scenario-based training assessments and quizzes for compliance training, reducing content development cycles by more than half compared to manual methods.
  • Simultaneously, ai tools for k-12 assessment are empowering teachers by automating the creation of standards-aligned tests and supporting ai-powered formative assessment strategies. In higher education, automating higher education assessments allows faculty to focus on more complex instructional tasks, while generative ai for medical exams and other high-stakes fields like adaptive testing for professional certification ensures both rigor and security.
  • These platforms excel at using ai for skills validation, particularly with specialized ai tools for stem assessment. The technology is also being applied to ai for language proficiency testing, where it can generate nuanced questions and evaluate responses. Key features like automating rubric generation with ai and tools for multimodal question generation enhance efficiency and pedagogical value.
  • Whether deployed as cloud-based ai assessment authoring for scalability or as on-premises ai for secure testing in sensitive environments, the goal is consistent: developing gamified assessments with ai, providing ai platforms for continuous feedback, and mitigating bias in ai grading to ensure fair and effective generative ai for exam creation.

What are the key market drivers leading to the rise in the adoption of Ai-based Assessment Authoring Tools Industry?

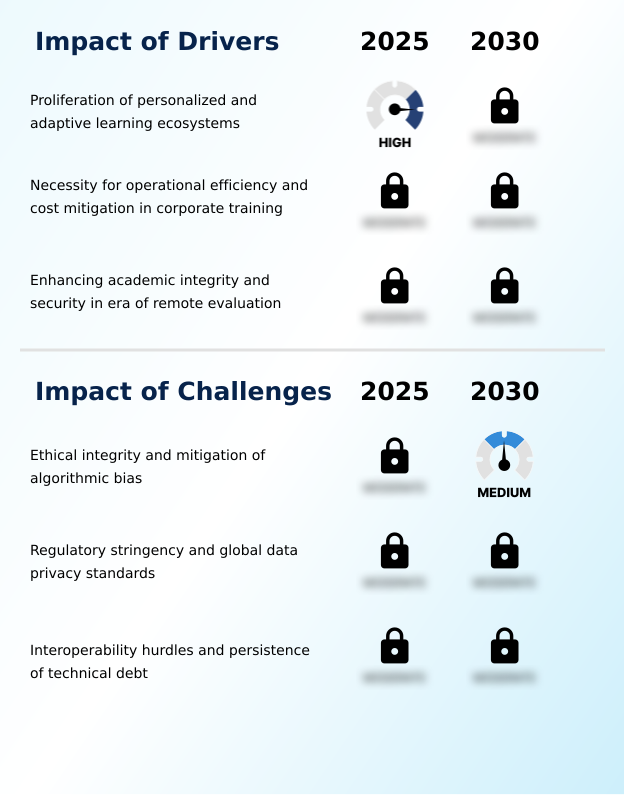
  • The proliferation of personalized and adaptive learning ecosystems is a key driver for market growth.

  • Key market drivers are centered on efficiency and personalization. The proliferation of personalized learning paths is a primary catalyst, enabled by adaptive testing algorithms that tailor assessments to individual proficiency levels.
  • In corporate settings, instructional design automation powered by natural language processing accelerates content creation for assessment for corporate compliance by up to 70%. This allows for rapid ai-driven skills gap analysis and technical skills validation.
  • The need for enhanced exam content security in high-stakes professional certification testing is another major driver, with AI generating unique test forms to prevent cheating.
  • In the education sector, achieving precise k-12 curriculum alignment is now more streamlined, reducing manual alignment tasks by over 90% for educators.

What are the market trends shaping the Ai-based Assessment Authoring Tools Industry?

  • A primary market trend is the integration of multimodal generative AI, which advances content creation beyond simple text. This facilitates the development of more dynamic, accessible, and engaging assessment materials.

  • Emerging trends are reshaping assessment creation, led by the adoption of multimodal generative models. These tools are now capable of multimodal assessment generation, creating not just text but also accompanying images and audio, which has been shown to improve learner engagement by over 25%.
  • Another key trend is the move toward scenario-based evaluation and gamified assessment design, where interactive simulation creation allows for authentic competency-based assessment. This is facilitated by ai-powered quiz generation that produces standards-aligned content dynamically. Furthermore, the market is shifting toward continuous micro-assessment delivery, providing learners with immediate feedback.
  • In proctoring, advanced behavioral analysis in proctoring is enhancing integrity with over 98% accuracy in flagging suspicious activities, making remote evaluations more reliable.

What challenges does the Ai-based Assessment Authoring Tools Industry face during its growth?

  • Ensuring ethical integrity and mitigating algorithmic bias represents a key challenge affecting industry growth.

  • Significant challenges constrain market growth, primarily revolving around trust and integration. Ensuring ethical AI in education is paramount, as algorithmic bias mitigation requires substantial investment in development and auditing to prevent discriminatory outcomes in ai-generated test forms. The need for rigorous psychometric validation and item bank management adds complexity.
  • Furthermore, global data privacy laws necessitate strategies for assessment data sovereignty, with some organizations opting for on-premises ai deployment, which can increase infrastructure costs by 20%. The threat to summative assessment integrity remains, compelling providers to enhance plagiarism detection and invest in secure online proctoring solutions.
  • Integrating these advanced systems with legacy educational platforms continues to be a major technical hurdle for many institutions.

Exclusive Technavio Analysis on Customer Landscape

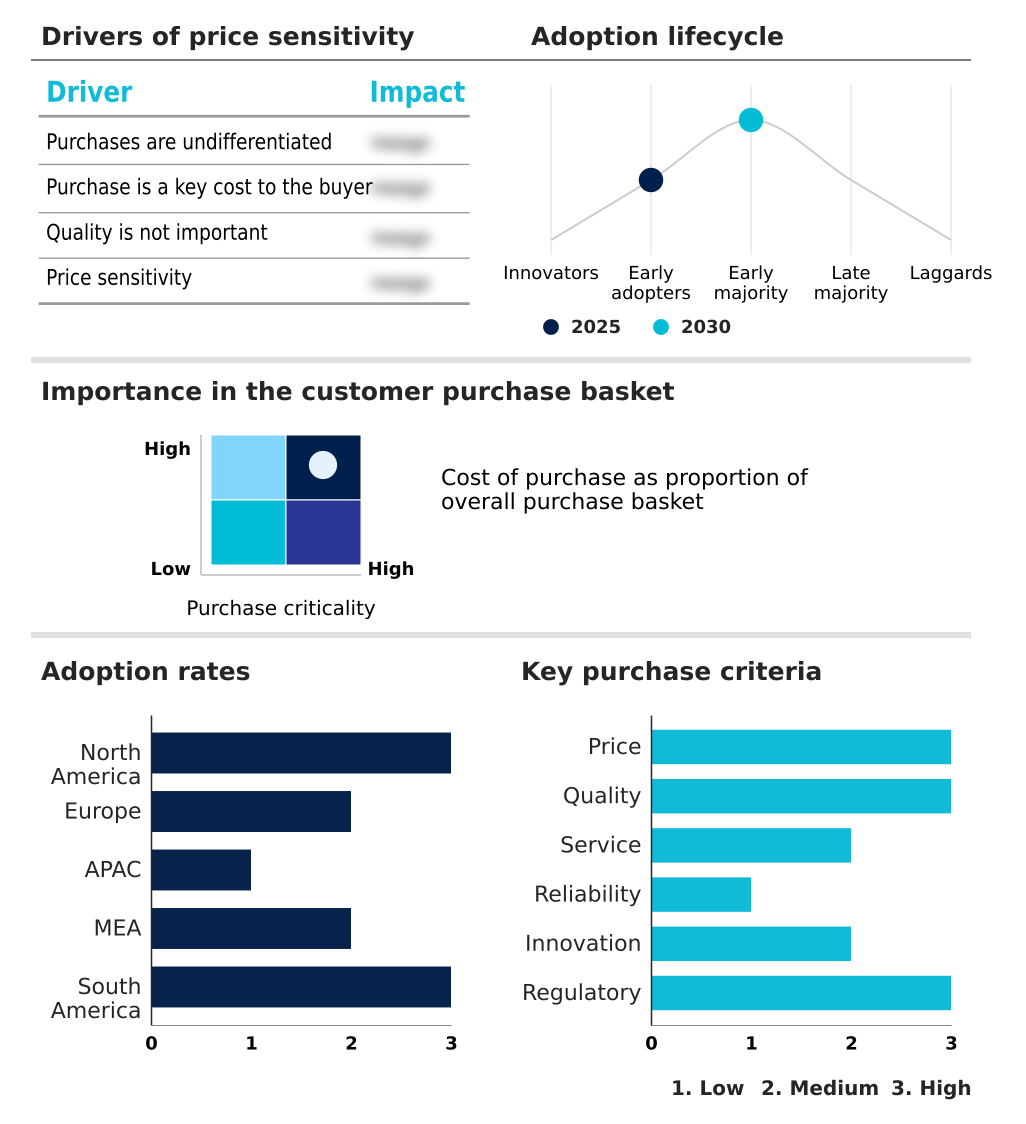
The ai-based assessment authoring tools market forecasting report includes the adoption lifecycle of the market, covering from the innovator’s stage to the laggard’s stage. It focuses on adoption rates in different regions based on penetration. Furthermore, the ai-based assessment authoring tools market report also includes key purchase criteria and drivers of price sensitivity to help companies evaluate and develop their market growth analysis strategies.

Customer Landscape of Ai-based Assessment Authoring Tools Industry

Competitive Landscape

Companies are implementing various strategies, such as strategic alliances, ai-based assessment authoring tools market forecast, partnerships, mergers and acquisitions, geographical expansion, and product/service launches, to enhance their presence in the industry.

Anthology Inc. - Offers AI-powered authoring assistance for generating quiz questions and rubrics, deeply integrated within learning management platforms to streamline assessment creation and improve instructional efficiency.

The industry research and growth report includes detailed analyses of the competitive landscape of the market and information about key companies, including:

  • Anthology Inc.
  • Articulate Global Inc.
  • Codility
  • Docebo Inc.
  • Exam.net
  • ExamSoft Worldwide LLC
  • Formative
  • HackerRank
  • HireVue Inc.
  • Instructure Holdings Inc.
  • iSpring Solutions Inc.
  • Kahoot
  • Magic School Inc.
  • Mercer LLC
  • Moodle
  • Nearpod Inc.
  • Proctorio Inc.
  • QuestgenAI Inc.
  • QuestionWell AI
  • Quillionz
  • TalentLMS

Qualitative and quantitative analysis of companies has been conducted to help clients understand the wider business environment as well as the strengths and weaknesses of key industry players. Data is qualitatively analyzed to categorize companies as pure play, category-focused, industry-focused, and diversified; it is quantitatively analyzed to categorize companies as dominant, leading, strong, tentative, and weak.

Recent Development and News in Ai-based assessment authoring tools market

  • In March, 2025, Anthology launched a multimodal content assistant in its Blackboard Learn platform, using generative models to create image-based questions and automated video captions for assessments.
  • In April, 2025, the IMS Global Learning Consortium released LTI Advantage update 1.4, establishing a new technical standard for securely transmitting generative AI prompts and metadata between authoring tools and learning platforms.
  • In May, 2025, Instructure enhanced its Canvas platform with an AI engine to help educators in North America create personalized assessment paths, automatically generating remedial or advanced questions based on student performance.
  • In May, 2025, Moodle released an advanced AI-integrated plugin to automate the evaluation of open-ended qualitative responses within its learning management system, enabling rapid scoring based on predefined faculty rubrics.

Dive into Technavio’s robust research methodology, blending expert interviews, extensive data synthesis, and validated models for unparalleled Ai-based Assessment Authoring Tools Market insights. See full methodology.

Market Scope
Page number 297
Base year 2025
Historic period 2020-2024
Forecast period 2026-2030
Growth momentum & CAGR Accelerate at a CAGR of 16.5%
Market growth 2026-2030 USD 2171.3 million
Market structure Fragmented
YoY growth 2025-2026(%) 15.7%
Key countries US, Canada, Mexico, UK, Germany, France, Italy, Spain, The Netherlands, China, India, Japan, Australia, South Korea, Indonesia, UAE, Saudi Arabia, South Africa, Israel, Turkey, Brazil, Argentina and Colombia
Competitive landscape Leading Companies, Market Positioning of Companies, Competitive Strategies, and Industry Risks

Request Free Sample

Research Analyst Overview

  • The market is defined by a strategic shift toward instructional design automation, where generative models and machine learning models are leveraged for dynamic question authoring. This evolution from manual creation addresses the core need for scalable, standards-aligned content.
  • The integration of adaptive testing algorithms, often based on item response theory, allows for evaluations tailored to individual cognitive processing styles, enabling more precise technical skills validation. For board-level consideration, the business case is compelling; this technology can reduce manual item bank management and authoring time by over 80%, directly impacting operational budgets.
  • Key capabilities include automated grading algorithms, automated rubric creation, and sophisticated plagiarism detection. As the industry matures, the focus is increasingly on algorithmic bias mitigation, the development of explainable artificial intelligence, and robust psychometric validation to ensure exam content security and maintain trust in competency-based assessment.
  • This requires careful management of assessment data sovereignty while providing real-time performance analytics and learning outcome mapping.

What are the Key Data Covered in this Ai-based Assessment Authoring Tools Market Research and Growth Report?

  • What is the expected growth of the Ai-based Assessment Authoring Tools Market between 2026 and 2030?

    • USD 2.17 billion, at a CAGR of 16.5%

  • What segmentation does the market report cover?

    • The report is segmented by Type (Automated grading, Adaptive testing, Online proctoring, and Others), Application (Higher education, Corporate training, K-12 education, Online learning, and Certification exams), Deployment (Cloud based, and On premises) and Geography (North America, Europe, APAC, Middle East and Africa, South America)

  • Which regions are analyzed in the report?

    • North America, Europe, APAC, Middle East and Africa and South America

  • What are the key growth drivers and market challenges?

    • Proliferation of personalized and adaptive learning ecosystems, Ethical integrity and mitigation of algorithmic bias

  • Who are the major players in the Ai-based Assessment Authoring Tools Market?

    • Anthology Inc., Articulate Global Inc., Codility, Docebo Inc., Exam.net, ExamSoft Worldwide LLC, Formative, HackerRank, HireVue Inc., Instructure Holdings Inc., iSpring Solutions Inc., Kahoot, Magic School Inc., Mercer LLC, Moodle, Nearpod Inc., Proctorio Inc., QuestgenAI Inc., QuestionWell AI, Quillionz and TalentLMS

Market Research Insights

  • Market dynamics are shifting toward intelligent automation, with cloud-native authoring platforms enabling continuous micro-assessment delivery and personalized learning paths. This transition is delivering measurable business outcomes, with some corporate training departments reporting a 60% acceleration in deploying assessment for corporate compliance materials. The use of ai-driven skills gap analysis and real-time feedback mechanisms improves learner engagement and competency.
  • Furthermore, secure online proctoring solutions with integrated behavioral analysis in proctoring can reduce academic integrity violations by over 80%. AI-assisted instructional design is no longer a niche capability but a core component for achieving k-12 curriculum alignment and effective higher education evaluation tools, driving a more efficient and data-informed pedagogical ecosystem.

We can help! Our analysts can customize this ai-based assessment authoring tools market research report to meet your requirements.

Get in touch

1. Executive Summary

1.1 Market overview

Executive Summary - Chart on Market Overview
Executive Summary - Data Table on Market Overview
Executive Summary - Chart on Global Market Characteristics
Executive Summary - Chart on Market by Geography
Executive Summary - Chart on Market Segmentation by Type
Executive Summary - Chart on Market Segmentation by Application
Executive Summary - Chart on Market Segmentation by Deployment
Executive Summary - Chart on Incremental Growth
Executive Summary - Data Table on Incremental Growth
Executive Summary - Chart on Company Market Positioning

2. Technavio Analysis

2.1 Analysis of price sensitivity, lifecycle, customer purchase basket, adoption rates, and purchase criteria

2.2 Criticality of inputs and Factors of differentiation

Chart on Overview on criticality of inputs and factors of differentiation

2.3 Factors of disruption

Chart on Overview on factors of disruption

2.4 Impact of drivers and challenges

Chart on Impact of drivers and challenges in 2025 and 2030

3. Market Landscape

3.1 Market ecosystem

Chart on Parent Market
Data Table on - Parent Market

3.2 Market characteristics

Chart on Market characteristics analysis

3.3 Value chain analysis

Chart on Value chain analysis

4. Market Sizing

4.1 Market definition

Data Table on Offerings of companies included in the market definition

4.2 Market segment analysis

Market segments

4.3 Market size 2025

4.4 Market outlook: Forecast for 2025-2030

Chart on Global - Market size and forecast 2025-2030 ($ million)
Data Table on Global - Market size and forecast 2025-2030 ($ million)
Chart on Global Market: Year-over-year growth 2025-2030 (%)
Data Table on Global Market: Year-over-year growth 2025-2030 (%)

5. Historic Market Size

5.1 Global AI-Based Assessment Authoring Tools Market 2020 - 2024

Historic Market Size - Data Table on Global AI-Based Assessment Authoring Tools Market 2020 - 2024 ($ million)

5.2 Type segment analysis 2020 - 2024

Historic Market Size - Type Segment 2020 - 2024 ($ million)

5.3 Application segment analysis 2020 - 2024

Historic Market Size - Application Segment 2020 - 2024 ($ million)

5.4 Deployment segment analysis 2020 - 2024

Historic Market Size - Deployment Segment 2020 - 2024 ($ million)

5.5 Geography segment analysis 2020 - 2024

Historic Market Size - Geography Segment 2020 - 2024 ($ million)

5.6 Country segment analysis 2020 - 2024

Historic Market Size - Country Segment 2020 - 2024 ($ million)

6. Five Forces Analysis

6.1 Five forces summary

Five forces analysis - Comparison between 2025 and 2030

6.2 Bargaining power of buyers

Bargaining power of buyers - Impact of key factors 2025 and 2030

6.3 Bargaining power of suppliers

Bargaining power of suppliers - Impact of key factors in 2025 and 2030

6.4 Threat of new entrants

Threat of new entrants - Impact of key factors in 2025 and 2030

6.5 Threat of substitutes

Threat of substitutes - Impact of key factors in 2025 and 2030

6.6 Threat of rivalry

Threat of rivalry - Impact of key factors in 2025 and 2030

6.7 Market condition

Chart on Market condition - Five forces 2025 and 2030

7. Market Segmentation by Type

7.1 Market segments

Chart on Type - Market share 2025-2030 (%)
Data Table on Type - Market share 2025-2030 (%)

7.2 Comparison by Type

Chart on Comparison by Type
Data Table on Comparison by Type

7.3 Automated grading - Market size and forecast 2025-2030

Chart on Automated grading - Market size and forecast 2025-2030 ($ million)
Data Table on Automated grading - Market size and forecast 2025-2030 ($ million)
Chart on Automated grading - Year-over-year growth 2025-2030 (%)
Data Table on Automated grading - Year-over-year growth 2025-2030 (%)

7.4 Adaptive testing - Market size and forecast 2025-2030

Chart on Adaptive testing - Market size and forecast 2025-2030 ($ million)
Data Table on Adaptive testing - Market size and forecast 2025-2030 ($ million)
Chart on Adaptive testing - Year-over-year growth 2025-2030 (%)
Data Table on Adaptive testing - Year-over-year growth 2025-2030 (%)

7.5 Online proctoring - Market size and forecast 2025-2030

Chart on Online proctoring - Market size and forecast 2025-2030 ($ million)
Data Table on Online proctoring - Market size and forecast 2025-2030 ($ million)
Chart on Online proctoring - Year-over-year growth 2025-2030 (%)
Data Table on Online proctoring - Year-over-year growth 2025-2030 (%)

7.6 Others - Market size and forecast 2025-2030

Chart on Others - Market size and forecast 2025-2030 ($ million)
Data Table on Others - Market size and forecast 2025-2030 ($ million)
Chart on Others - Year-over-year growth 2025-2030 (%)
Data Table on Others - Year-over-year growth 2025-2030 (%)

7.7 Market opportunity by Type

Market opportunity by Type ($ million)
Data Table on Market opportunity by Type ($ million)

8. Market Segmentation by Application

8.1 Market segments

Chart on Application - Market share 2025-2030 (%)
Data Table on Application - Market share 2025-2030 (%)

8.2 Comparison by Application

Chart on Comparison by Application
Data Table on Comparison by Application

8.3 Higher education - Market size and forecast 2025-2030

Chart on Higher education - Market size and forecast 2025-2030 ($ million)
Data Table on Higher education - Market size and forecast 2025-2030 ($ million)
Chart on Higher education - Year-over-year growth 2025-2030 (%)
Data Table on Higher education - Year-over-year growth 2025-2030 (%)

8.4 Corporate training - Market size and forecast 2025-2030

Chart on Corporate training - Market size and forecast 2025-2030 ($ million)
Data Table on Corporate training - Market size and forecast 2025-2030 ($ million)
Chart on Corporate training - Year-over-year growth 2025-2030 (%)
Data Table on Corporate training - Year-over-year growth 2025-2030 (%)

8.5 K-12 education - Market size and forecast 2025-2030

Chart on K-12 education - Market size and forecast 2025-2030 ($ million)
Data Table on K-12 education - Market size and forecast 2025-2030 ($ million)
Chart on K-12 education - Year-over-year growth 2025-2030 (%)
Data Table on K-12 education - Year-over-year growth 2025-2030 (%)

8.6 Online learning - Market size and forecast 2025-2030

Chart on Online learning - Market size and forecast 2025-2030 ($ million)
Data Table on Online learning - Market size and forecast 2025-2030 ($ million)
Chart on Online learning - Year-over-year growth 2025-2030 (%)
Data Table on Online learning - Year-over-year growth 2025-2030 (%)

8.7 Certification exams - Market size and forecast 2025-2030

Chart on Certification exams - Market size and forecast 2025-2030 ($ million)
Data Table on Certification exams - Market size and forecast 2025-2030 ($ million)
Chart on Certification exams - Year-over-year growth 2025-2030 (%)
Data Table on Certification exams - Year-over-year growth 2025-2030 (%)

8.8 Market opportunity by Application

Market opportunity by Application ($ million)
Data Table on Market opportunity by Application ($ million)

9. Market Segmentation by Deployment

9.1 Market segments

Chart on Deployment - Market share 2025-2030 (%)
Data Table on Deployment - Market share 2025-2030 (%)

9.2 Comparison by Deployment

Chart on Comparison by Deployment
Data Table on Comparison by Deployment

9.3 Cloud based - Market size and forecast 2025-2030

Chart on Cloud based - Market size and forecast 2025-2030 ($ million)
Data Table on Cloud based - Market size and forecast 2025-2030 ($ million)
Chart on Cloud based - Year-over-year growth 2025-2030 (%)
Data Table on Cloud based - Year-over-year growth 2025-2030 (%)

9.4 On premises - Market size and forecast 2025-2030

Chart on On premises - Market size and forecast 2025-2030 ($ million)
Data Table on On premises - Market size and forecast 2025-2030 ($ million)
Chart on On premises - Year-over-year growth 2025-2030 (%)
Data Table on On premises - Year-over-year growth 2025-2030 (%)

9.5 Market opportunity by Deployment

Market opportunity by Deployment ($ million)
Data Table on Market opportunity by Deployment ($ million)

10. Customer Landscape

10.1 Customer landscape overview

Analysis of price sensitivity, lifecycle, customer purchase basket, adoption rates, and purchase criteria

11. Geographic Landscape

11.1 Geographic segmentation

Chart on Market share by geography 2025-2030 (%)
Data Table on Market share by geography 2025-2030 (%)

11.2 Geographic comparison

Chart on Geographic comparison
Data Table on Geographic comparison

11.3 North America - Market size and forecast 2025-2030

Chart on North America - Market size and forecast 2025-2030 ($ million)
Data Table on North America - Market size and forecast 2025-2030 ($ million)
Chart on North America - Year-over-year growth 2025-2030 (%)
Data Table on North America - Year-over-year growth 2025-2030 (%)
Chart on Regional Comparison - North America
Data Table on Regional Comparison - North America

11.3.1 US - Market size and forecast 2025-2030

Chart on US - Market size and forecast 2025-2030 ($ million)
Data Table on US - Market size and forecast 2025-2030 ($ million)
Chart on US - Year-over-year growth 2025-2030 (%)
Data Table on US - Year-over-year growth 2025-2030 (%)

11.3.2 Canada - Market size and forecast 2025-2030

Chart on Canada - Market size and forecast 2025-2030 ($ million)
Data Table on Canada - Market size and forecast 2025-2030 ($ million)
Chart on Canada - Year-over-year growth 2025-2030 (%)
Data Table on Canada - Year-over-year growth 2025-2030 (%)

11.3.3 Mexico - Market size and forecast 2025-2030

Chart on Mexico - Market size and forecast 2025-2030 ($ million)
Data Table on Mexico - Market size and forecast 2025-2030 ($ million)
Chart on Mexico - Year-over-year growth 2025-2030 (%)
Data Table on Mexico - Year-over-year growth 2025-2030 (%)

11.4 Europe - Market size and forecast 2025-2030

Chart on Europe - Market size and forecast 2025-2030 ($ million)
Data Table on Europe - Market size and forecast 2025-2030 ($ million)
Chart on Europe - Year-over-year growth 2025-2030 (%)
Data Table on Europe - Year-over-year growth 2025-2030 (%)
Chart on Regional Comparison - Europe
Data Table on Regional Comparison - Europe

11.4.1 UK - Market size and forecast 2025-2030

Chart on UK - Market size and forecast 2025-2030 ($ million)
Data Table on UK - Market size and forecast 2025-2030 ($ million)
Chart on UK - Year-over-year growth 2025-2030 (%)
Data Table on UK - Year-over-year growth 2025-2030 (%)

11.4.2 Germany - Market size and forecast 2025-2030

Chart on Germany - Market size and forecast 2025-2030 ($ million)
Data Table on Germany - Market size and forecast 2025-2030 ($ million)
Chart on Germany - Year-over-year growth 2025-2030 (%)
Data Table on Germany - Year-over-year growth 2025-2030 (%)

11.4.3 France - Market size and forecast 2025-2030

Chart on France - Market size and forecast 2025-2030 ($ million)
Data Table on France - Market size and forecast 2025-2030 ($ million)
Chart on France - Year-over-year growth 2025-2030 (%)
Data Table on France - Year-over-year growth 2025-2030 (%)

11.4.4 Italy - Market size and forecast 2025-2030

Chart on Italy - Market size and forecast 2025-2030 ($ million)
Data Table on Italy - Market size and forecast 2025-2030 ($ million)
Chart on Italy - Year-over-year growth 2025-2030 (%)
Data Table on Italy - Year-over-year growth 2025-2030 (%)

11.4.5 Spain - Market size and forecast 2025-2030

Chart on Spain - Market size and forecast 2025-2030 ($ million)
Data Table on Spain - Market size and forecast 2025-2030 ($ million)
Chart on Spain - Year-over-year growth 2025-2030 (%)
Data Table on Spain - Year-over-year growth 2025-2030 (%)

11.4.6 The Netherlands - Market size and forecast 2025-2030

Chart on The Netherlands - Market size and forecast 2025-2030 ($ million)
Data Table on The Netherlands - Market size and forecast 2025-2030 ($ million)
Chart on The Netherlands - Year-over-year growth 2025-2030 (%)
Data Table on The Netherlands - Year-over-year growth 2025-2030 (%)

11.5 APAC - Market size and forecast 2025-2030

Chart on APAC - Market size and forecast 2025-2030 ($ million)
Data Table on APAC - Market size and forecast 2025-2030 ($ million)
Chart on APAC - Year-over-year growth 2025-2030 (%)
Data Table on APAC - Year-over-year growth 2025-2030 (%)
Chart on Regional Comparison - APAC
Data Table on Regional Comparison - APAC

11.5.1 China - Market size and forecast 2025-2030

Chart on China - Market size and forecast 2025-2030 ($ million)
Data Table on China - Market size and forecast 2025-2030 ($ million)
Chart on China - Year-over-year growth 2025-2030 (%)
Data Table on China - Year-over-year growth 2025-2030 (%)

11.5.2 India - Market size and forecast 2025-2030

Chart on India - Market size and forecast 2025-2030 ($ million)
Data Table on India - Market size and forecast 2025-2030 ($ million)
Chart on India - Year-over-year growth 2025-2030 (%)
Data Table on India - Year-over-year growth 2025-2030 (%)

11.5.3 Japan - Market size and forecast 2025-2030

Chart on Japan - Market size and forecast 2025-2030 ($ million)
Data Table on Japan - Market size and forecast 2025-2030 ($ million)
Chart on Japan - Year-over-year growth 2025-2030 (%)
Data Table on Japan - Year-over-year growth 2025-2030 (%)

11.5.4 Australia - Market size and forecast 2025-2030

Chart on Australia - Market size and forecast 2025-2030 ($ million)
Data Table on Australia - Market size and forecast 2025-2030 ($ million)
Chart on Australia - Year-over-year growth 2025-2030 (%)
Data Table on Australia - Year-over-year growth 2025-2030 (%)

11.5.5 South Korea - Market size and forecast 2025-2030

Chart on South Korea - Market size and forecast 2025-2030 ($ million)
Data Table on South Korea - Market size and forecast 2025-2030 ($ million)
Chart on South Korea - Year-over-year growth 2025-2030 (%)
Data Table on South Korea - Year-over-year growth 2025-2030 (%)

11.5.6 Indonesia - Market size and forecast 2025-2030

Chart on Indonesia - Market size and forecast 2025-2030 ($ million)
Data Table on Indonesia - Market size and forecast 2025-2030 ($ million)
Chart on Indonesia - Year-over-year growth 2025-2030 (%)
Data Table on Indonesia - Year-over-year growth 2025-2030 (%)

11.6 Middle East and Africa - Market size and forecast 2025-2030

Chart on Middle East and Africa - Market size and forecast 2025-2030 ($ million)
Data Table on Middle East and Africa - Market size and forecast 2025-2030 ($ million)
Chart on Middle East and Africa - Year-over-year growth 2025-2030 (%)
Data Table on Middle East and Africa - Year-over-year growth 2025-2030 (%)
Chart on Regional Comparison - Middle East and Africa
Data Table on Regional Comparison - Middle East and Africa

11.6.1 UAE - Market size and forecast 2025-2030

Chart on UAE - Market size and forecast 2025-2030 ($ million)
Data Table on UAE - Market size and forecast 2025-2030 ($ million)
Chart on UAE - Year-over-year growth 2025-2030 (%)
Data Table on UAE - Year-over-year growth 2025-2030 (%)

11.6.2 Saudi Arabia - Market size and forecast 2025-2030

Chart on Saudi Arabia - Market size and forecast 2025-2030 ($ million)
Data Table on Saudi Arabia - Market size and forecast 2025-2030 ($ million)
Chart on Saudi Arabia - Year-over-year growth 2025-2030 (%)
Data Table on Saudi Arabia - Year-over-year growth 2025-2030 (%)

11.6.3 South Africa - Market size and forecast 2025-2030

Chart on South Africa - Market size and forecast 2025-2030 ($ million)
Data Table on South Africa - Market size and forecast 2025-2030 ($ million)
Chart on South Africa - Year-over-year growth 2025-2030 (%)
Data Table on South Africa - Year-over-year growth 2025-2030 (%)

11.6.4 Israel - Market size and forecast 2025-2030

Chart on Israel - Market size and forecast 2025-2030 ($ million)
Data Table on Israel - Market size and forecast 2025-2030 ($ million)
Chart on Israel - Year-over-year growth 2025-2030 (%)
Data Table on Israel - Year-over-year growth 2025-2030 (%)

11.6.5 Turkey - Market size and forecast 2025-2030

Chart on Turkey - Market size and forecast 2025-2030 ($ million)
Data Table on Turkey - Market size and forecast 2025-2030 ($ million)
Chart on Turkey - Year-over-year growth 2025-2030 (%)
Data Table on Turkey - Year-over-year growth 2025-2030 (%)

11.7 South America - Market size and forecast 2025-2030

Chart on South America - Market size and forecast 2025-2030 ($ million)
Data Table on South America - Market size and forecast 2025-2030 ($ million)
Chart on South America - Year-over-year growth 2025-2030 (%)
Data Table on South America - Year-over-year growth 2025-2030 (%)
Chart on Regional Comparison - South America
Data Table on Regional Comparison - South America

11.7.1 Brazil - Market size and forecast 2025-2030

Chart on Brazil - Market size and forecast 2025-2030 ($ million)
Data Table on Brazil - Market size and forecast 2025-2030 ($ million)
Chart on Brazil - Year-over-year growth 2025-2030 (%)
Data Table on Brazil - Year-over-year growth 2025-2030 (%)

11.7.2 Argentina - Market size and forecast 2025-2030

Chart on Argentina - Market size and forecast 2025-2030 ($ million)
Data Table on Argentina - Market size and forecast 2025-2030 ($ million)
Chart on Argentina - Year-over-year growth 2025-2030 (%)
Data Table on Argentina - Year-over-year growth 2025-2030 (%)

11.7.3 Colombia - Market size and forecast 2025-2030

Chart on Colombia - Market size and forecast 2025-2030 ($ million)
Data Table on Colombia - Market size and forecast 2025-2030 ($ million)
Chart on Colombia - Year-over-year growth 2025-2030 (%)
Data Table on Colombia - Year-over-year growth 2025-2030 (%)

11.8 Market opportunity by geography

Market opportunity by geography ($ million)
Data Tables on Market opportunity by geography ($ million)

12. Drivers, Challenges, and Opportunity

12.1 Market drivers

Proliferation of personalized and adaptive learning ecosystems
Necessity for operational efficiency and cost mitigation in corporate training
Enhancing academic integrity and security in era of remote evaluation

12.2 Market challenges

Ethical integrity and mitigation of algorithmic bias
Regulatory stringency and global data privacy standards
Interoperability hurdles and persistence of technical debt

12.3 Impact of drivers and challenges

Impact of drivers and challenges in 2025 and 2030

12.4 Market opportunities

Integration of multimodal generative AI in content creation
Ascendance of scenario-based and gamified evaluation frameworks
Transition toward continuous micro-assessment and real-time feedback loops

13. Competitive Landscape

13.1 Overview

13.2

Overview on criticality of inputs and factors of differentiation

13.3 Landscape disruption

Overview on factors of disruption

13.4 Industry risks

Impact of key risks on business

14. Competitive Analysis

14.1 Companies profiled

Companies covered

14.2 Company ranking index

14.3 Market positioning of companies

Matrix on companies position and classification

14.4 Anthology Inc.

Anthology Inc. - Overview
Anthology Inc. - Product / Service
Anthology Inc. - Key news
Anthology Inc. - Key offerings
SWOT

14.5 Articulate Global Inc.

Articulate Global Inc. - Overview
Articulate Global Inc. - Product / Service
Articulate Global Inc. - Key offerings
SWOT

14.6 Codility

Codility - Overview
Codility - Product / Service
Codility - Key offerings
SWOT

14.7 Docebo Inc.

Docebo Inc. - Overview
Docebo Inc. - Product / Service
Docebo Inc. - Key news
Docebo Inc. - Key offerings
SWOT

14.8 Exam.net

Exam.net - Overview
Exam.net - Product / Service
Exam.net - Key offerings
SWOT

14.9 ExamSoft Worldwide LLC

ExamSoft Worldwide LLC - Overview
ExamSoft Worldwide LLC - Product / Service
ExamSoft Worldwide LLC - Key offerings
SWOT

14.10 Formative

Formative - Overview
Formative - Product / Service
Formative - Key offerings
SWOT

14.11 HackerRank

HackerRank - Overview
HackerRank - Product / Service
HackerRank - Key offerings
SWOT

14.12 HireVue Inc.

HireVue Inc. - Overview
HireVue Inc. - Product / Service
HireVue Inc. - Key offerings
SWOT

14.13 Instructure Holdings Inc.

Instructure Holdings Inc. - Overview
Instructure Holdings Inc. - Product / Service
Instructure Holdings Inc. - Key news
Instructure Holdings Inc. - Key offerings
SWOT

14.14 iSpring Solutions Inc.

iSpring Solutions Inc. - Overview
iSpring Solutions Inc. - Product / Service
iSpring Solutions Inc. - Key offerings
SWOT

14.15 Kahoot

Kahoot - Overview
Kahoot - Product / Service
Kahoot - Key offerings
SWOT

14.16 Magic School Inc.

Magic School Inc. - Overview
Magic School Inc. - Product / Service
Magic School Inc. - Key offerings
SWOT

14.17 Mercer LLC

Mercer LLC - Overview
Mercer LLC - Product / Service
Mercer LLC - Key offerings
SWOT

14.18 Moodle

Moodle - Overview
Moodle - Product / Service
Moodle - Key offerings
SWOT

15. Appendix

15.1 Scope of the report

Market definition
Objectives
Notes and caveats

15.2 Inclusions and exclusions checklist

Inclusions checklist
Exclusions checklist

15.3 Currency conversion rates for US$

15.4 Research methodology

15.5 Data procurement

Information sources

15.6 Data validation

15.7 Validation techniques employed for market sizing

15.8 Data synthesis

15.9 360 degree market analysis

15.10 List of abbreviations

Research Methodology

Technavio presents a detailed picture of the market by way of study, synthesis, and summation of data from multiple sources. The analysts have presented the various facets of the market with a particular focus on identifying the key industry influencers. The data thus presented is comprehensive, reliable, and the result of extensive research, both primary and secondary.

INFORMATION SOURCES

Primary sources

  • Manufacturers and suppliers
  • Channel partners
  • Industry experts
  • Strategic decision makers

Secondary sources

  • Industry journals and periodicals
  • Government data
  • Financial reports of key industry players
  • Historical data
  • Press releases

DATA ANALYSIS

Data Synthesis

  • Collation of data
  • Estimation of key figures
  • Analysis of derived insights

Data Validation

  • Triangulation with data models
  • Reference against proprietary databases
  • Corroboration with industry experts

REPORT WRITING

Qualitative

  • Market drivers
  • Market challenges
  • Market trends
  • Five forces analysis

Quantitative

  • Market size and forecast
  • Market segmentation
  • Geographical insights
  • Competitive landscape

Interested in this report?

Get your sample now to see our research methodology and insights!

Download Now

Frequently Asked Questions

Ai-based Assessment Authoring Tools market growth will increase by USD 2171.3 million during 2026-2030.

The Ai-based Assessment Authoring Tools market is expected to grow at a CAGR of 16.5% during 2026-2030.

Ai-based Assessment Authoring Tools market is segmented by Type (Automated grading, Adaptive testing, Online proctoring, Others) Application (Higher education, Corporate training, K-12 education, Online learning, Certification exams) Deployment (Cloud based, On premises)

Anthology Inc., Articulate Global Inc., Codility, Docebo Inc., Exam.net, ExamSoft Worldwide LLC, Formative, HackerRank, HireVue Inc., Instructure Holdings Inc., iSpring Solutions Inc., Kahoot, Magic School Inc., Mercer LLC, Moodle, Nearpod Inc., Proctorio Inc., QuestgenAI Inc., QuestionWell AI, Quillionz, TalentLMS are a few of the key vendors in the Ai-based Assessment Authoring Tools market.

North America will register the highest growth rate of 42.1% among the other regions. Therefore, the Ai-based Assessment Authoring Tools market in North America is expected to garner significant business opportunities for the vendors during the forecast period.

US, Canada, Mexico, UK, Germany, France, Italy, Spain, The Netherlands, China, India, Japan, Australia, South Korea, Indonesia, UAE, Saudi Arabia, South Africa, Israel, Turkey, Brazil, Argentina, Colombia

  • Proliferation of personalized and adaptive learning ecosystems is the driving factor this market.

The Ai-based Assessment Authoring Tools market vendors should focus on grabbing business opportunities from the Type segment as it accounted for the largest market share in the base year.
RIA - Research AI Assistant
Ask RIA