Ai-Enabled Radiology Triage Systems Market Size and Growth Forecast 2026-2030
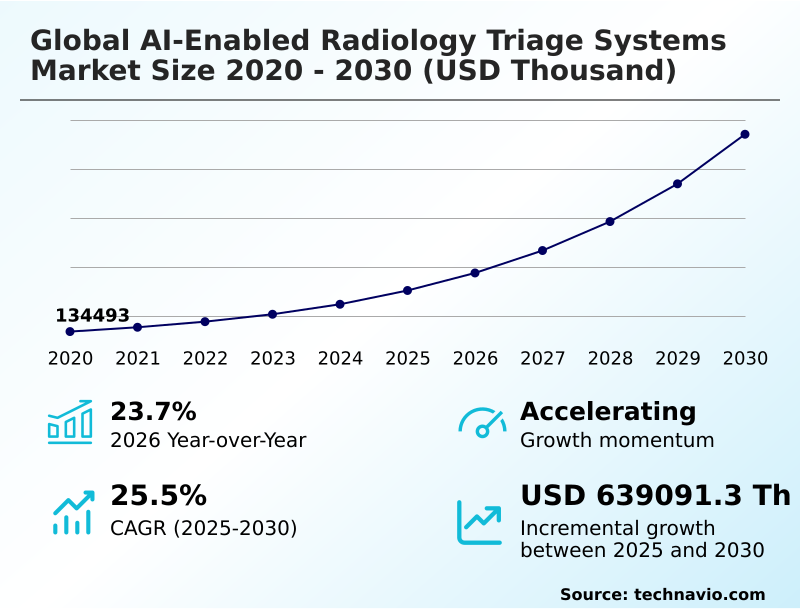
The Ai-Enabled Radiology Triage Systems Market size was valued at USD 302.57 million in 2025 growing at a CAGR of 25.5% during the forecast period 2026-2030.
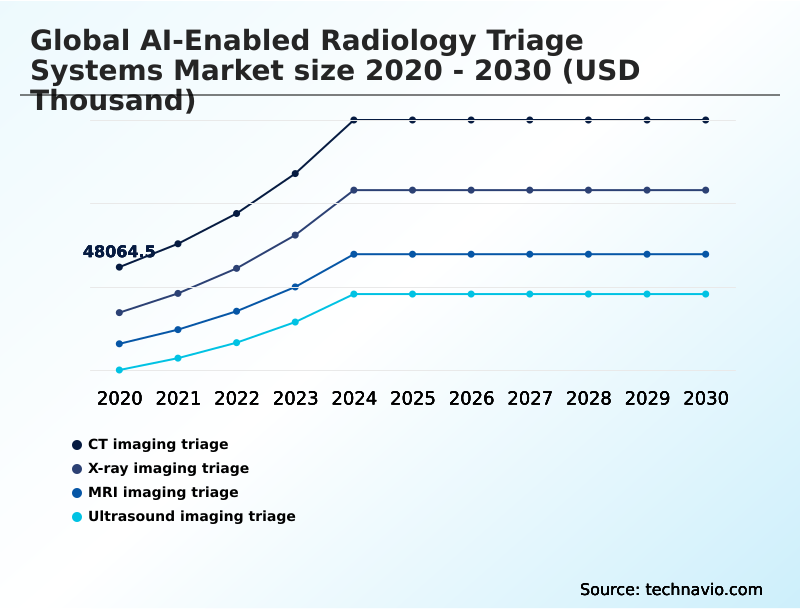
North America accounts for 37.8% of incremental growth during the forecast period. The CT imaging triage segment by Solution was valued at USD 85.83 million in 2024, while the Hospitals and clinics segment holds the largest revenue share by End-user.
The market is projected to grow by from 2020 to 2030, with USD 639.09 million of the growth expected during the forecast period of 2025 to 2030.
Get Key Insights on Market Forecast (PDF) Request Free Sample
Ai-Enabled Radiology Triage Systems Market Overview
The AI-enabled radiology triage systems market is defined by the strategic necessity for healthcare institutions to optimize diagnostic workflows amidst escalating imaging volumes. The core value lies in creating a digital prioritization layer that ensures acute pathologies receive immediate attention, a critical function as North America alone is projected to account for over 37% of the market's incremental growth. These platforms facilitate real-time triage notification and integrate with picture archiving and communication systems (PACS) to automate radiologist worklist prioritization. For instance, a level-one trauma center deploying an AI platform for multi-pathology triage can automatically flag potential cases of large vessel occlusion and intracranial hemorrhage across hundreds of incoming scans. This allows the stroke team to be mobilized seconds after image acquisition, significantly improving turnaround times compared to manual worklist reviews and directly impacting patient outcomes. This shift toward diagnostic workflow automation makes such systems a cornerstone of modern emergency medicine.
Drivers, Trends, and Challenges in the Ai-Enabled Radiology Triage Systems Market
Procurement decisions are increasingly influenced by the demonstrated ROI of AI radiology triage systems and their ability to integrate into complex clinical environments. The choice between cloud vs on-premise AI radiology solutions often hinges on an institution's data governance policies and IT capabilities, with federated learning emerging as a key trend to address data privacy concerns under frameworks like HIPAA.
The expansion of AI triage for chronic disease management, particularly in applications like AI in lung cancer screening, broadens the technology's value proposition beyond acute care. For instance, a large hospital network evaluating an AI platform for multi-pathology triage must consider not only its FDA clearance for specific findings but also its effectiveness in reducing radiologist burnout with AI-driven prioritization.
This holistic assessment, which includes improving turnaround times with AI, is essential for justifying capital expenditure in a value-based care landscape where efficiency and outcomes are directly linked to financial performance. The technology's ability to seamlessly support these dual objectives is becoming a primary criterion for adoption, representing a significant shift from earlier models focused solely on singular-finding detection.
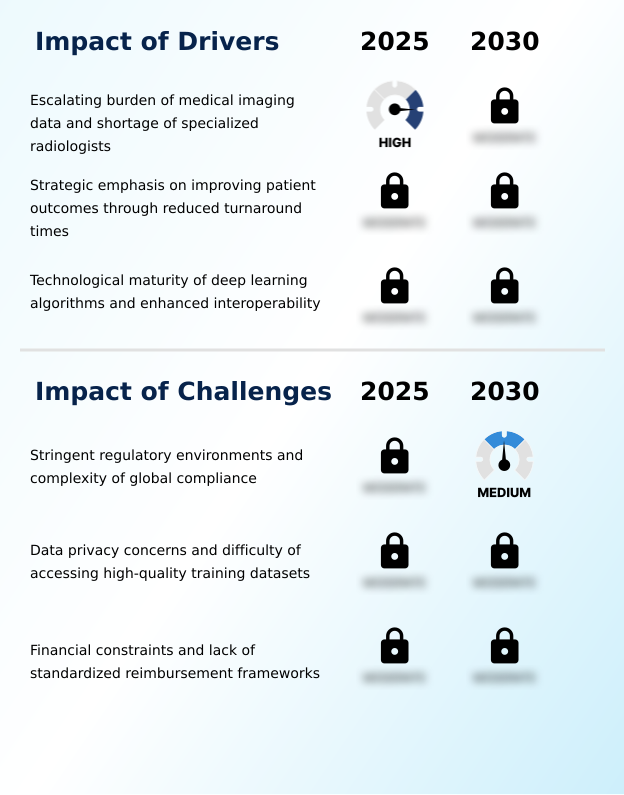
Primary Growth Driver: The escalating burden of medical imaging data, compounded by a shortage of specialized radiologists, serves as a primary driver for market adoption.
Market momentum is fueled by the critical need to manage escalating volumes of medical imaging data that outpace the availability of specialized radiologists.
The technological maturity of deep learning algorithms has resulted in AI-powered diagnostic tools with high sensitivity for acute pathology detection, bolstering clinical confidence.
These systems provide essential diagnostic workflow automation, enabling radiologist worklist prioritization to ensure the most urgent cases, such as those identified by AI for stroke detection, are reviewed immediately.
The strategic emphasis on improving turnaround times is a primary driver, as rapid intervention is directly linked to better patient outcomes and reduced healthcare costs.
This capability for rapid, automated triage is fundamental to sustaining the operational capacity of modern diagnostic departments worldwide.
Emerging Market Trend: The proliferation of multimodal AI and the integration of large language models represent a transformative market trend, enhancing diagnostic capabilities.
The market is advancing beyond single-modality analysis toward the proliferation of multimodal AI. Modern systems are integrating large language models to provide automated summaries generation, combining imaging findings with data from electronic health records for a more holistic patient assessment. This convergence enables more sophisticated AI-based care coordination.
A significant development is the adoption of federated learning, which allows institutions to collaboratively train algorithms without sharing sensitive patient information, thus addressing data privacy concerns. Furthermore, the application scope is expanding from emergency rooms to proactive patient management, with AI for chronic disease management now monitoring long-term conditions.
This shift toward comprehensive diagnostic support is transforming the role of AI from a simple alert system to an integral part of the clinical decision-making pathway.
Key Industry Challenge: Stringent regulatory environments and the complexity of achieving global compliance present a significant challenge affecting industry growth and innovation.
A primary market constraint is the complexity of navigating stringent and fragmented regulatory environments, including securing FDA clearance in the US and adhering to the Medical Device Regulation in Europe. The lack of standardized reimbursement frameworks creates financial uncertainty for healthcare providers, hindering widespread adoption.
Data-related issues, including strict patient data privacy rules under HIPAA and GDPR, make it difficult to access the high-quality, diverse datasets needed for training. This scarcity can lead to algorithm bias mitigation challenges and slows the development cycle.
Furthermore, data integration issues with existing hospital IT systems can complicate deployment, making the transition to advanced AI platforms a significant operational and financial undertaking for many institutions without clear financial incentives.
Explore Full Market Dynamics Analysis Request Free Sample
Ai-Enabled Radiology Triage Systems Market Segmentation
The ai-enabled radiology triage systems industry research report provides comprehensive data including region-wise segment analysis, with forecasts and analysis for the period 2026-2030, as well as historical data from 2020-2024 for the following segments.
Solution Segment Analysis
The ct imaging triage segment is estimated to witness significant growth during the forecast period.
Computed tomography provides high-resolution, three-dimensional views essential for diagnosing acute conditions. In this context, AI for CT scan analysis allows for the rapid identification of life-threatening findings, such as intracranial hemorrhage detection, by processing hundreds of image slices in seconds.
This capability, representing over 34% of the market, ensures the most critical cases are prioritized on the radiologist's worklist. The adoption of these systems is driven by the urgent need to reduce the time from scan to treatment.
The seamless integration of these tools into existing picture archiving and communication systems (PACS) is crucial to avoid workflow disruptions.
As CT scan volumes rise, automated clinical decision support becomes vital for diagnostic precision, with quantitative analysis features further enhancing utility in diverse clinical settings.
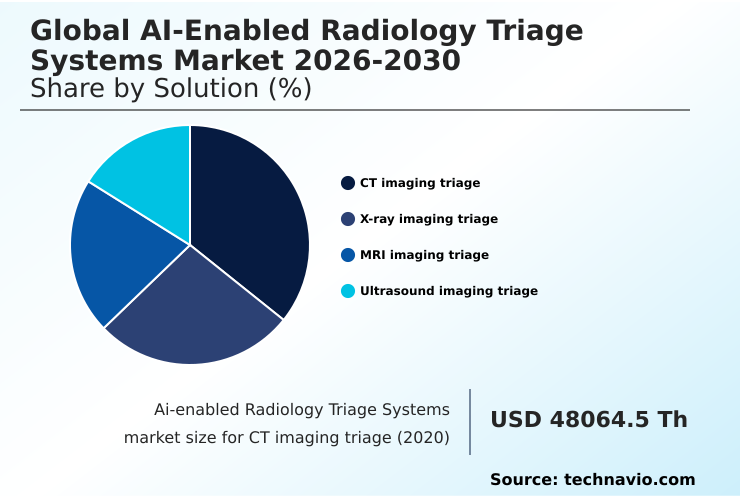
The CT imaging triage segment was valued at USD 85.83 million in 2024 and showed a gradual increase during the forecast period.
Ai-Enabled Radiology Triage Systems Market by Region: North America Leads with 37.8% Growth Share
North America is estimated to contribute 37.8% to the growth of the global market during the forecast period.
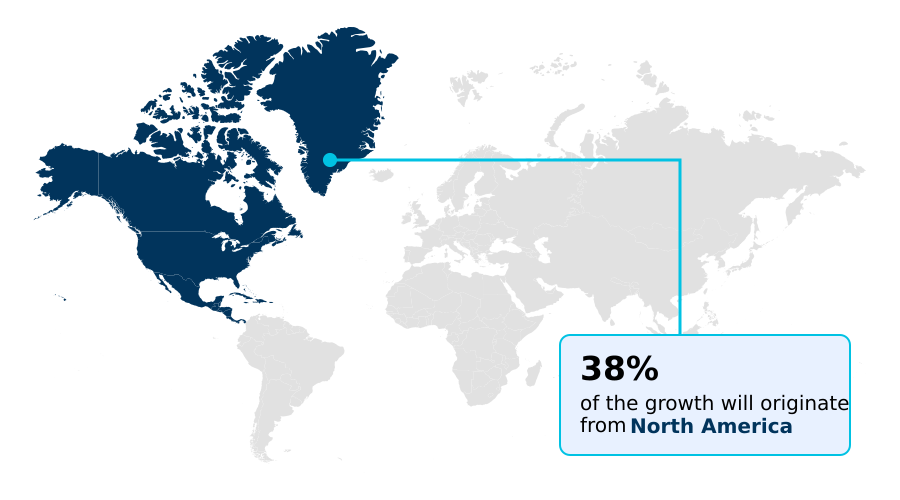
The geographic landscape is characterized by diverse adoption drivers and regulatory environments. North America leads due to its advanced healthcare infrastructure and significant venture capital investment, contributing nearly 38% of the market's growth.
Europe follows, with a strong emphasis on data protection under GDPR and standardized protocols.
The APAC region, however, is poised for the fastest expansion, with a growth rate of 26.5%, driven by massive healthcare investments in countries like China and India to address a high patient-to-radiologist ratio.
AI in diagnostic imaging centers and teleradiology AI support are particularly critical in this region to bridge the gap in specialist access.
The complexity of global compliance remains a factor for vendors, who must adapt their AI-powered diagnostic tools to varying value-based care models and local regulations to succeed.
Customer Landscape Analysis for the Ai-Enabled Radiology Triage Systems Market
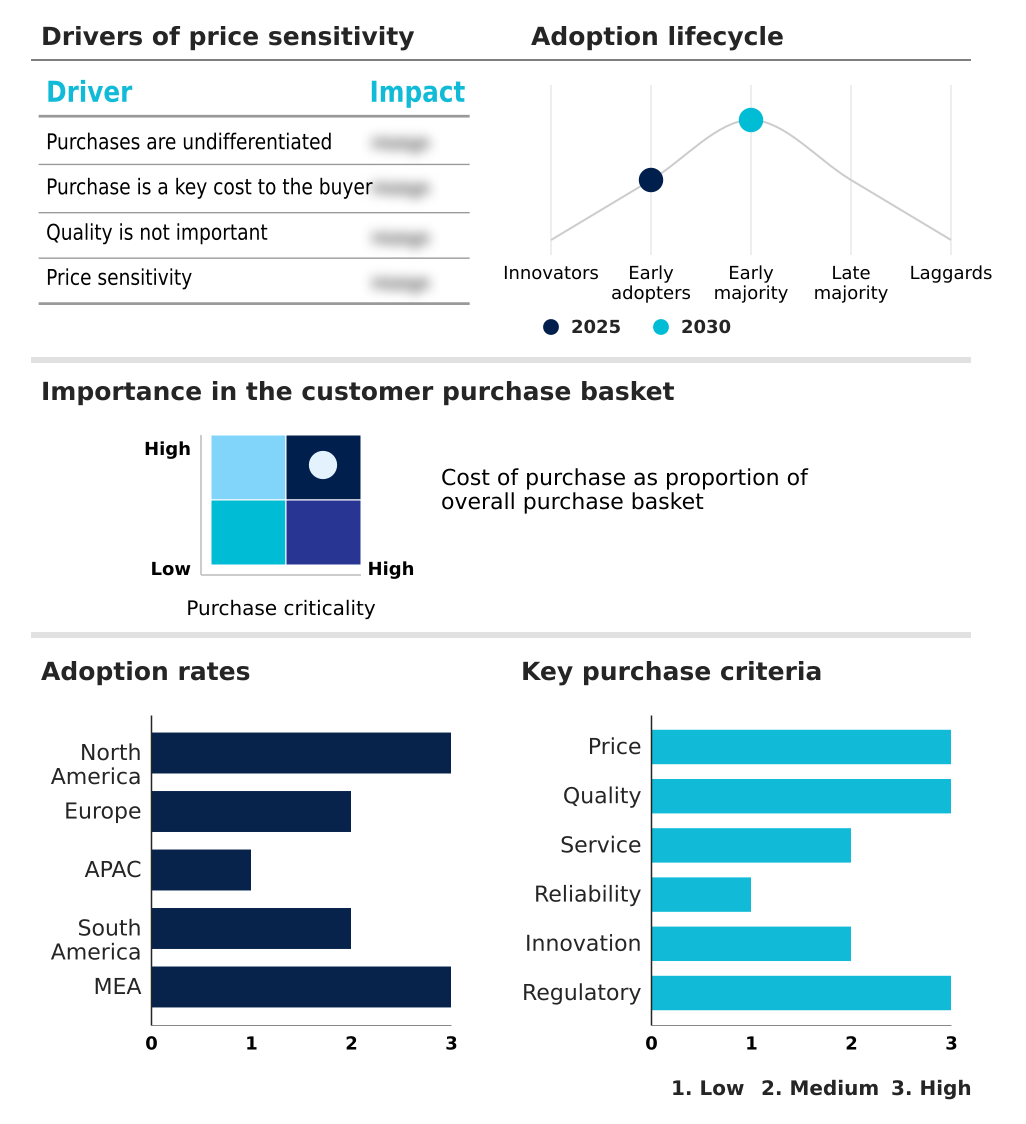
The ai-enabled radiology triage systems market forecasting report includes the adoption lifecycle of the market, covering from the innovator’s stage to the laggard’s stage. It focuses on adoption rates in different regions based on penetration. Furthermore, the ai-enabled radiology triage systems market report also includes key purchase criteria and drivers of price sensitivity to help companies evaluate and develop their market growth analysis strategies.
Competitive Landscape of the Ai-Enabled Radiology Triage Systems Market
Companies are implementing various strategies, such as strategic alliances, partnerships, mergers and acquisitions, geographical expansion, and product/service launches, to enhance their presence in the ai-enabled radiology triage systems market industry.
Aidoc Medical Ltd. - Offers a comprehensive AI platform that supports and enhances radiologist diagnostic power, helping to expedite patient treatment and improve the quality of care.
The industry research and growth report includes detailed analyses of the competitive landscape of the market and information about key companies, including:
- Aidoc Medical Ltd.
- Avicenna.AI
- AZmed
- contextflow GmbH
- DeepHealth
- DeepTek.ai, Inc
- GLEAMER
- icometrix
- Koios Medical Inc.
- Koninklijke Philips NV
- Lunit Inc.
- Milvue
- Nano-X Imaging Ltd.
- Oxipit
- Qure.ai Technologies Pvt. Ltd.
- RapidAI
- Riverain Technologies
- Siemens AG
- Tempus AI Inc.
- Viz.ai Inc.
Qualitative and quantitative analysis of companies has been conducted to help clients understand the wider business environment as well as the strengths and weaknesses of key industry players. Data is qualitatively analyzed to categorize companies as pure play, category-focused, industry-focused, and diversified; it is quantitatively analyzed to categorize companies as dominant, leading, strong, tentative, and weak.
Recent Developments in the Ai-Enabled Radiology Triage Systems Market
- In November, 2024, a2z Radiology AI announced the successful completion of a $4.5 million seed funding round with participation from Khosla Ventures and SeaX Ventures to accelerate commercial rollout of its FDA-cleared triage platform.
- In January, 2025, Aidoc announced the expansion of its strategic partnership with WellSpan Health, a collaboration aimed at further integrating its AI-powered solutions across the health system to enhance clinical workflow efficiency.
- In February, 2025, Harrison.ai entered into a strategic partnership with Apollo Radiology International (ARI) to integrate its diagnostic assistant solutions for Chest X-ray and Brain CT imaging into ARI's global reporting network.
- In April, 2025, a2z Radiology AI obtained U.S. Food and Drug Administration (FDA) clearance for its a2z-Unified-Triage solution, designed to concurrently detect and prioritize seven urgent findings on abdomen-pelvis CT scans.
Research Analyst Overview: Ai-Enabled Radiology Triage Systems Market
Boardroom-level decisions on IT capital expenditure are increasingly shaped by the operational impact of AI platforms rather than standalone point solutions. The market is consolidating around vendors offering comprehensive diagnostic workflow automation through enterprise-wide AI platforms.
These systems, which provide a unified interface for everything from intracranial hemorrhage detection and pulmonary embolism detection to bone fracture detection, simplify procurement and integration. Compliance with technical standards like DICOM is a baseline requirement, but the key differentiator is the ability to facilitate seamless radiologist worklist prioritization across an entire health system.
For instance, a system's capacity for quantitative analysis and integration with electronic health records (EHR) for multimodal AI analysis directly impacts its total cost of ownership and clinical utility.
As hospitals aim to improve both patient outcomes and resource allocation, with the CT imaging triage segment alone constituting a significant portion of the market, the adoption of integrated clinical decision support and neurovascular triage tools becomes a strategic imperative, driving the demand for platforms over individual algorithms.
Dive into Technavio’s robust research methodology, blending expert interviews, extensive data synthesis, and validated models for unparalleled Ai-Enabled Radiology Triage Systems Market insights. See full methodology.
| Market Scope | |
|---|---|
| Page number | 286 |
| Base year | 2025 |
| Historic period | 2020-2024 |
| Forecast period | 2026-2030 |
| Growth momentum & CAGR | Accelerate at a CAGR of 25.5% |
| Market growth 2026-2030 | USD 639091.3 thousand |
| Market structure | Fragmented |
| YoY growth 2025-2026(%) | 23.7% |
| Key countries | US, Canada, Mexico, Germany, UK, France, The Netherlands, Italy, Spain, China, Japan, India, Australia, South Korea, Indonesia, Brazil, Argentina, Colombia, South Africa, Israel, Saudi Arabia, UAE and Turkey |
| Competitive landscape | Leading Companies, Market Positioning of Companies, Competitive Strategies, and Industry Risks |
Ai-Enabled Radiology Triage Systems Market: Key Questions Answered in This Report
-
What is the expected growth of the Ai-Enabled Radiology Triage Systems Market between 2026 and 2030?
-
The Ai-Enabled Radiology Triage Systems Market is expected to grow by USD 639.09 million during 2026-2030, registering a CAGR of 25.5%. Year-over-year growth in 2026 is estimated at 23.7%%. This acceleration is shaped by escalating burden of medical imaging data and shortage of specialized radiologists, which is intensifying demand across multiple end-use verticals covered in the report.
-
-
What segmentation does the market report cover?
-
The report is segmented by Solution (CT imaging triage, X-ray imaging triage, MRI imaging triage, and Ultrasound imaging triage), End-user (Hospitals and clinics, and Diagnostic imaging centers), Deployment (Cloud-based, and On-premises) and Geography (North America, Europe, APAC, South America, Middle East and Africa). Among these, the CT imaging triage segment is estimated to witness significant growth during the forecast period, driven by rising adoption across key application areas. Each segment includes detailed qualitative and quantitative analysis, along with historical data from 2020-2024 and forecasts through 2030 with year-over-year growth rates.
-
-
Which regions are analyzed in the report?
-
The report covers North America, Europe, APAC, South America and Middle East and Africa. North America is estimated to contribute 37.8% to market growth during the forecast period. Country-level analysis includes US, Canada, Mexico, Germany, UK, France, The Netherlands, Italy, Spain, China, Japan, India, Australia, South Korea, Indonesia, Brazil, Argentina, Colombia, South Africa, Israel, Saudi Arabia, UAE and Turkey, with dedicated market size tables and year-over-year growth for each.
-
-
What are the key growth drivers and market challenges?
-
The primary driver is escalating burden of medical imaging data and shortage of specialized radiologists, which is accelerating investment and industry demand. The main challenge is stringent regulatory environments and complexity of global compliance, creating operational barriers for key market participants. The report quantifies the impact of each driver and challenge across 2026 and 2030 with comparative analysis.
-
-
Who are the major players in the Ai-Enabled Radiology Triage Systems Market?
-
Key vendors include Aidoc Medical Ltd., Avicenna.AI, AZmed, contextflow GmbH, DeepHealth, DeepTek.ai, Inc, GLEAMER, icometrix, Koios Medical Inc., Koninklijke Philips NV, Lunit Inc., Milvue, Nano-X Imaging Ltd., Oxipit, Qure.ai Technologies Pvt. Ltd., RapidAI, Riverain Technologies, Siemens AG, Tempus AI Inc. and Viz.ai Inc.. The report provides qualitative and quantitative analysis categorizing companies as dominant, leading, strong, tentative, and weak based on their market positioning. Company profiles include business segment analysis, SWOT assessment, key offerings, and recent strategic developments.
-
Ai-Enabled Radiology Triage Systems Market Research Insights
Market dynamics are shaped by the push for operational efficiency and improved clinical outcomes through AI-powered diagnostic tools. AI-based care coordination platforms are central to this shift, leveraging real-time triage notification and automated summaries generation to streamline communication between departments.
For example, an AI for stroke detection module flags a large vessel occlusion and automatically notifies the on-call neurovascular team, bypassing previous manual communication steps. This workflow optimization is increasingly crucial as healthcare providers navigate value-based care models.
However, deployment requires strict adherence to regulations like HIPAA, ensuring robust patient data privacy is maintained as AI in emergency radiology becomes standard practice. The ability to provide this level of acute pathology detection and diagnostic imaging AI support is a key differentiator for vendors.
We can help! Our analysts can customize this ai-enabled radiology triage systems market research report to meet your requirements.
 RIA -
RIA - 
