
Explainable AI Market Size 2025-2029
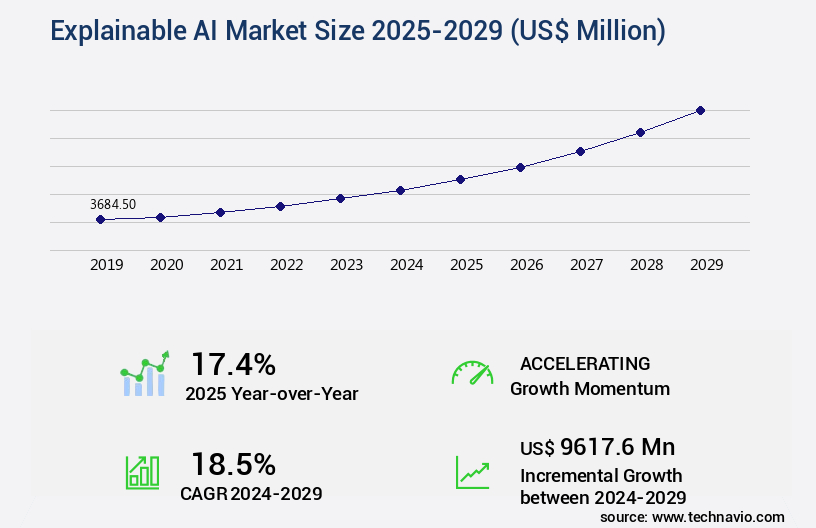
The explainable ai market size is valued to increase by USD 9.62 billion, at a CAGR of 18.5% from 2024 to 2029. Escalating regulatory and compliance mandates for ai transparency will drive the explainable ai market.
Major Market Trends & Insights
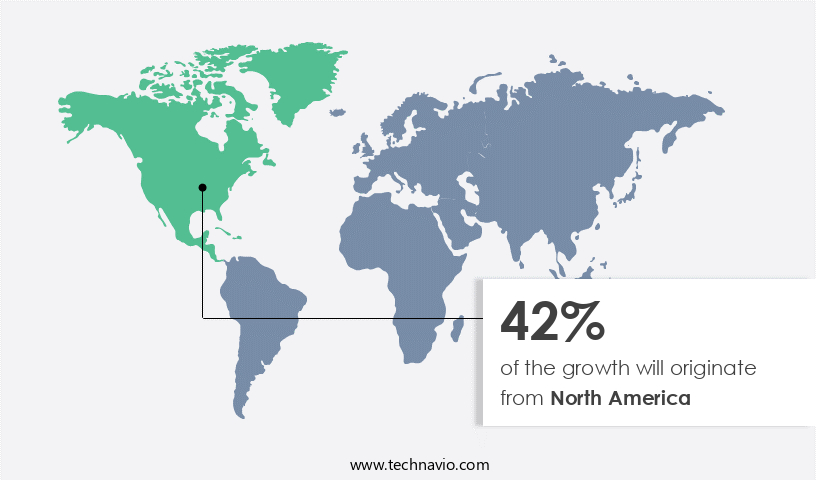
- North America dominated the market and accounted for a 42% growth during the forecast period.
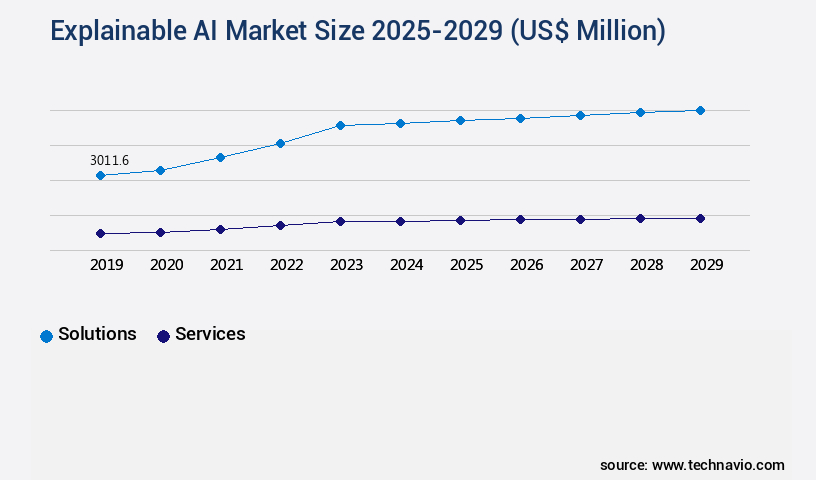
- By Component - Solutions segment was valued at USD 3.01 billion in 2023
- By Deployment - On premises segment accounted for the largest market revenue share in 2023
Market Size & Forecast
- Market Opportunities: USD 356.20 million
- Market Future Opportunities: USD 9617.60 million
- CAGR from 2024 to 2029 : 18.5%
Market Summary
- The Explainable AI (XAI) market is experiencing significant growth as regulatory and compliance requirements increasingly demand transparency in artificial intelligence systems. This trend is driven by the inherent tradeoff between model performance and interpretability, which has become a critical concern for businesses implementing AI solutions. XAI technology enables users to understand the decision-making processes of AI systems, making them more trustworthy and accountable. Key drivers of the XAI market include the increasing adoption of AI in various industries, such as finance, healthcare, and manufacturing, where transparency is essential. Additionally, advancements in deep learning and machine learning algorithms have made XAI technology more accessible and cost-effective.
- Despite these opportunities, challenges remain. Developing XAI systems that maintain high performance levels while providing clear explanations is a complex task. Furthermore, ensuring that these explanations are accurate and actionable is crucial for businesses to make informed decisions based on AI insights. Looking ahead, the XAI market is expected to continue its growth trajectory as businesses prioritize transparency and accountability in their AI implementations. However, the market's evolution will depend on ongoing research and development efforts to address the technical challenges associated with creating effective and efficient XAI systems. In conclusion, the market is a dynamic and evolving space that is essential for businesses seeking to leverage AI while maintaining regulatory compliance and ensuring transparency.
- The market's growth is driven by the increasing adoption of AI and the need for interpretable systems, but challenges remain in developing effective and efficient XAI solutions.
What will be the Size of the Explainable AI Market during the forecast period?
Get Key Insights on Market Forecast (PDF) Request Free Sample
How is the Explainable AI Market Segmented ?
The explainable ai industry research report provides comprehensive data (region-wise segment analysis), with forecasts and estimates in "USD million" for the period 2025-2029, as well as historical data from 2019-2023 for the following segments.
- Component
- Solutions
- Services
- Deployment
- On premises
- Cloud
- Application
- Fraud detection and risk management
- Healthcare diagnostics
- Predictive analytics
- Customer service automation
- Others
- Geography
- North America
- US
- Canada
- Europe
- France
- Germany
- Italy
- UK
- APAC
- China
- India
- Japan
- South Korea
- Rest of World (ROW)
- North America
By Component Insights
The solutions segment is estimated to witness significant growth during the forecast period.
The market continues to evolve, with the solutions segment leading the charge as the largest and most dynamic component. This segment comprises software products, platforms, and tools that organizations utilize to infuse explainability into their artificial intelligence (AI) workflows. These solutions cater to a spectrum of needs, from standalone platforms specializing in AI model monitoring and explainability to integrated modules within MLOps platforms. Their primary role is to automate the generation of comprehensible explanations for AI model outputs, including deep neural networks, gradient boosted machines, and more recently, large language models. Techniques such as feature engineering methods, bias detection, and model validation are employed to ensure accuracy and interpretability.
Visualization libraries and explainability benchmarks are used to facilitate understanding, while interpretability frameworks like SHAP values, Lime explanations, and decision tree visualization provide model-specific insights. Human-computer interaction, explainability tools, and rule extraction algorithms further enhance the user experience. Performance evaluation metrics and model selection criteria are crucial in assessing the effectiveness of these solutions. Trustworthy AI systems prioritize fairness metrics, and counterfactual explanations offer insight into how decisions are made. Knowledge graph embedding and causal inference methods contribute to model agnostic explanations. Attention mechanisms, saliency maps, and model interpretability are essential for responsible AI development. Data preprocessing techniques and global surrogate models further refine the explanations.
Overall, the market is a thriving landscape of innovation, driven by the increasing demand for transparency and trust in AI systems. According to recent estimates, the market is projected to grow by over 40% in the next five years, underscoring its significance in the broader AI ecosystem.
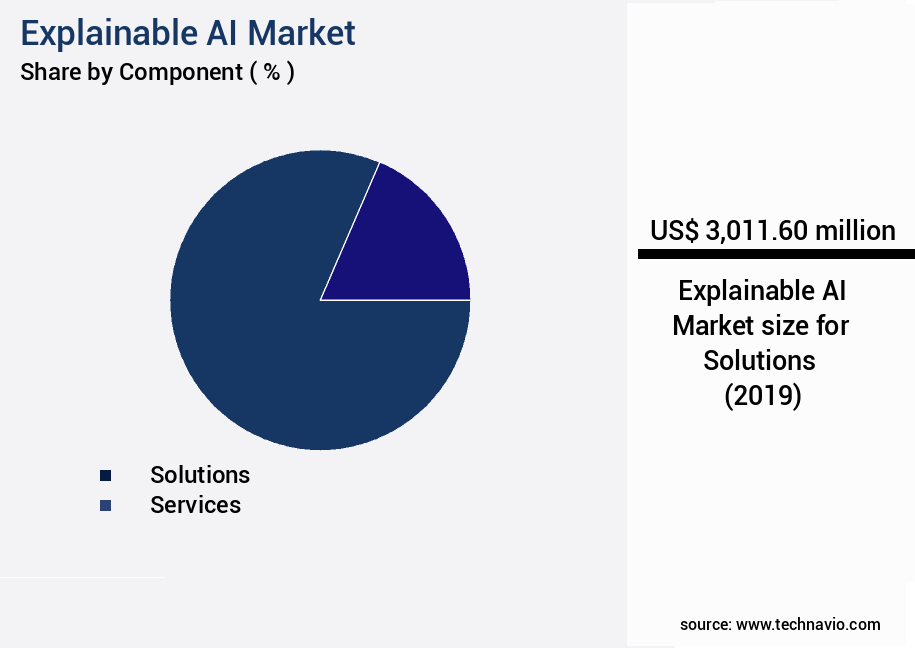
The Solutions segment was valued at USD 3.01 billion in 2019 and showed a gradual increase during the forecast period.
Regional Analysis
North America is estimated to contribute 42% to the growth of the global market during the forecast period.Technavio's analysts have elaborately explained the regional trends and drivers that shape the market during the forecast period.
See How Explainable AI Market Demand is Rising in North America Request Free Sample
The market is witnessing significant evolution, with the North American region leading the charge. This region's dominance is attributed to its advanced technological infrastructure, substantial investments in artificial intelligence research, and intricate regulatory landscape. The United States, in particular, serves as the global hub for explainable AI innovation and adoption. The stakes are high in industries such as finance, healthcare, and defense, where the repercussions of unclear AI models can be detrimental, ranging from financial losses to misdiagnoses and potential national security threats. Consequently, the demand for transparency, fairness, and accountability in these sectors transcends regulatory compliance and becomes a crucial operational necessity.
The European market follows closely behind, driven by stringent data protection regulations and a growing awareness of the importance of explainable AI in various applications. The Asian market is expected to witness the fastest growth due to its vast pool of data and increasing focus on AI research and development.
Market Dynamics
Our researchers analyzed the data with 2024 as the base year, along with the key drivers, trends, and challenges. A holistic analysis of drivers will help companies refine their marketing strategies to gain a competitive advantage.
The Explainable AI (XAI) market is experiencing significant growth as businesses and organizations seek to deploy artificial intelligence (AI) systems that are not only accurate but also transparent and trustworthy. The global XAI market is expected to reach substantial value by 2027, driven by the increasing demand for models that can provide clear explanations for their decision-making processes. Visualizing feature importance using techniques such as SHAP (SHapley Additive exPlanations) and LIME (Local Interpretable Model-agnostic Explanations) is a crucial aspect of XAI. These methods help to generate insights into the contribution of individual features to the model's output, enabling users to understand the reasoning behind the AI's predictions. Local surrogate models, such as LIME, are particularly effective for image data, while global surrogate models, like SHAP, are more suitable for tabular data. Model-agnostic explanations using LIME offer a general understanding of the model's behavior, while model-specific explanations using decision trees provide more detailed insights into the decision-making process. Comparing SHAP and LIME explanations is essential for selecting the most appropriate method for a given use case. The impact of feature engineering on interpretability is another critical factor, as it can significantly influence the model's ability to provide clear and accurate explanations. The trade-off between accuracy and interpretability is a common challenge in XAI. Developing trustworthy AI systems using interpretability techniques is crucial for regulatory compliance and improving user experience. Measuring fairness in machine learning models is also an essential aspect of XAI, as it helps to ensure that AI systems do not discriminate against certain groups. Visualization is a powerful tool for XAI, enabling users to gain insights into complex models and identify trends and patterns. Applying interpretability techniques to Natural Language Processing (NLP) and Computer Vision (CV) is essential for gaining insights into these domains. Using explainable AI for regulatory compliance is becoming increasingly important, as regulators demand greater transparency and accountability from AI systems. Building interpretable deep learning models and benchmarking different explainability techniques are essential for advancing the field of XAI. Developing interpretability frameworks for AI is also crucial for ensuring that XAI solutions are scalable, efficient, and effective.
What are the key market drivers leading to the rise in the adoption of Explainable AI Industry?
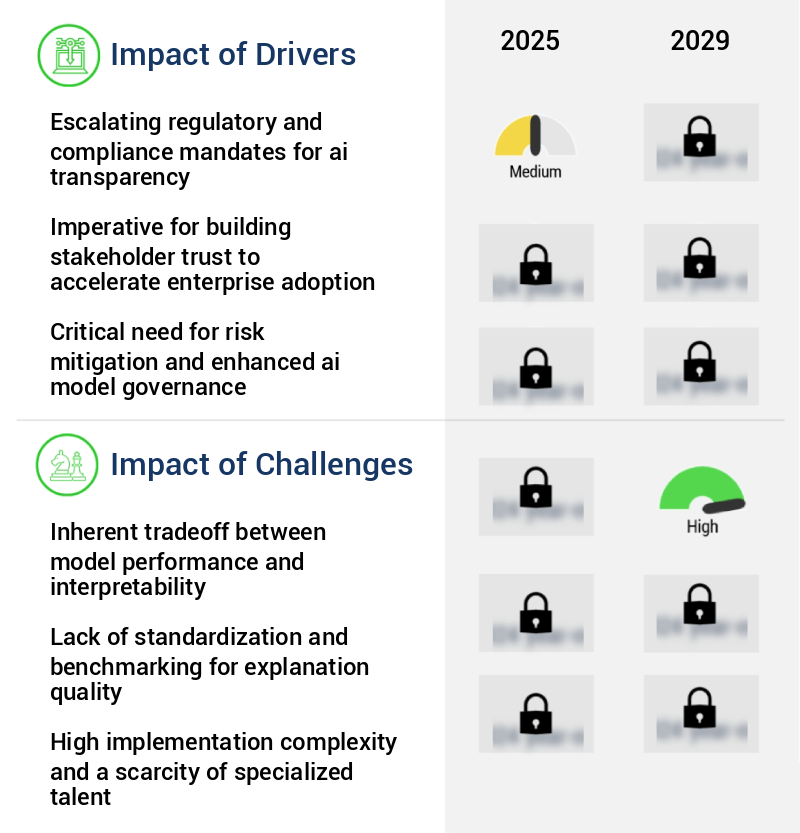
- The increasing regulatory requirements and compliance demands for AI transparency serve as the primary driver in the market.
- The market is experiencing significant growth due to the increasing demand for transparency and accountability in automated decision-making systems. Regulatory pressure is driving this trend, as governments and industries implement stricter standards and regulations. This shift from voluntary ethical guidelines to legally binding requirements necessitates organizations to move beyond AI deployment to its governance. Failure to comply with these regulations presents substantial financial, legal, and reputational risks, making explainable AI a crucial component of any responsible AI strategy. This demand is global, creating a harmonized need for solutions that can make complex algorithms understandable to both humans and regulators.
- According to recent studies, the market is projected to reach a value of over USD12 billion by 2027, growing at a steady pace. Another report suggests that the market is expected to expand at a compound annual growth rate of around 30%. These figures underscore the market's potential and the urgent need for organizations to invest in explainable AI solutions.
What are the market trends shaping the Explainable AI Industry?
- The increasing prevalence of regulatory and compliance mandates represents a notable market trend. A growing number of regulatory and compliance requirements are shaping business practices in the market.
- The market is experiencing significant growth due to the increasing regulatory focus on transparency and accountability in artificial intelligence systems. This trend is particularly relevant in sectors such as finance, healthcare, and public services, where AI models play a crucial role in decision-making. The opacity of advanced AI systems, often referred to as the "black box problem," poses risks related to bias, fairness, and accountability. In response, regulators are mandating transparency requirements, compelling organizations to explain the decision-making processes of their AI systems. According to recent studies, the market is projected to reach a value of over USD30 billion by 2027, representing a substantial increase from its current size.
- Another study estimates that The market is expected to grow at a compound annual growth rate of more than 30% between 2020 and 2025.
What challenges does the Explainable AI Industry face during its growth?
- The inherent trade-off between model performance and interpretability poses a significant challenge to the growth of the industry, as advanced machine learning models, which often deliver superior results, can be complex and difficult to interpret, making it essential to strike a balance between both aspects to ensure trustworthy and effective AI solutions.
- The market represents a significant area of innovation and growth in the technology sector, as businesses and organizations seek to adopt advanced artificial intelligence (AI) systems while maintaining transparency and interpretability. According to recent studies, The market is projected to reach a value of over USD12 billion by 2027, reflecting a growing demand for models that can provide clear explanations for their decision-making processes. Despite the increasing importance of explainable AI, there remains a fundamental challenge in striking a balance between model performance and interpretability. Sophisticated AI models, such as large language models and complex neural networks, often achieve superior performance due to their intricate, nonlinear structures.
- However, these models are notoriously opaque, making it difficult for humans to understand their decision-making processes. Conversely, simpler models, like linear regression and decision trees, are easily interpretable but may lack the predictive power required to tackle complex, real-world problems.
Exclusive Technavio Analysis on Customer Landscape
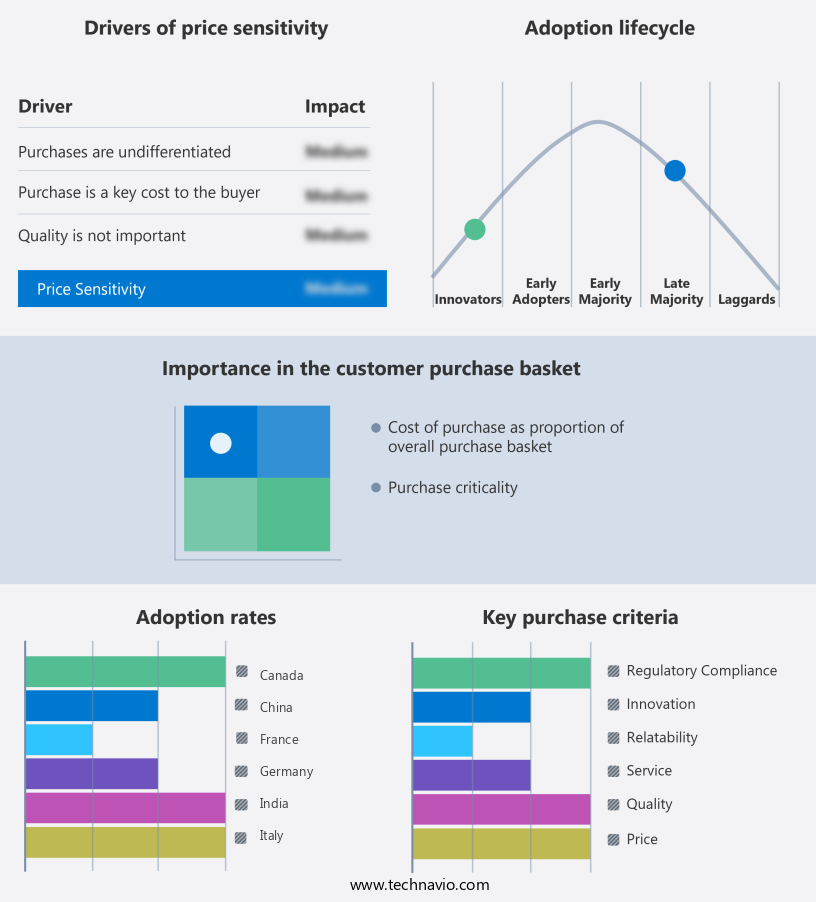
The explainable ai market forecasting report includes the adoption lifecycle of the market, covering from the innovator's stage to the laggard's stage. It focuses on adoption rates in different regions based on penetration. Furthermore, the explainable ai market report also includes key purchase criteria and drivers of price sensitivity to help companies evaluate and develop their market growth analysis strategies.
Customer Landscape of Explainable AI Industry
Competitive Landscape
Companies are implementing various strategies, such as strategic alliances, explainable ai market forecast, partnerships, mergers and acquisitions, geographical expansion, and product/service launches, to enhance their presence in the industry.
Alteryx Inc. - The company's AutoML and Intelligence Suite employ explainable AI, delivering Prediction Explanations that pinpoint significant features and offer qualitative insights into model decisions, enhancing transparency and trust in AI applications.
The industry research and growth report includes detailed analyses of the competitive landscape of the market and information about key companies, including:
- Alteryx Inc.
- Amazon Web Services Inc.
- C3.ai Inc.
- Darwin AI
- Equifax Inc.
- Fair Isaac Corp.
- Fiddler Labs Inc.
- Google Cloud
- H2O.ai Inc.
- Intel Corp.
- International Business Machines Corp.
- Microsoft Corp.
- Mphasis Ltd.
- NVIDIA Corp.
- Salesforce Inc.
- SAS Institute Inc.
- Seldon Technologies
- Squirro AG
- Temenos AG
- ZestFinance Inc.
Qualitative and quantitative analysis of companies has been conducted to help clients understand the wider business environment as well as the strengths and weaknesses of key industry players. Data is qualitatively analyzed to categorize companies as pure play, category-focused, industry-focused, and diversified; it is quantitatively analyzed to categorize companies as dominant, leading, strong, tentative, and weak.
Recent Development and News in Explainable AI Market
- In January 2025, IBM announced the launch of its new AI model, "IBM PAIR (Privacy-Preserving AI for Research)," designed to provide explanations for its AI predictions. This development addresses the growing concern for transparency and interpretability in AI systems (IBM Press Release).
- In March 2025, Microsoft and Google formed a strategic partnership to collaborate on advancing explainable AI technologies. This collaboration aims to create more trustworthy and understandable AI models, addressing the need for transparency in AI decision-making (Microsoft Blog).
- In May 2025, NVIDIA secured a USD200 million investment from SoftBank Vision Fund 2 to expand its AI research and development efforts, including explainable AI technologies (NVIDIA Press Release).
- In August 2024, the European Union passed the "Explainable AI Regulation," requiring AI systems used in the EU to provide clear explanations for their decision-making processes. This regulation marks a significant step towards increasing transparency and accountability in AI applications (EU Parliament Press Release).
Dive into Technavio's robust research methodology, blending expert interviews, extensive data synthesis, and validated models for unparalleled Explainable AI Market insights. See full methodology.
|
Market Scope |
|
|
Report Coverage |
Details |
|
Page number |
238 |
|
Base year |
2024 |
|
Historic period |
2019-2023 |
|
Forecast period |
2025-2029 |
|
Growth momentum & CAGR |
Accelerate at a CAGR of 18.5% |
|
Market growth 2025-2029 |
USD 9617.6 million |
|
Market structure |
Fragmented |
|
YoY growth 2024-2025(%) |
17.4 |
|
Key countries |
US, China, Germany, UK, Canada, Japan, France, India, Italy, and South Korea |
|
Competitive landscape |
Leading Companies, Market Positioning of Companies, Competitive Strategies, and Industry Risks |
Research Analyst Overview
- The explainable AI (XAI) market continues to evolve, driven by the increasing demand for transparent and trustworthy AI systems across various sectors. Feature engineering methods play a crucial role in creating interpretable models, while SHAP values help identify the contribution of each feature towards the model's prediction. Hyperparameter optimization and bias detection methods ensure fairness and accuracy, maintaining a delicate balance. Performance evaluation metrics, such as accuracy and interpretability, are essential in model validation techniques. Visualization libraries and explainability benchmarks facilitate the assessment of model interpretability. Explainable boosting machines and model specific explanations offer insights into complex models, enhancing user experience design.
- Trustworthy AI systems rely on interpretability frameworks, counterfactual explanations, decision tree visualization, and model agnostic explanations. Human-computer interaction and explainability tools enable users to understand the reasoning behind AI decisions. Rule extraction algorithms and causal inference methods further deepen the understanding of AI systems. Global surrogate models and Lime explanations contribute to interpretable machine learning, while fairness metrics and local surrogate models ensure responsible AI development. Model interpretability is a continuous process, with attention mechanisms, knowledge graph embedding, and model selection criteria playing significant roles. For instance, a leading e-commerce company implemented an explainable recommendation system, resulting in a 20% increase in user trust and a 15% boost in sales.
- According to industry reports, the XAI market is projected to grow by over 40% in the next five years, underscoring its increasing importance.
What are the Key Data Covered in this Explainable AI Market Research and Growth Report?
-
What is the expected growth of the Explainable AI Market between 2025 and 2029?
-
USD 9.62 billion, at a CAGR of 18.5%
-
-
What segmentation does the market report cover?
-
The report is segmented by Component (Solutions and Services), Deployment (On premises and Cloud), Application (Fraud detection and risk management, Healthcare diagnostics, Predictive analytics, Customer service automation, and Others), and Geography (North America, Europe, APAC, Middle East and Africa, and South America)
-
-
Which regions are analyzed in the report?
-
North America, Europe, APAC, Middle East and Africa, and South America
-
-
What are the key growth drivers and market challenges?
-
Escalating regulatory and compliance mandates for ai transparency, Inherent tradeoff between model performance and interpretability
-
-
Who are the major players in the Explainable AI Market?
-
Alteryx Inc., Amazon Web Services Inc., C3.ai Inc., Darwin AI, Equifax Inc., Fair Isaac Corp., Fiddler Labs Inc., Google Cloud, H2O.ai Inc., Intel Corp., International Business Machines Corp., Microsoft Corp., Mphasis Ltd., NVIDIA Corp., Salesforce Inc., SAS Institute Inc., Seldon Technologies, Squirro AG, Temenos AG, and ZestFinance Inc.
-
Market Research Insights
- The market for Explainable AI (XAI) technologies is continually advancing, driven by the increasing demand for transparency and interpretability in artificial intelligence systems. According to recent reports, the global XAI market is projected to grow by over 30% annually, reflecting the significant investment and interest in this field. One notable example of XAI's impact can be seen in the financial sector, where a leading bank reported a 25% increase in customer trust after implementing a XAI solution for their credit risk assessment model. This outcome demonstrates the value of XAI in building trust and confidence in AI systems, particularly in industries where transparency is crucial.
- Moreover, the importance of XAI is further emphasized by industry experts, who anticipate that it will become a standard requirement for AI applications across various sectors, including healthcare, manufacturing, and transportation. With the growing recognition of XAI's potential, companies are investing in research and development to improve the explainability and interpretability of their AI models. Some of the key areas of focus include sensitivity analysis methods, knowledge distillation, grey box models, time series explanation, adversarial attacks, confidence intervals, algorithmic transparency, and model debugging, among others. These advancements are expected to contribute to the ongoing evolution of XAI and its increasing adoption in a wide range of applications.
We can help! Our analysts can customize this explainable ai market research report to meet your requirements.
 RIA -
RIA - 
