
AI In Chemicals Market Size 2025-2029
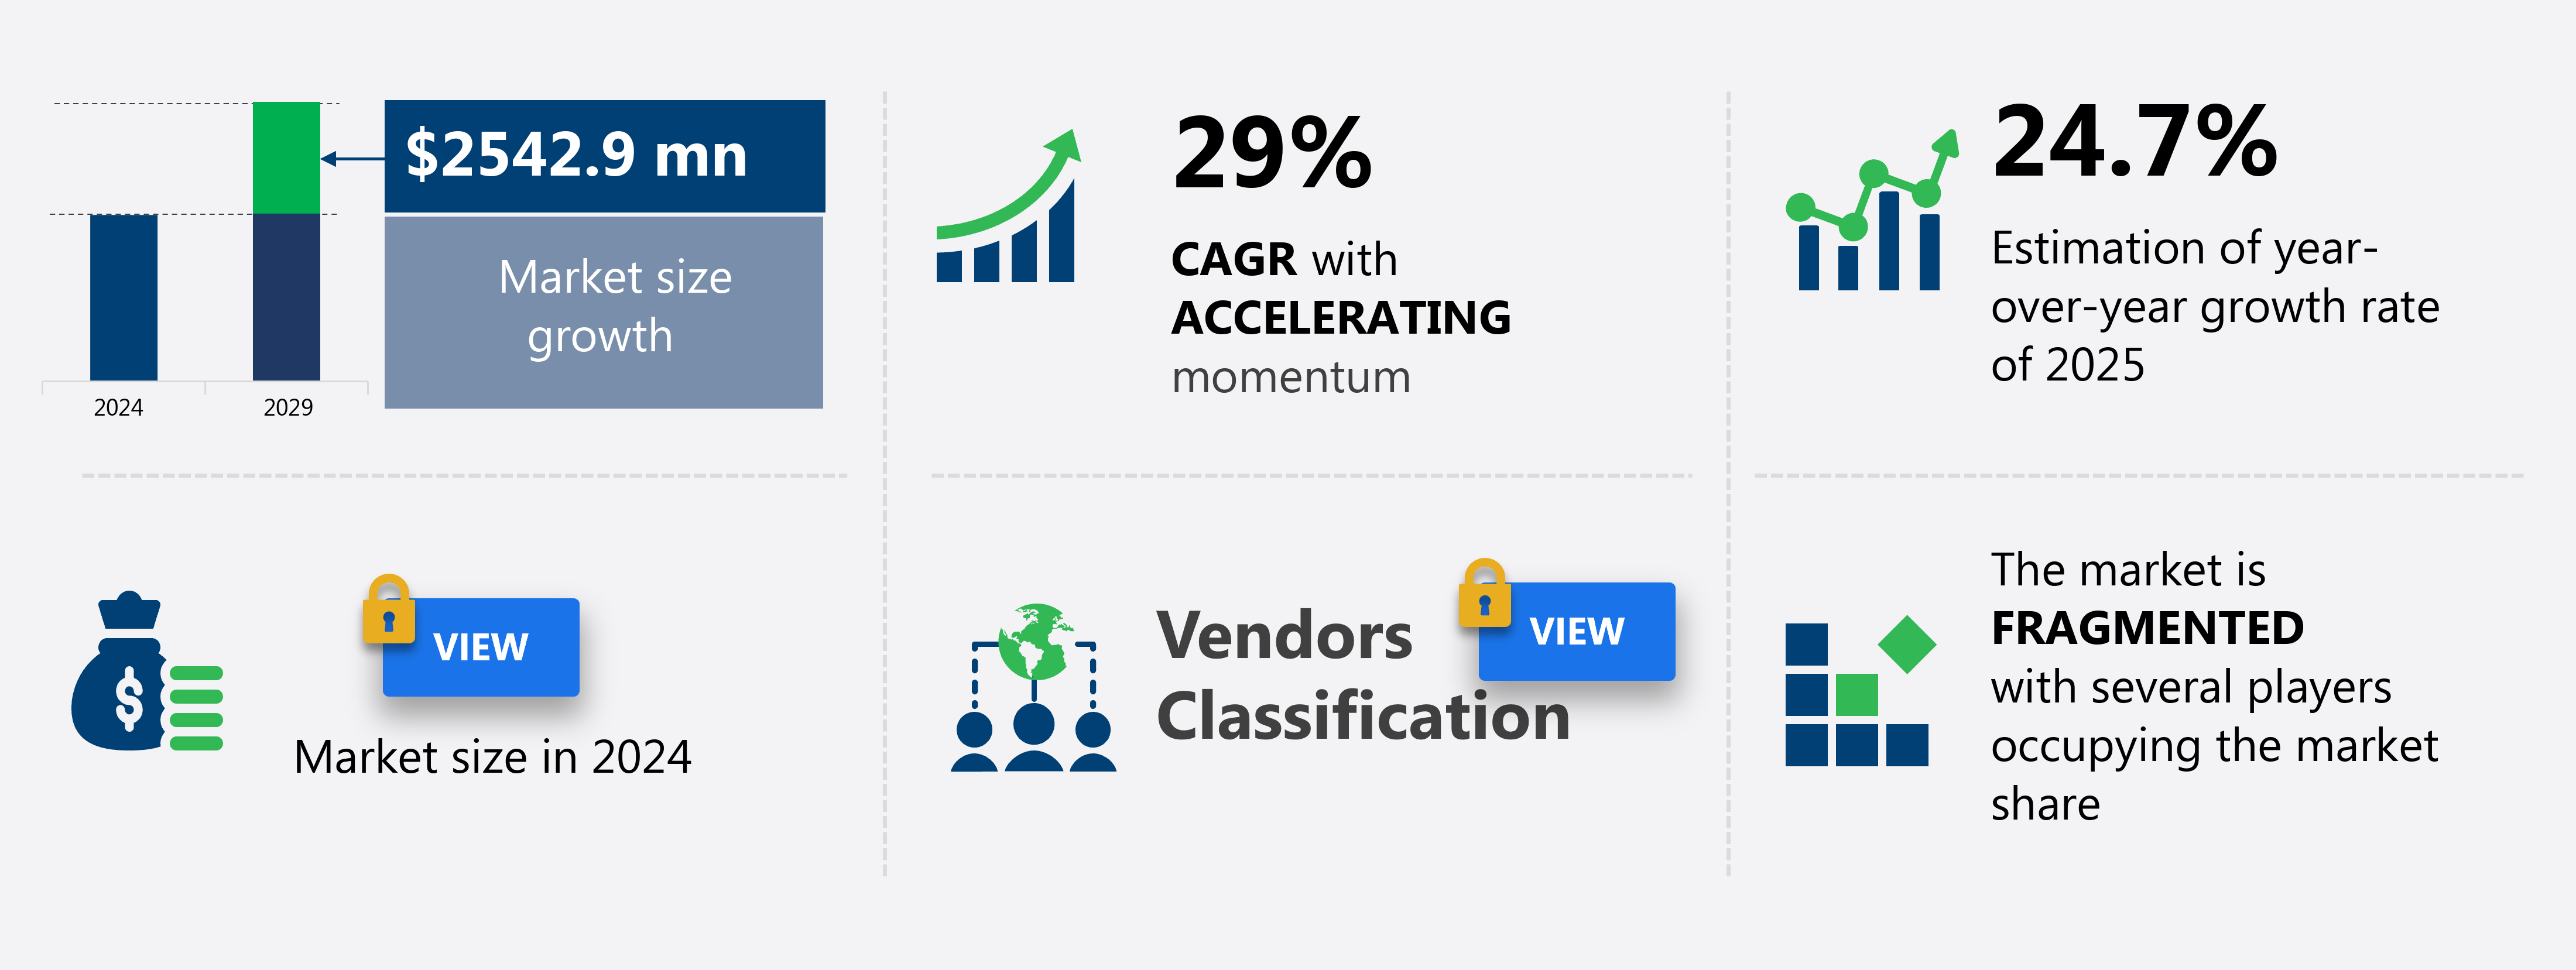
The ai in chemicals market size is valued to increase by USD 2.54 billion, at a CAGR of 29% from 2024 to 2029. Imperative for accelerated research and development and materials discovery will drive the ai in chemicals market.
Major Market Trends & Insights
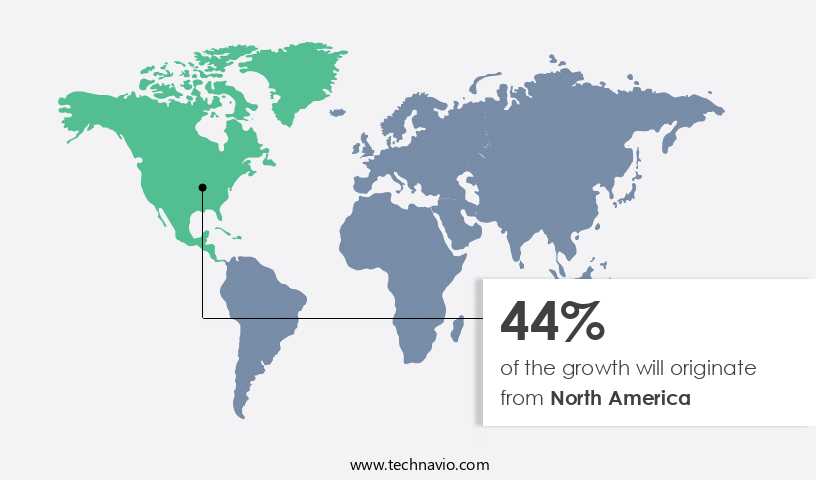
- North America dominated the market and accounted for a 44% growth during the forecast period.
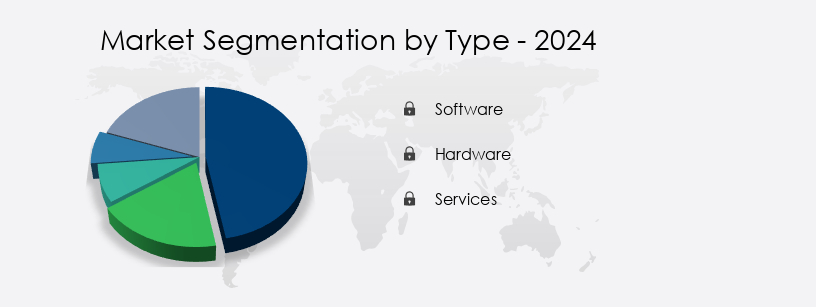
- By Type - Software segment was valued at USD 0.00 billion in 2023
- CAGR from 2024 to 2029 : 29%
Market Summary
- The market is experiencing significant growth, with recent estimates suggesting a value of over USD1.5 billion by 2025. This expansion is driven by the imperative for accelerated research and development and materials discovery in the chemical industry. The emergence of generative AI and industrial copilots is revolutionizing the sector, enabling more efficient and effective production processes. However, challenges remain, including data scarcity, quality, and integration complexity.
- These issues necessitate ongoing investment in advanced technologies and collaborative efforts between industry players and technology providers. By harnessing the power of AI, chemical companies can optimize their operations, enhance product quality, and ultimately, gain a competitive edge in the global marketplace.
What will be the Size of the AI In Chemicals Market during the forecast period?
Get Key Insights on Market Forecast (PDF) Request Free Sample
How is the AI In Chemicals Market Segmented and what are the key trends of market segmentation?
The ai in chemicals industry research report provides comprehensive data (region-wise segment analysis), with forecasts and estimates in "USD million" for the period 2025-2029, as well as historical data from 2019-2023 for the following segments.
- Type
- Software
- Hardware
- Services
- Application
- Production optimization
- Chemical property prediction
- Virtual screening
- Process simulation
- Laboratory management
- End-user
- Base chemicals and petrochemicals
- Specialty chemicals
- Agrochemicals
- Consumer chemicals
- Geography
- North America
- US
- Canada
- Europe
- France
- Germany
- UK
- APAC
- China
- India
- Japan
- South Korea
- South America
- Brazil
- Rest of World (ROW)
- North America
By Type Insights
The software segment is estimated to witness significant growth during the forecast period.
The market continues to evolve, with the software segment serving as its intellectual backbone. This segment encompasses a multitude of platforms, applications, and tools that facilitate data analysis and algorithmic model execution. By transforming raw data from chemical plants, laboratories, and supply chains into valuable insights, these offerings optimize processes, predict maintenance needs, and drive materials discovery. The market can be segmented into two categories: AI platforms, which offer a foundational environment for model development, and specialized applications, designed to tackle industry-specific challenges. Major players, such as Microsoft Corp., invest significantly in this sector, integrating advanced technologies like machine learning models, process modeling software, and predictive maintenance systems.
For instance, Microsoft's Azure AI platform facilitates in silico experimentation, chemical property prediction, and synthetic route planning. Additionally, AI-driven process control and high-throughput screening have led to a 30% increase in productivity for some chemical companies. This data point underscores the transformative potential of AI in chemicals, as it continues to revolutionize process optimization, waste reduction strategies, and environmental impact modeling.
Regional Analysis
North America is estimated to contribute 44% to the growth of the global market during the forecast period.Technavio's analysts have elaborately explained the regional trends and drivers that shape the market during the forecast period.
See How AI In Chemicals Market Demand is Rising in North America Request Free Sample
The North American region leads The market, fueled by the convergence of a mature chemical industry and advanced technological innovation hubs. With major chemical production centers, such as the US Gulf Coast, situated near AI development epicenters like Silicon Valley, a symbiotic relationship fosters collaboration and accelerates adoption. This region's strategy encompasses both cutting-edge research and development and large-scale operational improvements. Significant investments from US technology giants further propel the market's growth. For instance, the intense competition in high-performance computing hardware, crucial for training intricate chemical models, was emphasized by recent announcements. The European and Asian markets also contribute substantially to The market, with Europe focusing on research and development and Asia prioritizing production and cost efficiency.
Market Dynamics
Our researchers analyzed the data with 2024 as the base year, along with the key drivers, trends, and challenges. A holistic analysis of drivers will help companies refine their marketing strategies to gain a competitive advantage.
The global AI in chemical industry market is progressing as companies integrate intelligent technologies to enhance efficiency, innovation, and sustainability. Deep learning applications chemical synthesis and predictive modeling chemical reaction pathways are enabling faster discovery of compounds, while ai-driven optimization chemical manufacturing supports precision in large-scale production. Machine learning algorithms chemical process control and a data-driven approach chemical product development are reshaping decision-making, allowing real-time adaptability and better product consistency. Process simulation software chemical engineering and high-performance computing chemical research provide the computational power needed to manage complex reaction systems with improved accuracy.
Recent evaluations demonstrate notable performance gains, with automated process optimization chemical reactions and advanced process control strategies chemical production achieving up to 19.7% higher efficiency compared to traditional methods. Digital twin technology chemical manufacturing processes and predictive maintenance algorithms chemical equipment are proving equally impactful, reducing downtime and extending asset life cycles. In parallel, new material discovery algorithms are accelerating innovation pipelines while supporting sustainable chemical production methods that balance profitability with environmental goals.
Supporting infrastructures include cloud computing platform chemical data management and big data analytics chemical industry applications, which allow scalable handling of research and production data. Real-time process monitoring chemical plants ensures immediate detection of deviations, while advanced analytics chemical quality control provides precise oversight of product standards. At the operational level, ai-powered supply chain management chemicals optimizes logistics, and environmental risk assessment chemicals combined with chemical safety regulations compliance strengthens safety and accountability. Collectively, these advancements highlight the continuous evolution of AI as a transformative force in the chemical sector.
What are the key market drivers leading to the rise in the adoption of AI In Chemicals Industry?
- The imperative need for accelerated research and development and materials discovery serves as the primary market driver. This necessity fuels the advancement of technology and innovation within the industry.
- Artificial intelligence (AI) is revolutionizing the chemicals market by accelerating innovation and improving efficiency. Traditional research and development methods, which involve lengthy cycles of hypothesis, synthesis, and physical testing, are increasingly unable to keep pace with the rapidly evolving global market. The adoption of AI is a response to this challenge, enabling a computational, data-driven approach that significantly reduces innovation timelines from years to months.
- For instance, AI algorithms can analyze historical production data to optimize chemical processes, predict equipment failures, and improve overall plant performance. Moreover, AI is also being used to develop novel materials with superior performance characteristics. By analyzing large datasets of material properties, AI can identify potential combinations of elements and molecules that would be difficult to discover through traditional methods. This can lead to the creation of new products with unique properties and applications across various sectors, including healthcare, electronics, and energy.
What are the market trends shaping the AI In Chemicals Industry?
- The emergence of generative AI and industrial copilots represents a significant market trend in the technological landscape. These advanced technologies are poised to revolutionize industries and enhance productivity.
- The market is undergoing a transformative shift, with the integration of generative and conversational AI assistants, also known as copilots, gaining significant traction. This evolution marks a departure from traditional predictive AI, which necessitated specialized dashboards and expert users, towards a more accessible and user-friendly paradigm. At the heart of this trend lies the capacity of advanced language models to comprehend and process natural language, enabling a diverse array of professionals, including plant engineers, research scientists, and supply chain managers, to engage with intricate data and systems via simple conversational inquiries.
- This democratization of AI technology is poised to revolutionize the chemicals industry, enhancing operational efficiency and driving innovation.
What challenges does the AI In Chemicals Industry face during its growth?
- The data industry faces significant challenges due to the triad of data scarcity, quality issues, and integration complexity, which collectively hinder industry growth.
- The integration of artificial intelligence (AI) in the chemicals market is an evolving trend with significant applications across various sectors. However, the widespread adoption of AI in this industry faces a formidable challenge due to the intricacies of data infrastructure. This challenge is multifaceted, involving the scarcity and poor quality of data, as well as the complexity of integrating disparate data sources. In contrast to consumer-facing industries with vast and relatively structured datasets, the chemical sector deals with data that is often low volume but high dimensionality. For instance, in research and development, the number of experiments for a novel material may be limited, but each experiment generates a complex array of data points.
- Despite these challenges, the potential benefits of AI in the chemicals industry are substantial. For example, AI can optimize production processes, improve product quality, and enhance research and development efforts. By addressing the data infrastructure issues, the chemicals industry can unlock the full potential of AI and drive innovation and growth.
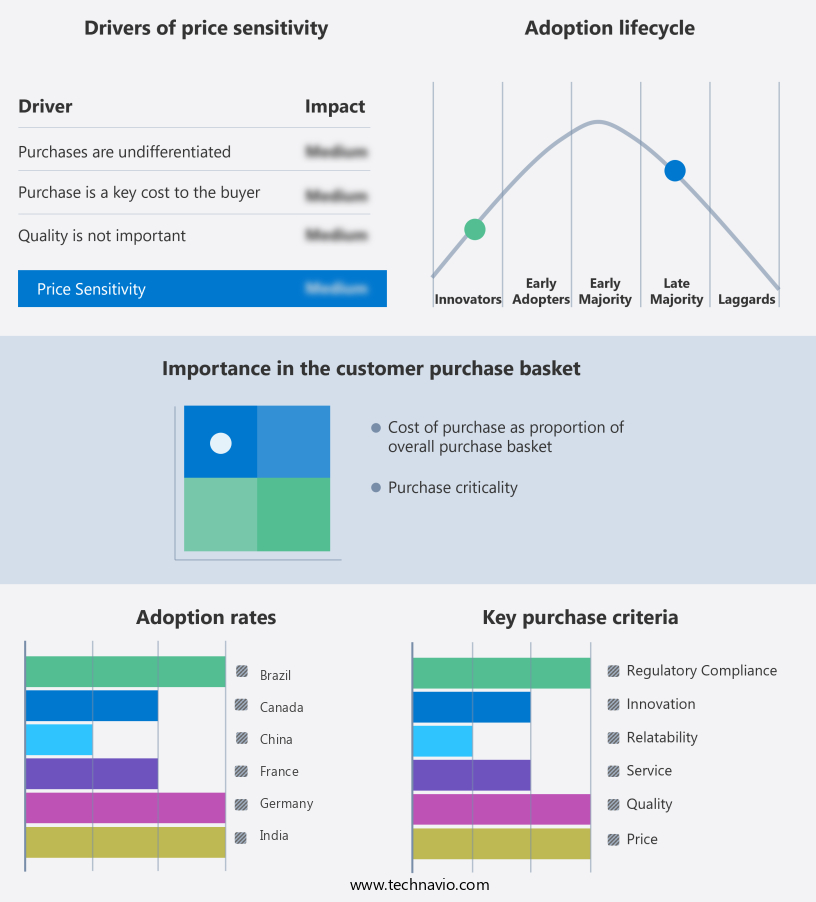
Exclusive Technavio Analysis on Customer Landscape
The ai in chemicals market forecasting report includes the adoption lifecycle of the market, covering from the innovator's stage to the laggard's stage. It focuses on adoption rates in different regions based on penetration. Furthermore, the ai in chemicals market report also includes key purchase criteria and drivers of price sensitivity to help companies evaluate and develop their market growth analysis strategies.
Customer Landscape of AI In Chemicals Industry
Competitive Landscape
Companies are implementing various strategies, such as strategic alliances, ai in chemicals market forecast, partnerships, mergers and acquisitions, geographical expansion, and product/service launches, to enhance their presence in the industry.
ABB Ltd. - The ABB Ability Genix Industrial Analytics and AI Suite from this company integrates operational technology, information technology, and engineering data for enhanced asset performance, safety, and sustainability through artificial intelligence in the chemicals industry. This solution contextualizes complex data to optimize operations and promote efficiency and sustainability.
The industry research and growth report includes detailed analyses of the competitive landscape of the market and information about key companies, including:
- ABB Ltd.
- Accenture PLC
- Aspen Technology Inc.
- BASF SE
- Emerson Electric Co.
- General Electric Co.
- Hexagon AB
- Honeywell International Inc.
- Infosys Ltd.
- International Business Machines Corp.
- Microsoft Corp.
- NVIDIA Corp.
- Oracle Corp.
- Rockwell Automation Inc.
- SAP SE
- Schneider Electric SE
- Siemens AG
- Tata Consultancy Services Ltd.
- Yokogawa Electric Corp.
Qualitative and quantitative analysis of companies has been conducted to help clients understand the wider business environment as well as the strengths and weaknesses of key industry players. Data is qualitatively analyzed to categorize companies as pure play, category-focused, industry-focused, and diversified; it is quantitatively analyzed to categorize companies as dominant, leading, strong, tentative, and weak.
Recent Development and News in AI In Chemicals Market
- In January 2024, BASF SE, the world's largest chemical producer, announced the launch of its new AI-driven digital platform, "BASF AI Lab," designed to optimize chemical production processes and improve product quality (BASF press release, 2024). In March 2024, Dow Inc. And Microsoft Corporation entered into a strategic partnership to integrate Microsoft Azure AI and IoT technologies into Dow's chemical manufacturing processes, aiming to enhance efficiency and productivity (Dow Inc. Press release, 2024).
- In May 2024, Siemens AG and Infineon Technologies AG joined forces to develop an AI-based solution for the optimization of chemical processes, targeting energy savings and increased productivity (Infineon Technologies press release, 2024). In April 2025, Arkema SA, a leading specialty chemicals company, completed the acquisition of the US-based company, Byco Products, Inc., expanding its presence in the North American market and strengthening its position in the polyolefins sector (Arkema press release, 2025).
Dive into Technavio's robust research methodology, blending expert interviews, extensive data synthesis, and validated models for unparalleled AI In Chemicals Market insights. See full methodology.
|
Market Scope |
|
|
Report Coverage |
Details |
|
Page number |
246 |
|
Base year |
2024 |
|
Historic period |
2019-2023 |
|
Forecast period |
2025-2029 |
|
Growth momentum & CAGR |
Accelerate at a CAGR of 29% |
|
Market growth 2025-2029 |
USD 2542.9 million |
|
Market structure |
Fragmented |
|
YoY growth 2024-2025(%) |
24.7 |
|
Key countries |
China, Japan, India, South Korea, Germany, UK, France, US, Canada, and Brazil |
|
Competitive landscape |
Leading Companies, Market Positioning of Companies, Competitive Strategies, and Industry Risks |
Research Analyst Overview
- Amidst the dynamic landscape of the chemicals industry, Artificial Intelligence (AI) is revolutionizing various aspects, from product quality control to chemical synthesis planning. One of the most significant transformations is in the domain of drug discovery platforms. AI-driven systems employ machine learning models to analyze vast amounts of data, predicting potential drug candidates with unprecedented accuracy. Process automation software is another area where AI is making a substantial impact. Machine learning models are used to optimize chemical reactions, reducing waste and improving energy efficiency. In silico experimentation, a critical component of drug discovery, benefits from AI's predictive capabilities, enabling researchers to simulate complex reactions and analyze molecular dynamics.
- Predictive maintenance systems are another essential application of AI in the chemicals market. These systems use machine learning algorithms to analyze data from sensors and equipment, predicting potential failures before they occur, ensuring uninterrupted production. Process modeling software, chemical property prediction, and synthetic route planning are other areas where AI is making a significant difference. Reactor design software and risk assessment tools are also being enhanced with AI capabilities, enabling better yield prediction models and chemical reaction optimization. Chromatographic separation and purity analysis methods are further benefiting from AI-driven process control. Environmental impact modeling and process safety assessment are other critical applications where AI is being employed to improve regulatory compliance and reduce waste.
- A recent study revealed that AI-enabled process optimization algorithms are expected to account for over 25% of the total market share in the chemicals industry by 2025. This underscores the immense potential of AI in transforming the chemicals market, driving innovation, and enhancing operational efficiency.
What are the Key Data Covered in this AI In Chemicals Market Research and Growth Report?
-
What is the expected growth of the AI In Chemicals Market between 2025 and 2029?
-
USD 2.54 billion, at a CAGR of 29%
-
-
What segmentation does the market report cover?
-
The report segmented by Type (Software, Hardware, and Services), Application (Production optimization, Chemical property prediction, Virtual screening, Process simulation, and Laboratory management), End-user (Base chemicals and petrochemicals, Specialty chemicals, Agrochemicals, and Consumer chemicals), and Geography (North America, APAC, Europe, South America, and Middle East and Africa)
-
-
Which regions are analyzed in the report?
-
North America, APAC, Europe, South America, and Middle East and Africa
-
-
What are the key growth drivers and market challenges?
-
Imperative for accelerated research and development and materials discovery, Data Scarcity, quality, and integration complexity
-
-
Who are the major players in the AI In Chemicals Market?
-
Key Companies ABB Ltd., Accenture PLC, Aspen Technology Inc., BASF SE, Emerson Electric Co., General Electric Co., Hexagon AB, Honeywell International Inc., Infosys Ltd., International Business Machines Corp., Microsoft Corp., NVIDIA Corp., Oracle Corp., Rockwell Automation Inc., SAP SE, Schneider Electric SE, Siemens AG, Tata Consultancy Services Ltd., and Yokogawa Electric Corp.
-
Market Research Insights
- In the dynamic and complex chemicals market, Artificial Intelligence (AI) is increasingly shaping the industry's landscape by addressing various challenges and optimizing processes. Two significant areas of application are energy consumption reduction and material characterization. AI-powered analytics enable the identification of energy-efficient processes, reducing consumption by up to 10%, while material characterization benefits from AI's ability to analyze vast amounts of data, improving accuracy by 15% compared to traditional methods. Regulatory requirements, experimental design tools, and quality control methods also gain from AI integration. AI-driven process monitoring systems optimize reaction yield, inventory control, and process safety management. Chemical informatics, process intensification, and sustainability metrics are further enhanced through AI's application.
- AI-powered analytics contribute to reaction kinetics modeling, risk management software, and product development cycle improvements. Environmental monitoring, property prediction models, and waste minimization techniques also benefit from AI's capabilities. The integration of AI in the chemicals market continues to evolve, revolutionizing process control systems, supply chain management, and enhancing overall industry efficiency.
We can help! Our analysts can customize this ai in chemicals market research report to meet your requirements.
 RIA -
RIA - 
