AI In Human Resources Market Analysis, Size, and Forecast 2025-2029: North America (US, Canada, and Mexico), Europe (Germany, UK, and France), APAC (China, India, and Japan), South America (Brazil, Argentina, and Colombia), Middle East and Africa (Saudi Arabia, UAE, and South Africa), and Rest of World (ROW)

AI In Human Resources Market Analysis, Size, and Forecast 2025-2029:
North America (US, Canada, and Mexico), Europe (Germany, UK, and France), APAC (China, India, and Japan), South America (Brazil, Argentina, and Colombia), Middle East and Africa (Saudi Arabia, UAE, and South Africa), and Rest of World (ROW)

Published: Dec 2025 291 Pages SKU: IRTNTR81031

Market Overview at a Glance

$16.55 B
Market Opportunity
27.6%
CAGR 2024 - 2029
42.3%
North America Growth
$3.59 B
Solutions segment 2023

AI In Human Resources Market Size 2025-2029

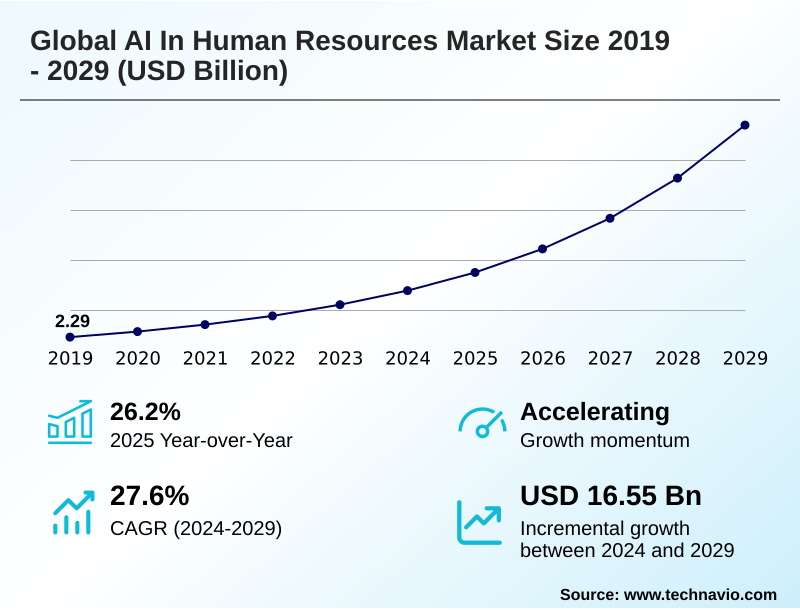
The ai in human resources market size is valued to increase by USD 16.55 billion, at a CAGR of 27.6% from 2024 to 2029. Increasing demand for operational efficiency and process automation will drive the ai in human resources market.

Major Market Trends & Insights

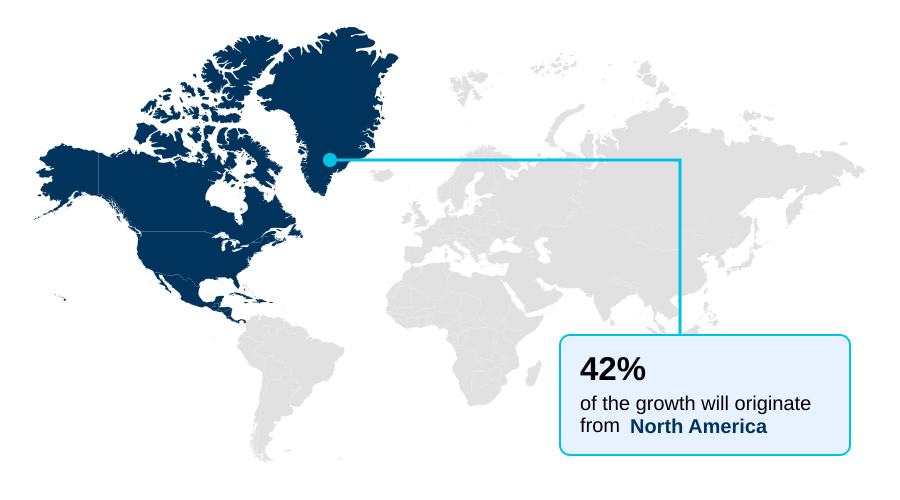
  • North America dominated the market and accounted for a 42.3% growth during the forecast period.
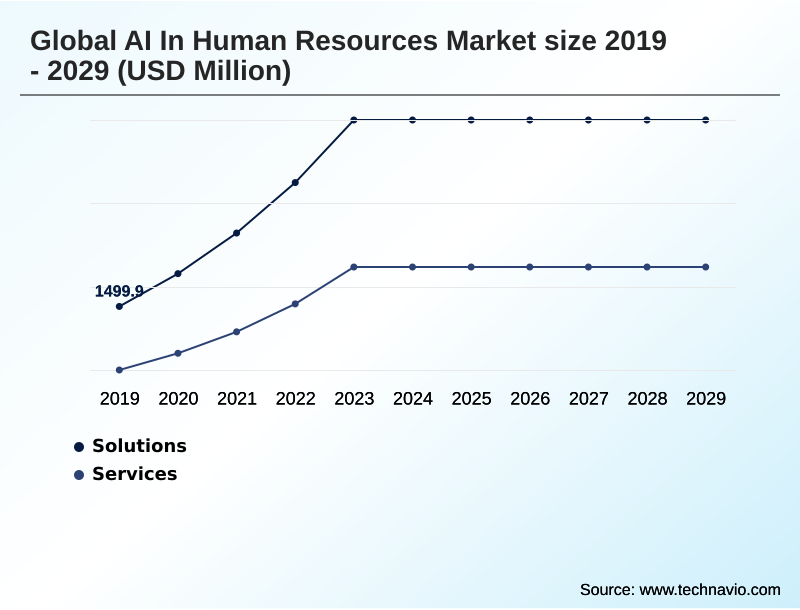
  • By Component - Solutions segment was valued at USD 3.59 billion in 2023
  • By Deployment - Cloud segment accounted for the largest market revenue share in 2023

Market Size & Forecast

  • Market Opportunities: USD 21.20 billion
  • Market Future Opportunities: USD 16.55 billion
  • CAGR from 2024 to 2029 : 27.6%

Market Summary

  • The AI in human resources market is fundamentally reshaping how organizations manage their most critical asset. This transformation is driven by the need for enhanced operational efficiency and a strategic shift toward data-driven talent management. Core technologies like machine learning algorithms and natural language processing (NLP) are embedded into human capital management (hcm) suites to automate high-volume tasks.
  • For instance, an organization can deploy conversational AI chatbots to handle routine employee inquiries, freeing up HR professionals to focus on strategic initiatives like workforce planning analytics and mitigating algorithmic bias. This allows for the creation of sophisticated systems for continuous feedback and employee experience personalization.
  • The integration of AI-powered skills intelligence and predictive analytics for HR not only streamlines recruitment through advanced applicant tracking systems (ATS) but also improves retention by identifying at-risk employees and personalizing development paths, ultimately turning the HR function into a more strategic and predictive business partner.

What will be the Size of the AI In Human Resources Market during the forecast period?

Get Key Insights on Market Forecast (PDF) Request Free Sample

How is the AI In Human Resources Market Segmented?

The ai in human resources industry research report provides comprehensive data (region-wise segment analysis), with forecasts and estimates in "USD million" for the period 2025-2029, as well as historical data from 2019-2023 for the following segments.

  • Component
    • Solutions
    • Services
  • Deployment
    • Cloud
    • On premises
  • Application
    • Recruitment and hiring
    • Employee onboarding and engagement
    • Performance management
    • Payroll processing
    • Learning and development
  • Geography
    • North America
      • US
      • Canada
      • Mexico
    • Europe
      • Germany
      • UK
      • France
    • APAC
      • China
      • India
      • Japan
    • South America
      • Brazil
      • Argentina
      • Colombia
    • Middle East and Africa
      • Saudi Arabia
      • UAE
      • South Africa
    • Rest of World (ROW)

By Component Insights

The solutions segment is estimated to witness significant growth during the forecast period.

The market is segmented between comprehensive solutions and enabling services. The solutions segment, which includes integrated software suites and specialized platforms, is shifting from isolated point tools to unified human capital management (HCM) systems.

This integration creates a cohesive data environment where functions like performance management ai and sentiment analysis tools inform broader strategies.

Utilizing resume parsing technology and skills ontology mapping, these systems support everything from employee attrition modeling to creating internal mobility marketplaces.

Advanced people analytics platforms offer predictive succession planning and AI-assisted performance reviews, while workforce optimization tools build a dynamic skills inventory.

This consolidation improves data integrity for analytics by over 60% compared to disconnected applications, enabling more accurate talent intelligence solutions and supporting AI for diversity and inclusion.

Request Free Sample

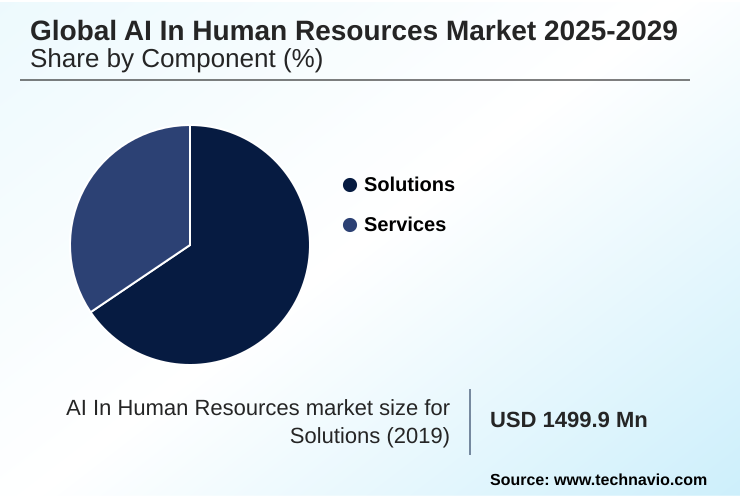
The Solutions segment was valued at USD 3.59 billion in 2023 and showed a gradual increase during the forecast period.

Request Free Sample

Regional Analysis

North America is estimated to contribute 42.3% to the growth of the global market during the forecast period.Technavio’s analysts have elaborately explained the regional trends and drivers that shape the market during the forecast period.

See How AI In Human Resources Market Demand is Rising in North America Request Free Sample

The geographic landscape of the AI in human resources market is characterized by varied adoption rates and distinct regional priorities.

North America leads in maturity, accounting for over 40% of market activity, driven by a focus on competitive talent acquisition platforms and advanced predictive analytics for HR.

Europe's adoption is heavily influenced by regulatory frameworks like GDPR, with over 90% of enterprises prioritizing compliance features in human capital management (hcm) solutions. Natural language processing (NLP) capabilities must often support multiple languages.

In contrast, APAC is the fastest-growing region, where organizations are using AI in workforce management to handle large-scale recruitment and leapfrog legacy systems. This includes intelligent workforce scheduling and AI-based candidate ranking.

Across all regions, the goal is strategic workforce planning, using tools for AI-driven compensation analysis and automated onboarding workflows to optimize operations.

Market Dynamics

Our researchers analyzed the data with 2024 as the base year, along with the key drivers, trends, and challenges. A holistic analysis of drivers will help companies refine their marketing strategies to gain a competitive advantage.

  • Organizations are increasingly leveraging AI to achieve specific, measurable improvements across the HR function. A key objective is to use AI to reduce time-to-hire metrics, where automated systems for AI driven candidate sourcing strategies and screening can shorten recruitment cycles significantly.
  • Simultaneously, a major focus is on using AI to predict employee turnover by analyzing engagement data and identifying at-risk individuals before they resign. The role of AI in performance management is also expanding beyond simple tracking to include sophisticated analysis of performance review feedback.
  • To build a more equitable talent pipeline, companies are adopting generative AI for creating unbiased job ads and implementing tools for mitigating algorithmic bias in recruitment AI. Post-hire, the focus shifts to development and retention. This includes deploying AI platforms for internal talent mobility and using AI for personalizing employee learning paths.
  • An AI chatbot for HR policy questions can answer queries instantly, which improves the overall employee experience. For operational integrity, automating payroll anomaly detection with AI ensures accuracy and compliance.
  • This strategic adoption is paying dividends; for instance, companies that build a dynamic skills inventory with AI have seen internal project staffing times reduced by more than 30% compared to manual allocation methods, directly impacting business agility and evaluating ROI of AI in HR.

What are the key market drivers leading to the rise in the adoption of AI In Human Resources Industry?

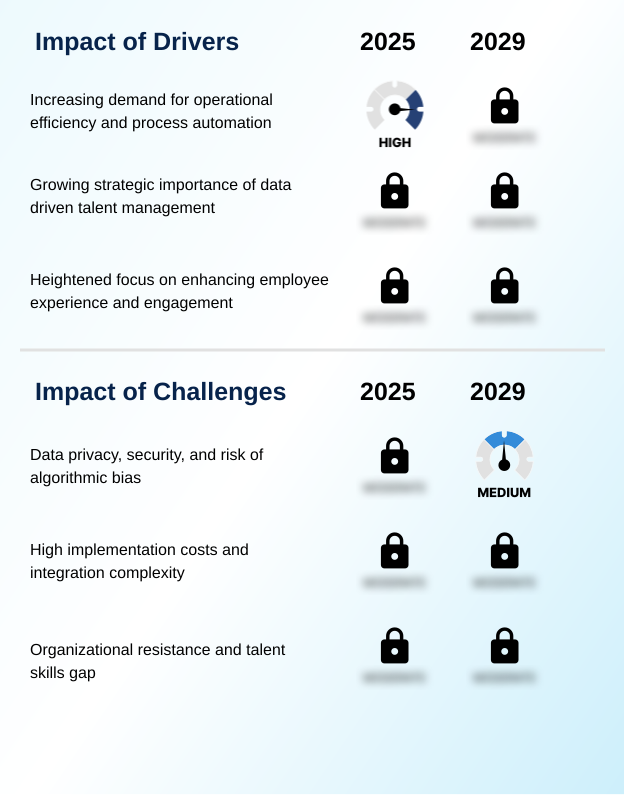
  • The increasing demand for operational efficiency and the automation of administrative processes serves as a primary driver for market growth.

  • The primary driver for market adoption is the pursuit of operational efficiency through intelligent automation. The deployment of HR workflow automation, powered by machine learning algorithms, can automate over 80% of administrative tasks.
  • This includes recruitment process automation (RPA) within an applicant tracking system (ATS) for automated resume screening, which improves recruiter productivity by more than 40%.
  • Conversational AI chatbots create an automated employee service desk, enhancing the AI-enhanced candidate experience and providing instant support. Beyond efficiency, the strategic importance of data-driven talent management is critical.
  • Using predictive hiring models and employee engagement analytics, organizations are improving the quality of hire and leveraging employee retention AI to reduce attrition. This data-centric approach extends to AI for leadership development, building a more effective management layer.

What are the market trends shaping the AI In Human Resources Industry?

  • The proliferation of generative AI and copilot assistants is a defining market trend, fundamentally reshaping HR workflows by embedding interactive and creative capabilities into core platforms.

  • Key market trends revolve around the integration of sophisticated AI that augments human capabilities. The use of an AI copilot for HR professionals, powered by generative AI for job descriptions and communications, reduces content creation time by up to 50%.
  • This is part of a broader shift toward hyper-personalization in HR, where AI-driven learning recommendations and AI-enabled career pathing create unique employee journeys. Such employee experience personalization is enhanced by continuous feedback systems and real-time employee sentiment tracking. Furthermore, the focus on AI-powered skills intelligence is driving the adoption of intelligent talent marketplaces.
  • These platforms conduct proactive skills gap analysis, supporting a more agile talent lifecycle management strategy and improving internal mobility rates by over 35% through better matching.

What challenges does the AI In Human Resources Industry face during its growth?

  • Key challenges affecting industry growth include significant concerns over data privacy, platform security, and the inherent risk of algorithmic bias in decision-making tools.

  • Significant challenges center on ethics, cost, and organizational readiness. The risk of algorithmic bias mitigation remains a primary concern, with regulators demanding greater transparency and mandating bias audits for AI tools. Ensuring ethical AI in HR requires sophisticated bias detection in recruitment algorithms and often explainable AI (XAI) for HR, which adds complexity.
  • Furthermore, high implementation costs and integration complexity are major barriers, as connecting new systems with legacy platforms can cost up to three times the initial software license. The talent skills gap within HR departments is another critical issue, as teams often lack the expertise to manage agentic AI in human resources or implement intelligent document processing for HR.
  • Overcoming these hurdles requires substantial investment in both technology and training, including automated compliance monitoring systems.

Exclusive Technavio Analysis on Customer Landscape

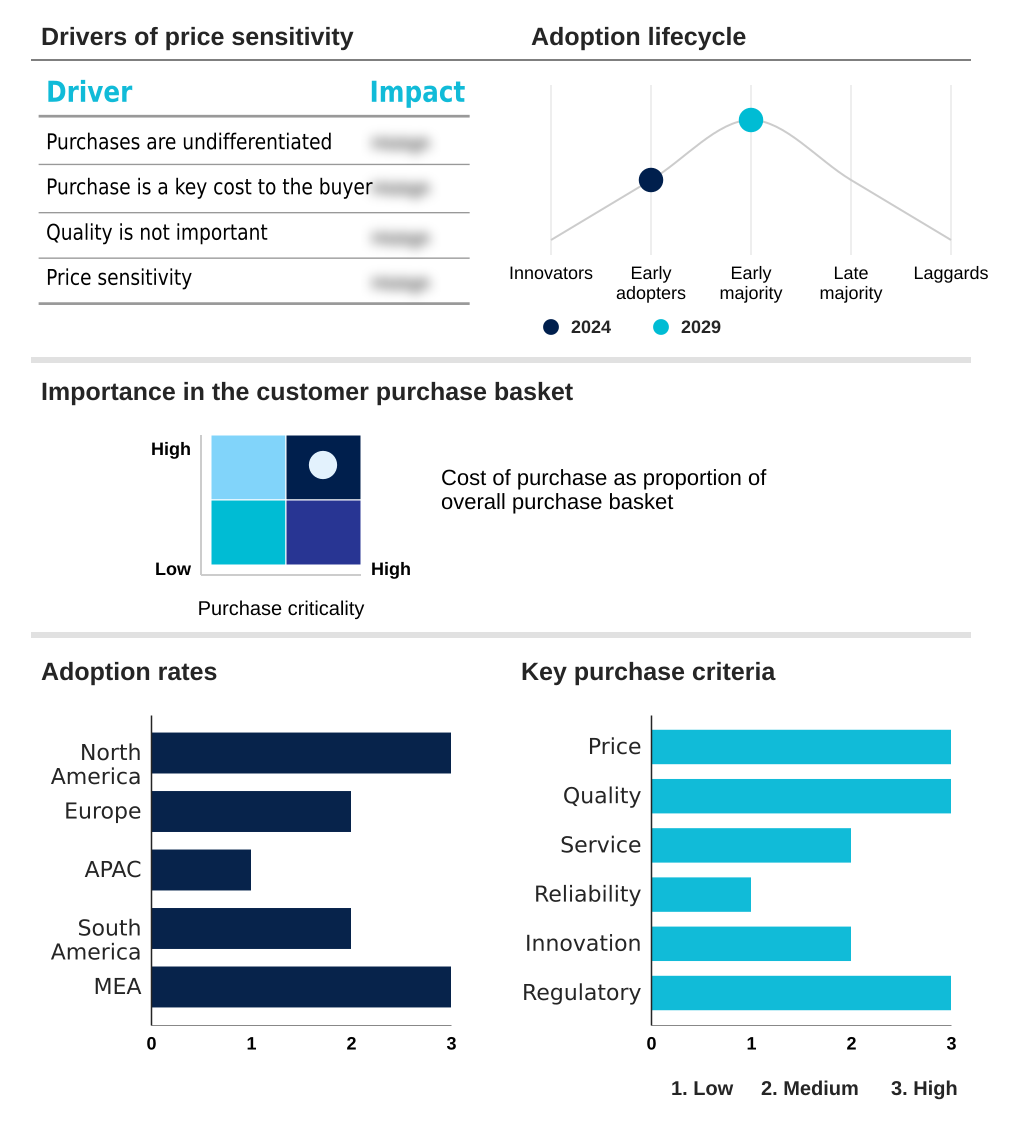
The ai in human resources market forecasting report includes the adoption lifecycle of the market, covering from the innovator’s stage to the laggard’s stage. It focuses on adoption rates in different regions based on penetration. Furthermore, the ai in human resources market report also includes key purchase criteria and drivers of price sensitivity to help companies evaluate and develop their market growth analysis strategies.

Customer Landscape of AI In Human Resources Industry

Competitive Landscape

Companies are implementing various strategies, such as strategic alliances, ai in human resources market forecast, partnerships, mergers and acquisitions, geographical expansion, and product/service launches, to enhance their presence in the industry.

Aisera Inc. - Delivers AI-driven service automation, conversational platforms, and workflow orchestration, enhancing both human resources and IT operational efficiency through intelligent systems.

The industry research and growth report includes detailed analyses of the competitive landscape of the market and information about key companies, including:

  • Aisera Inc.
  • Automatic Data Processing Inc.
  • Bamboo HR LLC
  • Beamery Inc.
  • Betterworks Systems Inc.
  • ClearCo. Inc.
  • Effy AI
  • Eightfold AI
  • Gloat Inc.
  • Hi bob Inc.
  • HireVue Inc.
  • iCIMS Inc.
  • Legion Technologies, Inc.
  • Nowsta, Inc.
  • Personio SE and Co. KG
  • Phenom People Inc.
  • Simpplr
  • Skillsoft Corp.
  • Turbohire Technologies Pvt Ltd
  • Workday Inc.

Qualitative and quantitative analysis of companies has been conducted to help clients understand the wider business environment as well as the strengths and weaknesses of key industry players. Data is qualitatively analyzed to categorize companies as pure play, category-focused, industry-focused, and diversified; it is quantitatively analyzed to categorize companies as dominant, leading, strong, tentative, and weak.

Recent Development and News in Ai in human resources market

  • In September 2024, Workday Inc. launched its advanced 'Skills Cloud AI' module, designed to provide dynamic skills inventory management and proactive skills gap analysis for enterprise clients.
  • In December 2024, Eightfold AI announced the acquisition of 'Algorithmic Fairness Inc.', a startup specializing in bias audits for AI tools, to strengthen its ethical AI and compliance offerings.
  • In February 2025, iCIMS Inc. revealed a strategic partnership with a leading global learning platform to integrate AI-driven learning recommendations directly into its talent lifecycle management suite.
  • In May 2025, Phenom People Inc. expanded its operations into the South American market, opening a new regional headquarters in Brazil to support growing demand for its AI-powered talent experience platform.

Dive into Technavio’s robust research methodology, blending expert interviews, extensive data synthesis, and validated models for unparalleled AI In Human Resources Market insights. See full methodology.

Market Scope
Page number 291
Base year 2024
Historic period 2019-2023
Forecast period 2025-2029
Growth momentum & CAGR Accelerate at a CAGR of 27.6%
Market growth 2025-2029 USD 16550.0 million
Market structure Fragmented
YoY growth 2024-2025(%) 26.2%
Key countries US, Canada, Mexico, Germany, UK, France, Italy, The Netherlands, Spain, China, India, Japan, South Korea, Australia, Indonesia, Brazil, Argentina, Colombia, Saudi Arabia, UAE, South Africa, Israel and Turkey
Competitive landscape Leading Companies, Market Positioning of Companies, Competitive Strategies, and Industry Risks

Request Free Sample

Research Analyst Overview

  • The AI in human resources market is evolving from task automation to strategic augmentation, directly impacting boardroom decisions on talent strategy and compliance. The integration of technologies such as natural language processing (nlp), predictive hiring models, and machine learning algorithms into core HR workflow automation is now standard.
  • Platforms focusing on data-driven talent management and employee engagement analytics are critical for competitive advantage. A key trend is the use of AI-powered skills intelligence and sentiment analysis tools to inform workforce planning analytics and predictive succession planning. The adoption of conversational AI chatbots for employee services has demonstrated a 40% reduction in resolution time for routine HR inquiries.
  • This shift necessitates a focus on algorithmic bias mitigation and robust people analytics platforms. As organizations adopt tools for automated interview scheduling and talent lifecycle management, they must also invest in systems for continuous feedback and AI-assisted performance reviews, ensuring that the technology supports a more agile and equitable workplace.

What are the Key Data Covered in this AI In Human Resources Market Research and Growth Report?

  • What is the expected growth of the AI In Human Resources Market between 2025 and 2029?

    • USD 16.55 billion, at a CAGR of 27.6%

  • What segmentation does the market report cover?

    • The report is segmented by Component (Solutions, Services), Deployment (Cloud, On premises), Application (Recruitment and hiring, Employee onboarding and engagement, Performance management, Payroll processing, Learning and development) and Geography (North America, Europe, APAC, South America, Middle East and Africa)

  • Which regions are analyzed in the report?

    • North America, Europe, APAC, South America and Middle East and Africa

  • What are the key growth drivers and market challenges?

    • Increasing demand for operational efficiency and process automation , Data privacy, security, and risk of algorithmic bias

  • Who are the major players in the AI In Human Resources Market?

    • Aisera Inc., Automatic Data Processing Inc., Bamboo HR LLC, Beamery Inc., Betterworks Systems Inc., ClearCo. Inc., Effy AI, Eightfold AI, Gloat Inc., Hi bob Inc., HireVue Inc., iCIMS Inc., Legion Technologies, Inc., Nowsta, Inc., Personio SE and Co. KG, Phenom People Inc., Simpplr, Skillsoft Corp., Turbohire Technologies Pvt Ltd and Workday Inc.

Market Research Insights

  • Market dynamics are increasingly shaped by the pursuit of measurable business outcomes through intelligent automation. Organizations leveraging AI for strategic workforce planning report improvements in forecast accuracy by up to 30%. The deployment of an automated employee service desk, powered by natural language understanding (NLU), can resolve over 75% of routine inquiries without human intervention, significantly enhancing operational efficiency.
  • This focus on AI-enhanced candidate experience and employee lifecycle analytics is critical. Through proactive skills gap analysis and AI-enabled career pathing, businesses can better align talent development with corporate objectives. Platforms offering real-time employee sentiment tracking provide leaders with actionable insights, while intelligent talent marketplaces foster internal mobility.
  • The adoption of AI for leadership development is another key area, aiming to cultivate a more agile and data-literate management tier.

We can help! Our analysts can customize this ai in human resources market research report to meet your requirements.

Get in touch

1. Executive Summary

1.1 Market overview

Executive Summary - Chart on Market Overview
Executive Summary - Data Table on Market Overview
Executive Summary - Chart on Global Market Characteristics
Executive Summary - Chart on Market by Geography
Executive Summary - Chart on Market Segmentation by Component
Executive Summary - Chart on Market Segmentation by Deployment
Executive Summary - Chart on Market Segmentation by Application
Executive Summary - Chart on Incremental Growth
Executive Summary - Data Table on Incremental Growth
Executive Summary - Chart on Company Market Positioning

2. Technavio Analysis

2.1 Analysis of price sensitivity, lifecycle, customer purchase basket, adoption rates, and purchase criteria

2.2 Criticality of inputs and Factors of differentiation

Chart on Overview on criticality of inputs and factors of differentiation

2.3 Factors of disruption

Chart on Overview on factors of disruption

2.4 Impact of drivers and challenges

Chart on Impact of drivers and challenges in 2024 and 2029

3. Market Landscape

3.1 Market ecosystem

Chart on Parent Market
Data Table on - Parent Market

3.2 Market characteristics

Chart on Market characteristics analysis

3.3 Value chain analysis

Chart on Value chain analysis

4. Market Sizing

4.1 Market definition

Data Table on Offerings of companies included in the market definition

4.2 Market segment analysis

Market segments

4.3 Market size 2024

4.4 Market outlook: Forecast for 2024-2029

Chart on Global - Market size and forecast 2024-2029 ($ million)
Data Table on Global - Market size and forecast 2024-2029 ($ million)
Chart on Global Market: Year-over-year growth 2024-2029 (%)
Data Table on Global Market: Year-over-year growth 2024-2029 (%)

5. Historic Market Size

5.1 Global AI In Human Resources Market 2019 - 2023

Historic Market Size - Data Table on Global AI In Human Resources Market 2019 - 2023 ($ million)

5.2 Component segment analysis 2019 - 2023

Historic Market Size - Component Segment 2019 - 2023 ($ million)

5.3 Deployment segment analysis 2019 - 2023

Historic Market Size - Deployment Segment 2019 - 2023 ($ million)

5.4 Application segment analysis 2019 - 2023

Historic Market Size - Application Segment 2019 - 2023 ($ million)

5.5 Geography segment analysis 2019 - 2023

Historic Market Size - Geography Segment 2019 - 2023 ($ million)

5.6 Country segment analysis 2019 - 2023

Historic Market Size - Country Segment 2019 - 2023 ($ million)

6. Five Forces Analysis

6.1 Five forces summary

Five forces analysis - Comparison between 2024 and 2029

6.2 Bargaining power of buyers

Bargaining power of buyers - Impact of key factors 2024 and 2029

6.3 Bargaining power of suppliers

Bargaining power of suppliers - Impact of key factors in 2024 and 2029

6.4 Threat of new entrants

Threat of new entrants - Impact of key factors in 2024 and 2029

6.5 Threat of substitutes

Threat of substitutes - Impact of key factors in 2024 and 2029

6.6 Threat of rivalry

Threat of rivalry - Impact of key factors in 2024 and 2029

6.7 Market condition

Chart on Market condition - Five forces 2024 and 2029

7. Market Segmentation by Component

7.1 Market segments

Chart on Component - Market share 2024-2029 (%)
Data Table on Component - Market share 2024-2029 (%)

7.2 Comparison by Component

Chart on Comparison by Component
Data Table on Comparison by Component

7.3 Solutions - Market size and forecast 2024-2029

Chart on Solutions - Market size and forecast 2024-2029 ($ million)
Data Table on Solutions - Market size and forecast 2024-2029 ($ million)
Chart on Solutions - Year-over-year growth 2024-2029 (%)
Data Table on Solutions - Year-over-year growth 2024-2029 (%)

7.4 Services - Market size and forecast 2024-2029

Chart on Services - Market size and forecast 2024-2029 ($ million)
Data Table on Services - Market size and forecast 2024-2029 ($ million)
Chart on Services - Year-over-year growth 2024-2029 (%)
Data Table on Services - Year-over-year growth 2024-2029 (%)

7.5 Market opportunity by Component

Market opportunity by Component ($ million)
Data Table on Market opportunity by Component ($ million)

8. Market Segmentation by Deployment

8.1 Market segments

Chart on Deployment - Market share 2024-2029 (%)
Data Table on Deployment - Market share 2024-2029 (%)

8.2 Comparison by Deployment

Chart on Comparison by Deployment
Data Table on Comparison by Deployment

8.3 Cloud - Market size and forecast 2024-2029

Chart on Cloud - Market size and forecast 2024-2029 ($ million)
Data Table on Cloud - Market size and forecast 2024-2029 ($ million)
Chart on Cloud - Year-over-year growth 2024-2029 (%)
Data Table on Cloud - Year-over-year growth 2024-2029 (%)

8.4 On premises - Market size and forecast 2024-2029

Chart on On premises - Market size and forecast 2024-2029 ($ million)
Data Table on On premises - Market size and forecast 2024-2029 ($ million)
Chart on On premises - Year-over-year growth 2024-2029 (%)
Data Table on On premises - Year-over-year growth 2024-2029 (%)

8.5 Market opportunity by Deployment

Market opportunity by Deployment ($ million)
Data Table on Market opportunity by Deployment ($ million)

9. Market Segmentation by Application

9.1 Market segments

Chart on Application - Market share 2024-2029 (%)
Data Table on Application - Market share 2024-2029 (%)

9.2 Comparison by Application

Chart on Comparison by Application
Data Table on Comparison by Application

9.3 Recruitment and hiring - Market size and forecast 2024-2029

Chart on Recruitment and hiring - Market size and forecast 2024-2029 ($ million)
Data Table on Recruitment and hiring - Market size and forecast 2024-2029 ($ million)
Chart on Recruitment and hiring - Year-over-year growth 2024-2029 (%)
Data Table on Recruitment and hiring - Year-over-year growth 2024-2029 (%)

9.4 Employee onboarding and engagement - Market size and forecast 2024-2029

Chart on Employee onboarding and engagement - Market size and forecast 2024-2029 ($ million)
Data Table on Employee onboarding and engagement - Market size and forecast 2024-2029 ($ million)
Chart on Employee onboarding and engagement - Year-over-year growth 2024-2029 (%)
Data Table on Employee onboarding and engagement - Year-over-year growth 2024-2029 (%)

9.5 Performance management - Market size and forecast 2024-2029

Chart on Performance management - Market size and forecast 2024-2029 ($ million)
Data Table on Performance management - Market size and forecast 2024-2029 ($ million)
Chart on Performance management - Year-over-year growth 2024-2029 (%)
Data Table on Performance management - Year-over-year growth 2024-2029 (%)

9.6 Payroll processing - Market size and forecast 2024-2029

Chart on Payroll processing - Market size and forecast 2024-2029 ($ million)
Data Table on Payroll processing - Market size and forecast 2024-2029 ($ million)
Chart on Payroll processing - Year-over-year growth 2024-2029 (%)
Data Table on Payroll processing - Year-over-year growth 2024-2029 (%)

9.7 Learning and development - Market size and forecast 2024-2029

Chart on Learning and development - Market size and forecast 2024-2029 ($ million)
Data Table on Learning and development - Market size and forecast 2024-2029 ($ million)
Chart on Learning and development - Year-over-year growth 2024-2029 (%)
Data Table on Learning and development - Year-over-year growth 2024-2029 (%)

9.8 Market opportunity by Application

Market opportunity by Application ($ million)
Data Table on Market opportunity by Application ($ million)

10. Customer Landscape

10.1 Customer landscape overview

Analysis of price sensitivity, lifecycle, customer purchase basket, adoption rates, and purchase criteria

11. Geographic Landscape

11.1 Geographic segmentation

Chart on Market share by geography 2024-2029 (%)
Data Table on Market share by geography 2024-2029 (%)

11.2 Geographic comparison

Chart on Geographic comparison
Data Table on Geographic comparison

11.3 North America - Market size and forecast 2024-2029

Chart on North America - Market size and forecast 2024-2029 ($ million)
Data Table on North America - Market size and forecast 2024-2029 ($ million)
Chart on North America - Year-over-year growth 2024-2029 (%)
Data Table on North America - Year-over-year growth 2024-2029 (%)
Chart on Regional Comparison - North America
Data Table on Regional Comparison - North America

11.3.1 US - Market size and forecast 2024-2029

Chart on US - Market size and forecast 2024-2029 ($ million)
Data Table on US - Market size and forecast 2024-2029 ($ million)
Chart on US - Year-over-year growth 2024-2029 (%)
Data Table on US - Year-over-year growth 2024-2029 (%)

11.3.2 Canada - Market size and forecast 2024-2029

Chart on Canada - Market size and forecast 2024-2029 ($ million)
Data Table on Canada - Market size and forecast 2024-2029 ($ million)
Chart on Canada - Year-over-year growth 2024-2029 (%)
Data Table on Canada - Year-over-year growth 2024-2029 (%)

11.3.3 Mexico - Market size and forecast 2024-2029

Chart on Mexico - Market size and forecast 2024-2029 ($ million)
Data Table on Mexico - Market size and forecast 2024-2029 ($ million)
Chart on Mexico - Year-over-year growth 2024-2029 (%)
Data Table on Mexico - Year-over-year growth 2024-2029 (%)

11.4 Europe - Market size and forecast 2024-2029

Chart on Europe - Market size and forecast 2024-2029 ($ million)
Data Table on Europe - Market size and forecast 2024-2029 ($ million)
Chart on Europe - Year-over-year growth 2024-2029 (%)
Data Table on Europe - Year-over-year growth 2024-2029 (%)
Chart on Regional Comparison - Europe
Data Table on Regional Comparison - Europe

11.4.1 Germany - Market size and forecast 2024-2029

Chart on Germany - Market size and forecast 2024-2029 ($ million)
Data Table on Germany - Market size and forecast 2024-2029 ($ million)
Chart on Germany - Year-over-year growth 2024-2029 (%)
Data Table on Germany - Year-over-year growth 2024-2029 (%)

11.4.2 UK - Market size and forecast 2024-2029

Chart on UK - Market size and forecast 2024-2029 ($ million)
Data Table on UK - Market size and forecast 2024-2029 ($ million)
Chart on UK - Year-over-year growth 2024-2029 (%)
Data Table on UK - Year-over-year growth 2024-2029 (%)

11.4.3 France - Market size and forecast 2024-2029

Chart on France - Market size and forecast 2024-2029 ($ million)
Data Table on France - Market size and forecast 2024-2029 ($ million)
Chart on France - Year-over-year growth 2024-2029 (%)
Data Table on France - Year-over-year growth 2024-2029 (%)

11.4.4 Italy - Market size and forecast 2024-2029

Chart on Italy - Market size and forecast 2024-2029 ($ million)
Data Table on Italy - Market size and forecast 2024-2029 ($ million)
Chart on Italy - Year-over-year growth 2024-2029 (%)
Data Table on Italy - Year-over-year growth 2024-2029 (%)

11.4.5 The Netherlands - Market size and forecast 2024-2029

Chart on The Netherlands - Market size and forecast 2024-2029 ($ million)
Data Table on The Netherlands - Market size and forecast 2024-2029 ($ million)
Chart on The Netherlands - Year-over-year growth 2024-2029 (%)
Data Table on The Netherlands - Year-over-year growth 2024-2029 (%)

11.4.6 Spain - Market size and forecast 2024-2029

Chart on Spain - Market size and forecast 2024-2029 ($ million)
Data Table on Spain - Market size and forecast 2024-2029 ($ million)
Chart on Spain - Year-over-year growth 2024-2029 (%)
Data Table on Spain - Year-over-year growth 2024-2029 (%)

11.5 APAC - Market size and forecast 2024-2029

Chart on APAC - Market size and forecast 2024-2029 ($ million)
Data Table on APAC - Market size and forecast 2024-2029 ($ million)
Chart on APAC - Year-over-year growth 2024-2029 (%)
Data Table on APAC - Year-over-year growth 2024-2029 (%)
Chart on Regional Comparison - APAC
Data Table on Regional Comparison - APAC

11.5.1 China - Market size and forecast 2024-2029

Chart on China - Market size and forecast 2024-2029 ($ million)
Data Table on China - Market size and forecast 2024-2029 ($ million)
Chart on China - Year-over-year growth 2024-2029 (%)
Data Table on China - Year-over-year growth 2024-2029 (%)

11.5.2 India - Market size and forecast 2024-2029

Chart on India - Market size and forecast 2024-2029 ($ million)
Data Table on India - Market size and forecast 2024-2029 ($ million)
Chart on India - Year-over-year growth 2024-2029 (%)
Data Table on India - Year-over-year growth 2024-2029 (%)

11.5.3 Japan - Market size and forecast 2024-2029

Chart on Japan - Market size and forecast 2024-2029 ($ million)
Data Table on Japan - Market size and forecast 2024-2029 ($ million)
Chart on Japan - Year-over-year growth 2024-2029 (%)
Data Table on Japan - Year-over-year growth 2024-2029 (%)

11.5.4 South Korea - Market size and forecast 2024-2029

Chart on South Korea - Market size and forecast 2024-2029 ($ million)
Data Table on South Korea - Market size and forecast 2024-2029 ($ million)
Chart on South Korea - Year-over-year growth 2024-2029 (%)
Data Table on South Korea - Year-over-year growth 2024-2029 (%)

11.5.5 Australia - Market size and forecast 2024-2029

Chart on Australia - Market size and forecast 2024-2029 ($ million)
Data Table on Australia - Market size and forecast 2024-2029 ($ million)
Chart on Australia - Year-over-year growth 2024-2029 (%)
Data Table on Australia - Year-over-year growth 2024-2029 (%)

11.5.6 Indonesia - Market size and forecast 2024-2029

Chart on Indonesia - Market size and forecast 2024-2029 ($ million)
Data Table on Indonesia - Market size and forecast 2024-2029 ($ million)
Chart on Indonesia - Year-over-year growth 2024-2029 (%)
Data Table on Indonesia - Year-over-year growth 2024-2029 (%)

11.6 South America - Market size and forecast 2024-2029

Chart on South America - Market size and forecast 2024-2029 ($ million)
Data Table on South America - Market size and forecast 2024-2029 ($ million)
Chart on South America - Year-over-year growth 2024-2029 (%)
Data Table on South America - Year-over-year growth 2024-2029 (%)
Chart on Regional Comparison - South America
Data Table on Regional Comparison - South America

11.6.1 Brazil - Market size and forecast 2024-2029

Chart on Brazil - Market size and forecast 2024-2029 ($ million)
Data Table on Brazil - Market size and forecast 2024-2029 ($ million)
Chart on Brazil - Year-over-year growth 2024-2029 (%)
Data Table on Brazil - Year-over-year growth 2024-2029 (%)

11.6.2 Argentina - Market size and forecast 2024-2029

Chart on Argentina - Market size and forecast 2024-2029 ($ million)
Data Table on Argentina - Market size and forecast 2024-2029 ($ million)
Chart on Argentina - Year-over-year growth 2024-2029 (%)
Data Table on Argentina - Year-over-year growth 2024-2029 (%)

11.6.3 Colombia - Market size and forecast 2024-2029

Chart on Colombia - Market size and forecast 2024-2029 ($ million)
Data Table on Colombia - Market size and forecast 2024-2029 ($ million)
Chart on Colombia - Year-over-year growth 2024-2029 (%)
Data Table on Colombia - Year-over-year growth 2024-2029 (%)

11.7 Middle East and Africa - Market size and forecast 2024-2029

Chart on Middle East and Africa - Market size and forecast 2024-2029 ($ million)
Data Table on Middle East and Africa - Market size and forecast 2024-2029 ($ million)
Chart on Middle East and Africa - Year-over-year growth 2024-2029 (%)
Data Table on Middle East and Africa - Year-over-year growth 2024-2029 (%)
Chart on Regional Comparison - Middle East and Africa
Data Table on Regional Comparison - Middle East and Africa

11.7.1 Saudi Arabia - Market size and forecast 2024-2029

Chart on Saudi Arabia - Market size and forecast 2024-2029 ($ million)
Data Table on Saudi Arabia - Market size and forecast 2024-2029 ($ million)
Chart on Saudi Arabia - Year-over-year growth 2024-2029 (%)
Data Table on Saudi Arabia - Year-over-year growth 2024-2029 (%)

11.7.2 UAE - Market size and forecast 2024-2029

Chart on UAE - Market size and forecast 2024-2029 ($ million)
Data Table on UAE - Market size and forecast 2024-2029 ($ million)
Chart on UAE - Year-over-year growth 2024-2029 (%)
Data Table on UAE - Year-over-year growth 2024-2029 (%)

11.7.3 South Africa - Market size and forecast 2024-2029

Chart on South Africa - Market size and forecast 2024-2029 ($ million)
Data Table on South Africa - Market size and forecast 2024-2029 ($ million)
Chart on South Africa - Year-over-year growth 2024-2029 (%)
Data Table on South Africa - Year-over-year growth 2024-2029 (%)

11.7.4 Israel - Market size and forecast 2024-2029

Chart on Israel - Market size and forecast 2024-2029 ($ million)
Data Table on Israel - Market size and forecast 2024-2029 ($ million)
Chart on Israel - Year-over-year growth 2024-2029 (%)
Data Table on Israel - Year-over-year growth 2024-2029 (%)

11.7.5 Turkey - Market size and forecast 2024-2029

Chart on Turkey - Market size and forecast 2024-2029 ($ million)
Data Table on Turkey - Market size and forecast 2024-2029 ($ million)
Chart on Turkey - Year-over-year growth 2024-2029 (%)
Data Table on Turkey - Year-over-year growth 2024-2029 (%)

11.8 Market opportunity by geography

Market opportunity by geography ($ million)
Data Tables on Market opportunity by geography ($ million)

12. Drivers, Challenges, and Opportunity

12.1 Market drivers

Increasing demand for operational efficiency and process automation
Growing strategic importance of data driven talent management
Heightened focus on enhancing employee experience and engagement

12.2 Market challenges

Data privacy, security, and risk of algorithmic bias
High implementation costs and integration complexity
Organizational resistance and talent skills gap

12.3 Impact of drivers and challenges

Impact of drivers and challenges in 2024 and 2029

12.4 Market opportunities

Proliferation of generative AI and copilot assistants
Shift toward hyper-personalization of employee experience
Focus on AI-powered skills intelligence and internal mobility

13. Competitive Landscape

13.1 Overview

13.2

Overview on criticality of inputs and factors of differentiation

13.3 Landscape disruption

Overview on factors of disruption

13.4 Industry risks

Impact of key risks on business

14. Competitive Analysis

14.1 Companies profiled

Companies covered

14.2 Company ranking index

14.3 Market positioning of companies

Matrix on companies position and classification

14.4 Aisera Inc.

Aisera Inc. - Overview
Aisera Inc. - Product / Service
Aisera Inc. - Key offerings
SWOT

14.5 Automatic Data Processing Inc.

Automatic Data Processing Inc. - Overview
Automatic Data Processing Inc. - Business segments
Automatic Data Processing Inc. - Key news
Automatic Data Processing Inc. - Key offerings
Automatic Data Processing Inc. - Segment focus
SWOT

14.6 Bamboo HR LLC

Bamboo HR LLC - Overview
Bamboo HR LLC - Product / Service
Bamboo HR LLC - Key offerings
SWOT

14.7 Beamery Inc.

Beamery Inc. - Overview
Beamery Inc. - Product / Service
Beamery Inc. - Key offerings
SWOT

14.8 Betterworks Systems Inc.

Betterworks Systems Inc. - Overview
Betterworks Systems Inc. - Product / Service
Betterworks Systems Inc. - Key offerings
SWOT

14.9 Eightfold AI

Eightfold AI - Overview
Eightfold AI - Product / Service
Eightfold AI - Key offerings
SWOT

14.10 Gloat Inc.

Gloat Inc. - Overview
Gloat Inc. - Product / Service
Gloat Inc. - Key offerings
SWOT

14.11 HireVue Inc.

HireVue Inc. - Overview
HireVue Inc. - Product / Service
HireVue Inc. - Key offerings
SWOT

14.12 iCIMS Inc.

iCIMS Inc. - Overview
iCIMS Inc. - Product / Service
iCIMS Inc. - Key offerings
SWOT

14.13 Legion Technologies, Inc.

Legion Technologies, Inc. - Overview
Legion Technologies, Inc. - Product / Service
Legion Technologies, Inc. - Key offerings
SWOT

14.14 Personio SE and Co. KG

Personio SE and Co. KG - Overview
Personio SE and Co. KG - Product / Service
Personio SE and Co. KG - Key offerings
SWOT

14.15 Phenom People Inc.

Phenom People Inc. - Overview
Phenom People Inc. - Product / Service
Phenom People Inc. - Key offerings
SWOT

14.16 Simpplr

Simpplr - Overview
Simpplr - Product / Service
Simpplr - Key offerings
SWOT

14.17 Turbohire Technologies Pvt Ltd

Turbohire Technologies Pvt Ltd - Overview
Turbohire Technologies Pvt Ltd - Product / Service
Turbohire Technologies Pvt Ltd - Key offerings
SWOT

14.18 Workday Inc.

Workday Inc. - Overview
Workday Inc. - Product / Service
Workday Inc. - Key news
Workday Inc. - Key offerings
SWOT

15. Appendix

15.1 Scope of the report

Market definition
Objectives
Notes and caveats

15.2 Inclusions and exclusions checklist

Inclusions checklist
Exclusions checklist

15.3 Currency conversion rates for US$

15.4 Research methodology

15.5 Data procurement

Information sources

15.6 Data validation

15.7 Validation techniques employed for market sizing

15.8 Data synthesis

15.9 360 degree market analysis

15.10 List of abbreviations

Research Methodology

Technavio presents a detailed picture of the market by way of study, synthesis, and summation of data from multiple sources. The analysts have presented the various facets of the market with a particular focus on identifying the key industry influencers. The data thus presented is comprehensive, reliable, and the result of extensive research, both primary and secondary.

INFORMATION SOURCES

Primary sources

  • Manufacturers and suppliers
  • Channel partners
  • Industry experts
  • Strategic decision makers

Secondary sources

  • Industry journals and periodicals
  • Government data
  • Financial reports of key industry players
  • Historical data
  • Press releases

DATA ANALYSIS

Data Synthesis

  • Collation of data
  • Estimation of key figures
  • Analysis of derived insights

Data Validation

  • Triangulation with data models
  • Reference against proprietary databases
  • Corroboration with industry experts

REPORT WRITING

Qualitative

  • Market drivers
  • Market challenges
  • Market trends
  • Five forces analysis

Quantitative

  • Market size and forecast
  • Market segmentation
  • Geographical insights
  • Competitive landscape

Interested in this report?

Get your sample now to see our research methodology and insights!

Download Now

Frequently Asked Questions

AI In Human Resources market growth will increase by USD 16550.0 million during 2025-2029.

The AI In Human Resources market is expected to grow at a CAGR of 27.6% during 2025-2029.

AI In Human Resources market is segmented by Component (Solutions, Services) Deployment (Cloud, On premises) Application (Recruitment and hiring, Employee onboarding and engagement, Performance management, Payroll processing, Learning and development)

Aisera Inc., Automatic Data Processing Inc., Bamboo HR LLC, Beamery Inc., Betterworks Systems Inc., ClearCo. Inc., Effy AI, Eightfold AI, Gloat Inc., Hi bob Inc., HireVue Inc., iCIMS Inc., Legion Technologies, Inc., Nowsta, Inc., Personio SE and Co. KG, Phenom People Inc., Simpplr, Skillsoft Corp., Turbohire Technologies Pvt Ltd, Workday Inc. are a few of the key vendors in the AI In Human Resources market.

North America will register the highest growth rate of 42.3% among the other regions. Therefore, the AI In Human Resources market in North America is expected to garner significant business opportunities for the vendors during the forecast period.

US, Canada, Mexico, Germany, UK, France, Italy, The Netherlands, Spain, China, India, Japan, South Korea, Australia, Indonesia, Brazil, Argentina, Colombia, Saudi Arabia, UAE, South Africa, Israel, Turkey

  • Increasing demand for operational efficiency and process automation is the driving factor this market.

The AI In Human Resources market vendors should focus on grabbing business opportunities from the Component segment as it accounted for the largest market share in the base year.