
AI In Pharma And Biotech Market Size 2025-2029
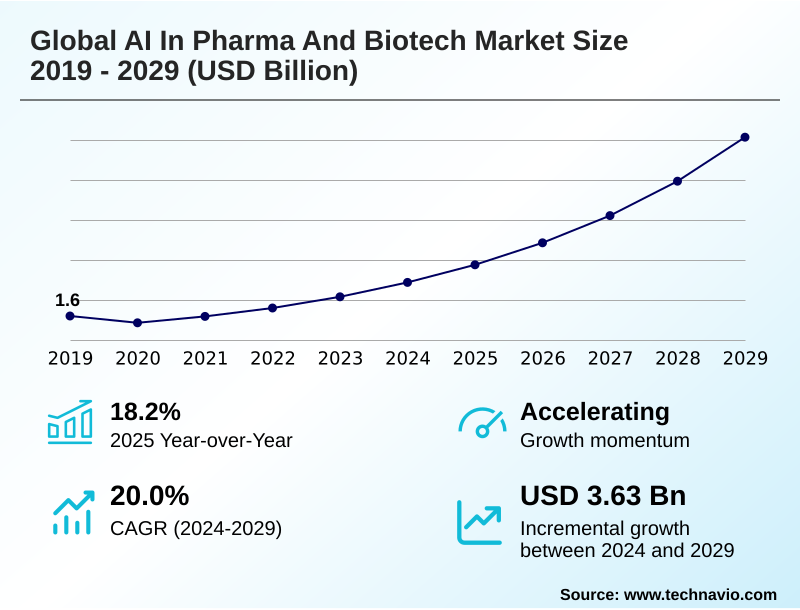
The ai in pharma and biotech market size is valued to increase by USD 3.63 billion, at a CAGR of 20% from 2024 to 2029. Imperative to overcome declining research and development productivity and escalating costs will drive the ai in pharma and biotech market.
Major Market Trends & Insights
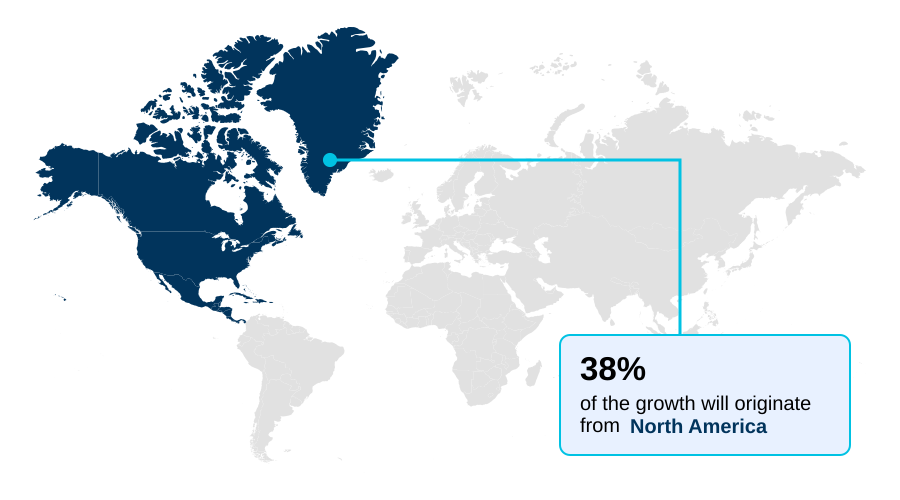
- North America dominated the market and accounted for a 37.9% growth during the forecast period.
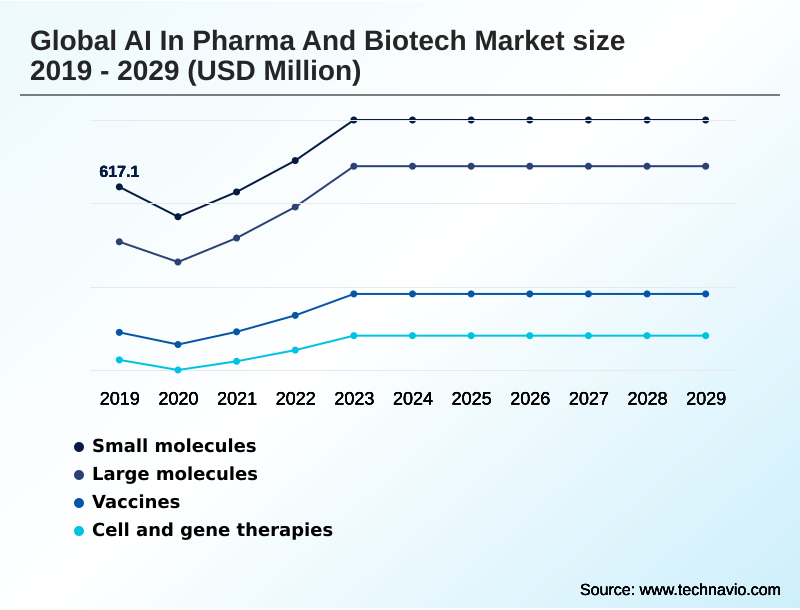
- By Type - Small molecules segment was valued at USD 773.1 million in 2023
- By Technology - Machine learning segment accounted for the largest market revenue share in 2023
Market Size & Forecast
- Market Opportunities: USD 4.47 billion
- Market Future Opportunities: USD 3.63 billion
- CAGR from 2024 to 2029 : 20%
Market Summary
- The AI in pharma and biotech market is undergoing a fundamental transformation, moving from traditional, high-attrition research to a data-centric paradigm. This evolution is driven by the urgent need to address the inefficiencies of drug development, where escalating costs and long timelines have become unsustainable.
- Key to this shift is the application of advanced computational technologies like machine learning, deep learning, and natural language processing across the entire value chain. A core application is the industrialization of discovery through integrated, AI-powered R&D platforms.
- For instance, in a typical business scenario, an organization can now leverage generative AI to design novel molecules with optimized properties from the ground up, bypassing years of manual screening. This is complemented by predictive models that de-risk candidates early by forecasting their efficacy and toxicity profiles.
- While challenges such as data governance and the 'black box' nature of some algorithms persist, the strategic adoption of AI is becoming non-negotiable. It enables the scaling of precision medicine, the acceleration of clinical trials, and the discovery of therapies for previously untreatable diseases, making it an indispensable asset for competitive advantage and innovation in modern medicine.
What will be the Size of the AI In Pharma And Biotech Market during the forecast period?
Get Key Insights on Market Forecast (PDF) Request Free Sample
How is the AI In Pharma And Biotech Market Segmented?
The ai in pharma and biotech industry research report provides comprehensive data (region-wise segment analysis), with forecasts and estimates in "USD million" for the period 2025-2029, as well as historical data from 2019-2023 for the following segments.
- Type
- Small molecules
- Large molecules
- Vaccines
- Cell and gene therapies
- Technology
- Machine learning
- Deep learning
- NLP
- Computer vision
- Generative AI
- Application
- Drug discovery
- Preclinical and clinical trials
- Regulatory compliance and pharmacovigilance
- Others
- Geography
- North America
- US
- Canada
- Mexico
- Europe
- Germany
- UK
- France
- APAC
- China
- Japan
- India
- South America
- Brazil
- Argentina
- Colombia
- Middle East and Africa
- Saudi Arabia
- UAE
- South Africa
- Rest of World (ROW)
- North America
By Type Insights
The small molecules segment is estimated to witness significant growth during the forecast period.
The discovery and development of small molecules is being transformed by rational, predictive design powered by artificial intelligence.
Generative AI algorithms are central to this shift, enabling the de novo drug design of novel chemical entities that are optimized for specific disease targets. This in-silico creation process is significantly more efficient than traditional high-throughput screening.
Predictive ADMET modeling is indispensable for early-stage de-risking, as algorithms forecast a compound's properties, allowing researchers to computationally filter candidates before committing to expensive lab synthesis.
This AI-driven approach is a core part of personalized medicine platforms, where the goal is to create bespoke therapeutics.
This refined methodology has demonstrated the ability to shorten preclinical development timelines by over 50% in certain projects, validating the industry's strategic investment in AI for small molecule drug discovery.
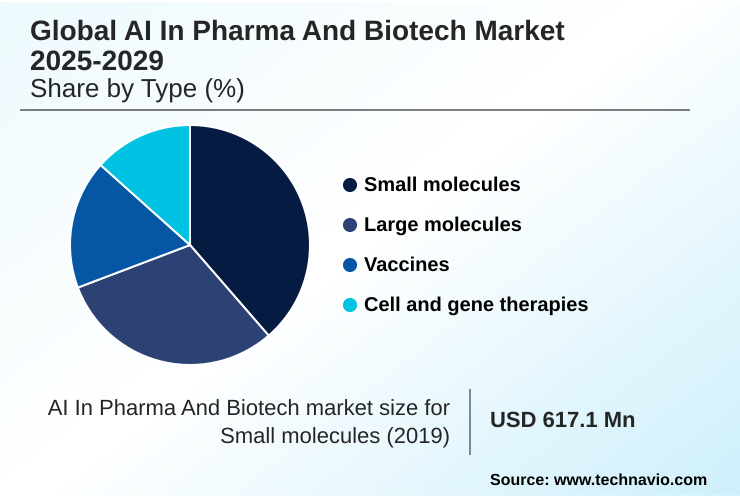
The Small molecules segment was valued at USD 773.1 million in 2023 and showed a gradual increase during the forecast period.
Regional Analysis
North America is estimated to contribute 37.9% to the growth of the global market during the forecast period.Technavio’s analysts have elaborately explained the regional trends and drivers that shape the market during the forecast period.
See How AI In Pharma And Biotech Market Demand is Rising in North America Request Free Sample
North America commands the AI in pharma and biotech market, accounting for 37.9% of the global incremental growth, driven by a dense ecosystem of AI-native biotechnology firms and massive investment from established pharmaceutical companies.
This region's leadership is built on a synergy between advanced technology hubs and deep life sciences expertise, facilitating innovations in multi-omics data analysis and GxP-compliant applications.
Meanwhile, APAC is the fastest-expanding region, with its market growth outpacing Europe's by nearly 15%. This surge is led by China, which is leveraging significant government investment to build state-of-the-art generative AI platforms.
Europe remains a critical market, distinguished by strong public-private partnerships and advancements in federated learning to navigate its stringent data privacy regulations.
This geographic landscape highlights a global race to integrate high-performance computing and AI for a competitive edge in therapeutic innovation.
Market Dynamics
Our researchers analyzed the data with 2024 as the base year, along with the key drivers, trends, and challenges. A holistic analysis of drivers will help companies refine their marketing strategies to gain a competitive advantage.
- The strategic integration of artificial intelligence is fundamentally reshaping the pharmaceutical and biotechnology landscape, creating a more predictive and efficient paradigm for therapeutic innovation. The process begins with foundational technologies for early-stage research, where AI for small molecule drug discovery is paramount.
- This is complemented by deep learning for protein structure prediction, which provides the high-resolution blueprints necessary for rational design. Building upon this, the industry is increasingly using generative AI for antibody design, creating novel biologics with enhanced specificity and functionality.
- These advanced tools are not generic; they are fine-tuned through a rigorous, AI-driven biomarker discovery process that identifies patient subgroups most likely to respond to a given therapy, paving the way for true precision medicine. Furthermore, the value of AI extends deep into the clinical and post-market phases, where NLP for real-world evidence analysis is becoming indispensable.
- By mining vast repositories of unstructured data from electronic health records and other sources, companies can optimize clinical trial protocols, monitor long-term safety, and substantiate product value to payers.
- For instance, platforms leveraging NLP for real-world evidence analysis can identify eligible patient cohorts for rare disease trials up to three times faster than traditional manual screening methods, significantly accelerating trial timelines and reducing operational costs. This end-to-end integration demonstrates that AI is no longer a peripheral tool but the central operating system for modern drug development.
What are the key market drivers leading to the rise in the adoption of AI In Pharma And Biotech Industry?
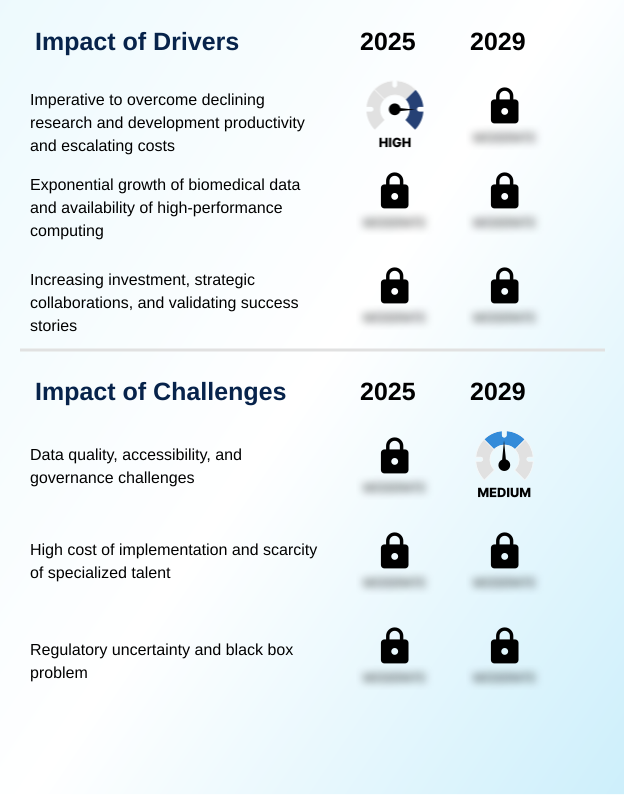
- The primary market driver is the imperative to overcome declining research and development productivity and escalating costs through technological innovation.
- Market expansion is fueled by the urgent need to solve the industry's productivity crisis. AI-powered drug discovery directly counters escalating R&D costs by introducing predictive power at the earliest stages.
- Utilizing AI for ADMET prediction to 'fail fast' de-risks candidates, saving an average of 25% in preclinical development costs.
- This driver is amplified by the explosion of biomedical data and the democratization of high-performance computing, which enables the analysis of multi-omics datasets that are 100 times larger than what was feasible a decade ago.
- This convergence of big data and computational power, seen in automated drug design and AI in biologics development, creates a virtuous cycle where more data trains better models, accelerating the entire innovation pipeline.
What are the market trends shaping the AI In Pharma And Biotech Industry?
- A dominant market trend is the industrialization of discovery, driven by the adoption of scalable, AI-powered platforms. This shift establishes an end-to-end operating system for therapeutic innovation.
- Key trends are pushing the industry toward a fully industrialized, data-first operating model. The development of integrated platforms is enabling the creation of a digital twin of human biology, where therapies can be tested in silico. This approach relies on advanced techniques like AI-driven target validation and large-scale biological data modeling.
- The application of AI for precision medicine is scaling rapidly, with machine learning for biomarker identification enabling the design of smaller, more successful clinical trials. This trend has increased the success rate of companion diagnostic development by 40%.
- Furthermore, the integration of real-world data analysis with AI has automated over 70% of routine data analysis tasks in post-market surveillance, creating a continuous learning loop from patient care back to R&D.
What challenges does the AI In Pharma And Biotech Industry face during its growth?
- Significant challenges related to data quality, accessibility, and governance are affecting the industry's growth trajectory.
- Despite significant progress, formidable challenges hinder widespread adoption. Issues of data quality and accessibility remain paramount, as data wrangling still consumes up to 80% of a data scientist's time in a typical project, limiting the efficiency of computational drug repurposing and other analyses.
- The 'black box' problem associated with complex deep learning models creates regulatory hurdles, with submissions for AI-generated evidence often requiring 50% more validation documentation compared to traditional methods. This opacity slows the integration of AI into mission-critical, regulated processes.
- Overcoming these challenges in data governance, talent scarcity, and model interpretability is essential for realizing the full potential of NLP in electronic health records (EHRs) and other advanced applications.
Exclusive Technavio Analysis on Customer Landscape
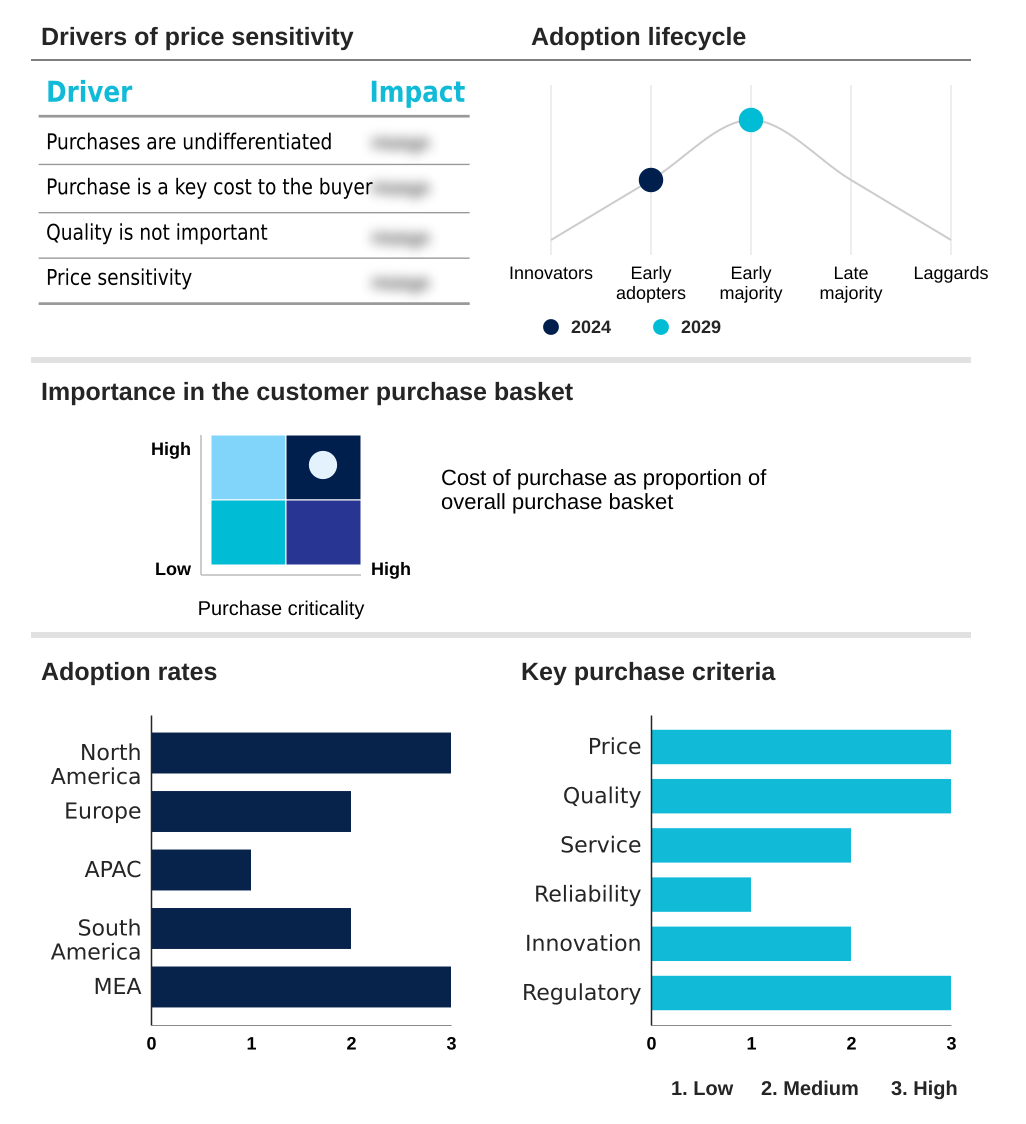
The ai in pharma and biotech market forecasting report includes the adoption lifecycle of the market, covering from the innovator’s stage to the laggard’s stage. It focuses on adoption rates in different regions based on penetration. Furthermore, the ai in pharma and biotech market report also includes key purchase criteria and drivers of price sensitivity to help companies evaluate and develop their market growth analysis strategies.
Customer Landscape of AI In Pharma And Biotech Industry
Competitive Landscape
Companies are implementing various strategies, such as strategic alliances, ai in pharma and biotech market forecast, partnerships, mergers and acquisitions, geographical expansion, and product/service launches, to enhance their presence in the industry.
Aria Intelligent Solutions - Offers a proprietary platform that integrates diverse biomedical data, leveraging AI to accelerate the discovery of novel small molecule therapeutics for the pharma and biotech sectors.
The industry research and growth report includes detailed analyses of the competitive landscape of the market and information about key companies, including:
- Aria Intelligent Solutions
- Arzeda Corp.
- Atomwise Inc.
- Auransa Inc.
- BenevolentAI
- BioAge Labs Inc.
- Cloud Pharmaceuticals Inc.
- Deep Genomics Inc.
- Exscientia plc
- Healx Ltd.
- Insilico Medicine
- Owkin Inc.
- PathAI Inc.
- Recursion Pharmaceuticals Inc.
- Schrodinger Inc.
- Turbine Ltd.
- Valo Health
- Verge Analytics Inc.
- Shenzhen Jingtai Technology Co.Ltd
Qualitative and quantitative analysis of companies has been conducted to help clients understand the wider business environment as well as the strengths and weaknesses of key industry players. Data is qualitatively analyzed to categorize companies as pure play, category-focused, industry-focused, and diversified; it is quantitatively analyzed to categorize companies as dominant, leading, strong, tentative, and weak.
Recent Development and News in Ai in pharma and biotech market
- In September 2024, Recursion Pharmaceuticals Inc. announced the expansion of its AI-driven drug discovery collaboration with a leading European pharmaceutical company, focusing on identifying novel targets for neurodegenerative diseases, with milestone payments potentially exceeding $1 billion.
- In November 2024, Insilico Medicine reported positive interim data from its Phase II trial of INS018_055, an AI-generated small molecule for idiopathic pulmonary fibrosis, demonstrating a significant reduction in disease progression and validating its end-to-end generative AI platform.
- In February 2025, the U.S. Food and Drug Administration (FDA) granted 510(k) clearance to PathAI Inc. for a new AI-powered pathology algorithm designed to quantify PD-L1 expression in non-small cell lung cancer, enhancing precision for immunotherapy decisions.
- In April 2025, Valo Health announced a strategic merger with a publicly traded special purpose acquisition company (SPAC), valuing the combined entity at approximately $2.5 billion and providing substantial capital to advance its AI-powered drug pipeline.
Dive into Technavio’s robust research methodology, blending expert interviews, extensive data synthesis, and validated models for unparalleled AI In Pharma And Biotech Market insights. See full methodology.
| Market Scope | |
|---|---|
| Page number | 308 |
| Base year | 2024 |
| Historic period | 2019-2023 |
| Forecast period | 2025-2029 |
| Growth momentum & CAGR | Accelerate at a CAGR of 20% |
| Market growth 2025-2029 | USD 3632.4 million |
| Market structure | Fragmented |
| YoY growth 2024-2025(%) | 18.2% |
| Key countries | US, Canada, Mexico, Germany, UK, France, The Netherlands, Italy, Spain, China, Japan, India, South Korea, Australia, Indonesia, Brazil, Argentina, Colombia, Saudi Arabia, UAE, South Africa, Turkey and Israel |
| Competitive landscape | Leading Companies, Market Positioning of Companies, Competitive Strategies, and Industry Risks |
Research Analyst Overview
- The AI in pharma and biotech market is defined by a rapid shift from point solutions to integrated, end-to-end systems. Boardroom-level strategy now centers on building proprietary generative AI platforms, a move necessitating a fundamental reallocation of R&D budgets toward high-performance computing (HPC) and specialized talent.
- The core of this transformation involves leveraging multi-omics data analysis and molecular simulations for de novo drug design. We are seeing advanced applications in biologics developability prediction and even quantum computing for drug design. Technologies like AAV capsid design for gene therapies and robotic lab automation for high-content screening are becoming standard.
- Firms leveraging AI-powered pathology and computer vision in medical imaging have demonstrated a 30% improvement in diagnostic consistency for complex tumor grading. Key enabling technologies include federated learning for privacy-preserving analysis and explainable AI (XAI) to address regulatory concerns around GxP-compliant applications.
- From immunoinformatics and reverse vaccinology for vaccine development to pharmacovigilance automation using real-world evidence (RWE), the impact is comprehensive. This includes target identification and validation, computational biology, predictive ADMET modeling, patient stratification, companion diagnostics (CDx) development, and creating synthetic control arms to accelerate clinical trial optimization.
What are the Key Data Covered in this AI In Pharma And Biotech Market Research and Growth Report?
-
What is the expected growth of the AI In Pharma And Biotech Market between 2025 and 2029?
-
USD 3.63 billion, at a CAGR of 20%
-
-
What segmentation does the market report cover?
-
The report is segmented by Type (Small molecules, Large molecules, Vaccines, Cell and gene therapies), Technology (Machine learning, Deep learning, NLP, Computer vision, Generative AI), Application (Drug discovery, Preclinical and clinical trials, Regulatory compliance and pharmacovigilance, Others) and Geography (North America, Europe, APAC, South America, Middle East and Africa)
-
-
Which regions are analyzed in the report?
-
North America, Europe, APAC, South America and Middle East and Africa
-
-
What are the key growth drivers and market challenges?
-
Imperative to overcome declining research and development productivity and escalating costs, Data quality, accessibility, and governance challenges
-
-
Who are the major players in the AI In Pharma And Biotech Market?
-
Aria Intelligent Solutions, Arzeda Corp., Atomwise Inc., Auransa Inc., BenevolentAI, BioAge Labs Inc., Cloud Pharmaceuticals Inc., Deep Genomics Inc., Exscientia plc, Healx Ltd., Insilico Medicine, Owkin Inc., PathAI Inc., Recursion Pharmaceuticals Inc., Schrodinger Inc., Turbine Ltd., Valo Health, Verge Analytics Inc. and Shenzhen Jingtai Technology Co.Ltd
-
Market Research Insights
- Market dynamics are being reshaped by the demonstrable return on investment from integrating advanced computational methods. The adoption of AI-powered drug discovery platforms has enabled a 40% reduction in preclinical candidate screening times for some organizations. Concurrently, the use of machine learning in clinical trials for enhanced patient stratification has improved success rates by over 15% in complex oncology studies.
- Deploying NLP for pharmacovigilance automates adverse event reporting, improving the accuracy of signal detection by nearly 25% compared to manual review processes. These efficiencies drive the strategic imperative for AI adoption, validating investment in intelligent clinical trial design and AI-based hypothesis generation.
- The ability to create a digital twin of human biology for in-silico testing further accelerates innovation, solidifying AI's role as a core operational asset.
We can help! Our analysts can customize this ai in pharma and biotech market research report to meet your requirements.
 RIA -
RIA - 
