Airport Non-aeronautical Revenue Market Analysis, Size, and Forecast 2026-2030: APAC (China, Japan, and India), North America (US, Canada, and Mexico), Europe (UK, Germany, and France), Middle East and Africa (UAE, Saudi Arabia, and South Africa), South America (Brazil, Argentina, and Colombia), and Rest of World (ROW)

Airport Non-aeronautical Revenue Market Analysis, Size, and Forecast 2026-2030:
APAC (China, Japan, and India), North America (US, Canada, and Mexico), Europe (UK, Germany, and France), Middle East and Africa (UAE, Saudi Arabia, and South Africa), South America (Brazil, Argentina, and Colombia), and Rest of World (ROW)

Published: Mar 2026 299 Pages SKU: IRTNTR43095

Market Overview at a Glance

$48.01 B
Market Opportunity
8.5%
CAGR 2025 - 2030
28.4%
North America Growth
$28.54 B
Concessionaries segment 2024

Airport Non-aeronautical Revenue Market Size 2026-2030

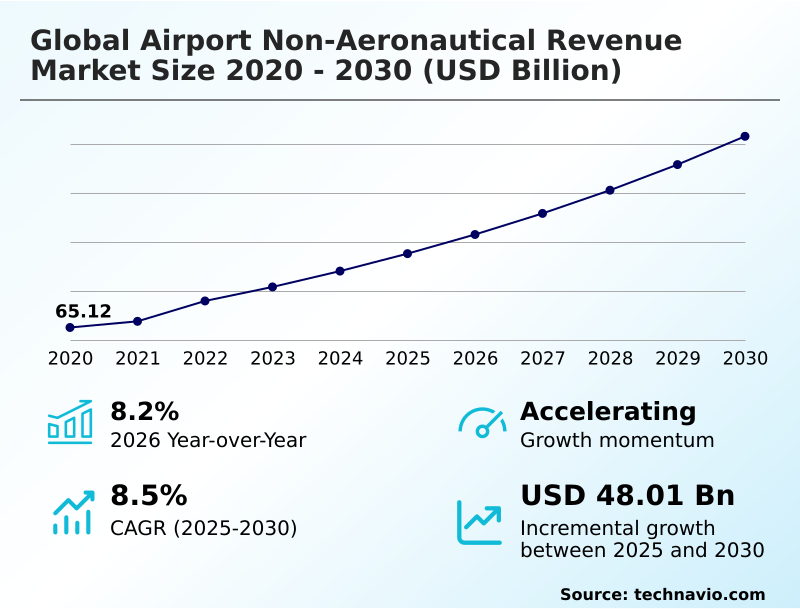
The airport non-aeronautical revenue market size is valued to increase by USD 48.01 billion, at a CAGR of 8.5% from 2025 to 2030. Rising passenger traffic and global connectivity will drive the airport non-aeronautical revenue market.

Major Market Trends & Insights

  • North America dominated the market and accounted for a 28.4% growth during the forecast period.
  • By Service - Concessionaries segment was valued at USD 28.54 billion in 2024
  • By Business Segment - Commercial development segment accounted for the largest market revenue share in 2024

Market Size & Forecast

  • Market Opportunities: USD 78.21 billion
  • Market Future Opportunities: USD 48.01 billion
  • CAGR from 2025 to 2030 : 8.5%

Market Summary

  • The airport non-aeronautical revenue market is undergoing a fundamental transformation, evolving from a focus on operational efficiency to a strategy centered on commercial optimization. This shift is propelled by the need to diversify income beyond traditional aviation charges. Key drivers include rising global passenger volumes and the strategic premiumization of services, which turns terminals into destinations.
  • Trends such as digitalization are reshaping the passenger experience, with operators leveraging data analytics and omnichannel platforms to enhance engagement and capture greater spend. For instance, an operator facing declining discretionary purchases might use real-time analytics to adjust its retail mix and launch targeted promotions for food and beverage outlets, protecting concession revenue.
  • However, the market faces challenges from economic volatility impacting consumer spending and the high capital investment required for digital transformation. Success hinges on creating a seamless, high-value commercial environment that maximizes revenue from every stage of the passenger journey, from smart parking systems to experiential duty-free retail.

What will be the Size of the Airport Non-aeronautical Revenue Market during the forecast period?

Get Key Insights on Market Forecast (PDF) Request Free Sample

How is the Airport Non-aeronautical Revenue Market Segmented?

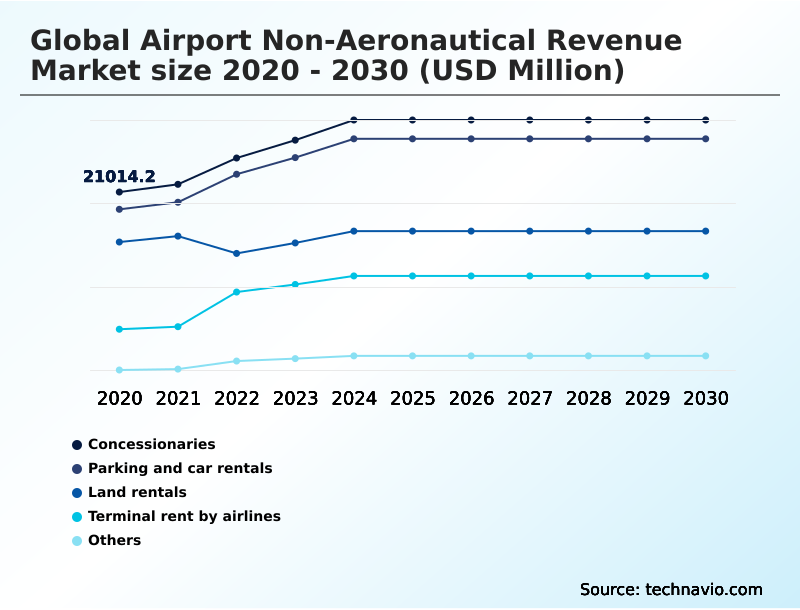
The airport non-aeronautical revenue industry research report provides comprehensive data (region-wise segment analysis), with forecasts and estimates in "USD million" for the period 2026-2030, as well as historical data from 2020-2024 for the following segments.

  • Service
    • Concessionaries
    • Parking and car rentals
    • Land rentals
    • Terminal rent by airlines
    • Others
  • Business segment
    • Commercial development
    • Advertising
  • Type
    • Large airports
    • Medium airports
    • Small airports
  • Geography
    • APAC
      • China
      • Japan
      • India
    • North America
      • US
      • Canada
      • Mexico
    • Europe
      • UK
      • Germany
      • France
    • Middle East and Africa
      • UAE
      • Saudi Arabia
      • South Africa
    • South America
      • Brazil
      • Argentina
      • Colombia
    • Rest of World (ROW)

By Service Insights

The concessionaries segment is estimated to witness significant growth during the forecast period.

The concessionaries segment is central to airport commercial management, generating substantial income from duty-free retail and food and beverage concessions.

A successful premiumization strategy is key to maximizing airport retail, with a focus on experiential luxury to enhance the passenger-centric retail journey.

This approach significantly boosts non-aviation revenue growth, with some operators reporting a 31% surge in income from premium airport hospitality services alone.

Such performance, which maximizes passenger dwell time monetization, underscores the segment's critical role in overall airport financial performance, demonstrating a clear shift from transit functionality to comprehensive commercial destination.

Request Free Sample

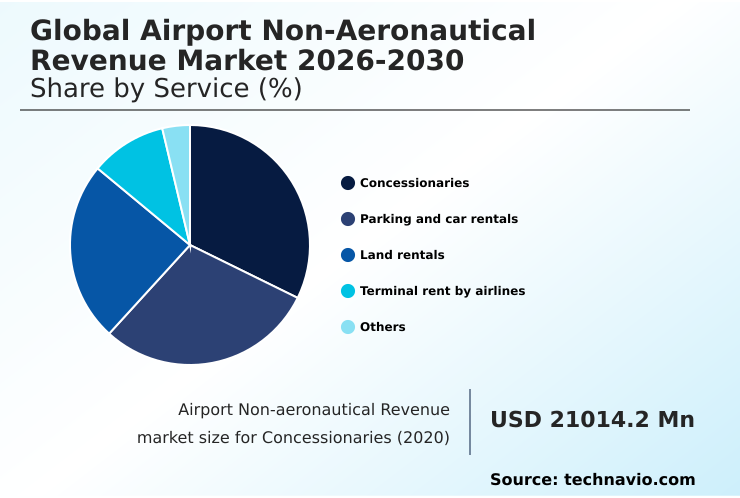
The Concessionaries segment was valued at USD 28.54 billion in 2024 and showed a gradual increase during the forecast period.

Request Free Sample

Regional Analysis

North America is estimated to contribute 28.4% to the growth of the global market during the forecast period.Technavio’s analysts have elaborately explained the regional trends and drivers that shape the market during the forecast period.

See How Airport Non-aeronautical Revenue Market Demand is Rising in North America Request Free Sample

The geographic landscape is dynamic, with North America leading incremental growth, projected to contribute over 28% of the total, driven by modernization and the optimization of smart parking systems.

APAC follows closely, accounting for nearly 28% of the opportunity, fueled by demand for premium airside retail and robust real estate leasing activities.

Operators in Europe focus on maximizing ancillary revenue streams by securing strong airport concession agreements for high-value retail. In the Middle East, the focus on premium services is boosting VIP services income.

Across all regions, optimizing terminal space and enhancing airport ancillary services through effective airport parking management are critical strategies for growth.

Market Dynamics

Our researchers analyzed the data with 2025 as the base year, along with the key drivers, trends, and challenges. A holistic analysis of drivers will help companies refine their marketing strategies to gain a competitive advantage.

  • Operators are now focused on holistic strategies for increasing non-aeronautical revenue, moving beyond isolated initiatives. The impact of e-commerce on airport retail has forced a re-evaluation of in-terminal sales, highlighting the critical role of technology in airport commercial services. To compete, airports are integrating digital platforms for passenger shopping, which enhances the customer experience and provides valuable data.
  • The roi of digital transformation in airports is becoming clearer, as leveraging big data for airport retail personalization can lift conversion rates by double-digit percentages, far exceeding gains from traditional promotions. This focus extends to premiumization trends in airport lounges and optimizing food and beverage offerings in terminals.
  • Concurrently, the long-term airport city and aerotropolis model benefits are being realized through the future of airport real estate development and maximizing advertising income in airports. However, challenges in managing airport concession contracts persist. Evaluating commercial performance of airport terminals now requires sophisticated non-aeronautical revenue per passenger metrics.
  • This includes addressing the impact of ride-sharing on airport ground transport revenue and exploring how to improve airport parking revenue through smart, convenient solutions. The emphasis on sustainability in airport commercial operations is also influencing decisions, as the customer experience impact on non-aeronautical spend becomes a key performance indicator.

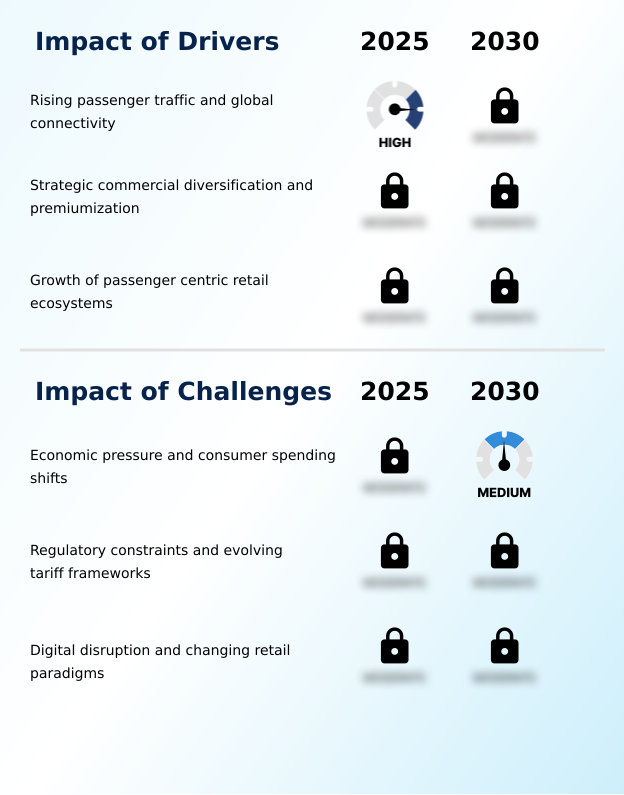
What are the key market drivers leading to the rise in the adoption of Airport Non-aeronautical Revenue Industry?

  • Sustained growth in passenger traffic, coupled with expanding global connectivity, serves as the primary driver for the market.

  • Sustained growth in passenger volumes is a primary driver, directly increasing non-aeronautical income sources and opportunities for passenger dwell time monetization. This allows for greater airport commercial development and commercial portfolio diversification.
  • Operators are leveraging traffic to increase concession revenue and overall passenger spend through enhanced offerings. For example, a 3.4% rise in passenger movements can directly support initiatives for improving passenger spend.
  • Furthermore, a focus on premium services like lounge access monetization can yield disproportionate returns, with some operators seeing a 31% income surge in this area alone. Advanced airport retail analytics are crucial for identifying and capitalizing on these high-margin opportunities.

What are the market trends shaping the Airport Non-aeronautical Revenue Industry?

  • A key market trend is the expansion of the airport city and aerotropolis model. This strategic development transforms airports into self-sustaining economic zones with integrated commercial functions.

  • Key market trends include the expansion of the aerotropolis development model and the adoption of omnichannel retail. The airport city concept is evolving through strategic airport real estate strategy, transforming airport land into integrated airport business parks. Simultaneously, the digital airport experience is being redefined with digital commerce platforms that enable click-and-collect services, improving passenger journey mapping and convenience.
  • The success of this integrated approach is evident, with some new retail concepts driving segment revenue up by over 12%. Effective airport retail design and strong airport concession agreements are foundational to capitalizing on these shifts.

What challenges does the Airport Non-aeronautical Revenue Industry face during its growth?

  • Economic pressures and related shifts in consumer spending behavior present a key challenge to the industry's growth trajectory.

  • Economic volatility poses a significant challenge, impacting discretionary spending on landside services and in-terminal purchases, which affects non-flight related income. Operators face pressure on ground transportation fees and car rental concessions from new mobility solutions. The digital shift challenges traditional airport advertising models, with some hubs seeing retail revenue grow by only 2.5% while noting weakness in legacy advertising.
  • This necessitates new terminal commercial planning and innovative airport services to maintain the value of terminal real estate. For commercial airport operations to remain profitable, they must adapt to these pressures on key streams like advertising revenue.

Exclusive Technavio Analysis on Customer Landscape

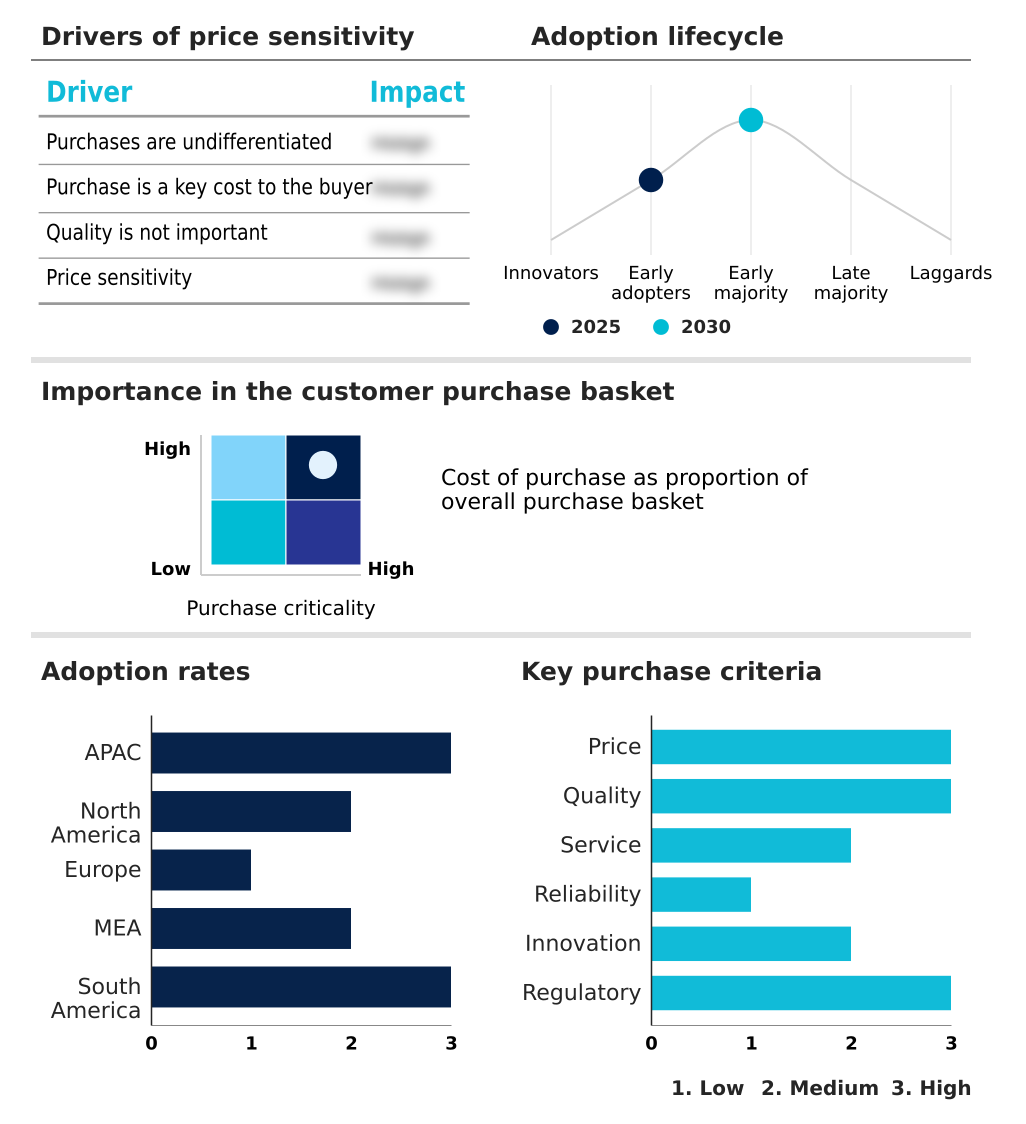
The airport non-aeronautical revenue market forecasting report includes the adoption lifecycle of the market, covering from the innovator’s stage to the laggard’s stage. It focuses on adoption rates in different regions based on penetration. Furthermore, the airport non-aeronautical revenue market report also includes key purchase criteria and drivers of price sensitivity to help companies evaluate and develop their market growth analysis strategies.

Customer Landscape of Airport Non-aeronautical Revenue Industry

Competitive Landscape

Companies are implementing various strategies, such as strategic alliances, airport non-aeronautical revenue market forecast, partnerships, mergers and acquisitions, geographical expansion, and product/service launches, to enhance their presence in the industry.

Aena S.M.E. SA - Offers a diversified portfolio of non-aeronautical revenue streams, including premier duty-free retail and integrated commercial services to enhance airport profitability and passenger experience.

The industry research and growth report includes detailed analyses of the competitive landscape of the market and information about key companies, including:

  • Aena S.M.E. SA
  • Aeroports de Paris SA
  • Airports of Thailand PCL
  • Changi Airport Group Pte. Ltd.
  • Copenhagen Airports AS
  • Dubai Airports Co.
  • Flughafen Munchen GmbH
  • Flughafen Zurich AG
  • Fraport AG
  • GMR Airports Infrastructure Ltd.
  • Heathrow Airport Holdings Ltd.
  • IGA Istanbul Airport
  • Japan Airport Terminal Co. Ltd.
  • Korea Airports Corp.
  • Malaysia Airports Holdings
  • Royal Schiphol Group N.V.
  • Sydney Airport Corp. Ltd.
  • Vancouver Airport Authority
  • Vinci SA

Qualitative and quantitative analysis of companies has been conducted to help clients understand the wider business environment as well as the strengths and weaknesses of key industry players. Data is qualitatively analyzed to categorize companies as pure play, category-focused, industry-focused, and diversified; it is quantitatively analyzed to categorize companies as dominant, leading, strong, tentative, and weak.

Recent Development and News in Airport non-aeronautical revenue market

  • In August 2025, Corporacion America Airports reported its consolidated revenues for the second quarter grew 18.9%, driven by a 22% rise in commercial revenues that outpaced aeronautical segment growth.
  • In July 2025, GMR Airports concluded the acquisition of a 70% stake in a logistics park entity to strengthen its airport-based industrial and warehousing portfolio as part of its aerotropolis strategy.
  • In May 2025, GMR Airports reported a consolidated loss for the fourth quarter of its 2024 fiscal year, citing that a delayed tariff order from the regulatory authority significantly impacted its financial performance.
  • In March 2025, Changi Airport Group reported that its concession revenue growth remained subdued despite reaching a record 68.4 million passenger movements, citing global economic uncertainties impacting consumer spending.

Dive into Technavio’s robust research methodology, blending expert interviews, extensive data synthesis, and validated models for unparalleled Airport Non-aeronautical Revenue Market insights. See full methodology.

Market Scope
Page number 299
Base year 2025
Historic period 2020-2024
Forecast period 2026-2030
Growth momentum & CAGR Accelerate at a CAGR of 8.5%
Market growth 2026-2030 USD 48005.8 million
Market structure Fragmented
YoY growth 2025-2026(%) 8.2%
Key countries China, Japan, India, Australia, Singapore, Indonesia, US, Canada, Mexico, UK, Germany, France, Spain, Italy, The Netherlands, UAE, Saudi Arabia, Qatar, South Africa, Egypt, Brazil, Argentina and Colombia
Competitive landscape Leading Companies, Market Positioning of Companies, Competitive Strategies, and Industry Risks

Request Free Sample

Research Analyst Overview

  • The strategic importance of non-aeronautical revenue has intensified, compelling a shift toward comprehensive commercial portfolio diversification. Operators are focused on maximizing income from every asset, including terminal real estate and landside services. The premiumization strategy is central, involving investments in experiential luxury offerings to generate VIP services income.
  • A key area is optimizing airside retail, particularly duty-free retail and food and beverage concessions, where one operator recently achieved a 23% revenue rise. The airport city concept and broader aerotropolis development are gaining traction, supported by real estate leasing. Digital transformation is also critical, enabling omnichannel retail through digital commerce platforms and facilitating click-and-collect services.
  • This extends to operations, with smart parking systems enhancing revenue from ground transportation fees and car rental concessions. Ultimately, these ancillary revenue streams, including advertising revenue and lounge access monetization, are vital for increasing overall passenger spend and creating a passenger-centric retail environment.

What are the Key Data Covered in this Airport Non-aeronautical Revenue Market Research and Growth Report?

  • What is the expected growth of the Airport Non-aeronautical Revenue Market between 2026 and 2030?

    • USD 48.01 billion, at a CAGR of 8.5%

  • What segmentation does the market report cover?

    • The report is segmented by Service (Concessionaries, Parking and car rentals, Land rentals, Terminal rent by airlines, and Others), Business Segment (Commercial development, and Advertising), Type (Large airports, Medium airports, and Small airports) and Geography (APAC, North America, Europe, Middle East and Africa, South America)

  • Which regions are analyzed in the report?

    • APAC, North America, Europe, Middle East and Africa and South America

  • What are the key growth drivers and market challenges?

    • Rising passenger traffic and global connectivity, Economic pressure and consumer spending shifts

  • Who are the major players in the Airport Non-aeronautical Revenue Market?

    • Aena S.M.E. SA, Aeroports de Paris SA, Airports of Thailand PCL, Changi Airport Group Pte. Ltd., Copenhagen Airports AS, Dubai Airports Co., Flughafen Munchen GmbH, Flughafen Zurich AG, Fraport AG, GMR Airports Infrastructure Ltd., Heathrow Airport Holdings Ltd., IGA Istanbul Airport, Japan Airport Terminal Co. Ltd., Korea Airports Corp., Malaysia Airports Holdings, Royal Schiphol Group N.V., Sydney Airport Corp. Ltd., Vancouver Airport Authority and Vinci SA

Market Research Insights

  • The market's dynamics are shifting toward airport commercial development, with operators focusing on innovative airport services to drive profitability. Strategic airport commercial planning is essential, as some operators achieve commercial revenue growth of 11% that significantly outpaces passenger traffic increases. Success in non-aviation revenue growth is increasingly tied to optimizing terminal space and enhancing the digital airport experience.
  • For instance, a focus on premium services can lead to a 31% surge in income from that segment, demonstrating the high ROI of targeted airport hospitality services. This data-driven approach to passenger journey mapping and improving passenger spend is central to maintaining financial resilience.

We can help! Our analysts can customize this airport non-aeronautical revenue market research report to meet your requirements.

Get in touch

1. Executive Summary

1.1 Market overview

Executive Summary - Chart on Market Overview
Executive Summary - Data Table on Market Overview
Executive Summary - Chart on Global Market Characteristics
Executive Summary - Chart on Market by Geography
Executive Summary - Chart on Market Segmentation by Service
Executive Summary - Chart on Market Segmentation by Business Segment
Executive Summary - Chart on Market Segmentation by Type
Executive Summary - Chart on Incremental Growth
Executive Summary - Data Table on Incremental Growth
Executive Summary - Chart on Company Market Positioning

2. Technavio Analysis

2.1 Analysis of price sensitivity, lifecycle, customer purchase basket, adoption rates, and purchase criteria

2.2 Criticality of inputs and Factors of differentiation

Chart on Overview on criticality of inputs and factors of differentiation

2.3 Factors of disruption

Chart on Overview on factors of disruption

2.4 Impact of drivers and challenges

Chart on Impact of drivers and challenges in 2025 and 2030

3. Market Landscape

3.1 Market ecosystem

Chart on Parent Market
Data Table on - Parent Market

3.2 Market characteristics

Chart on Market characteristics analysis

3.3 Value chain analysis

Chart on Value chain analysis

4. Market Sizing

4.1 Market definition

Data Table on Offerings of companies included in the market definition

4.2 Market segment analysis

Market segments

4.3 Market size 2025

4.4 Market outlook: Forecast for 2025-2030

Chart on Global - Market size and forecast 2025-2030 ($ million)
Data Table on Global - Market size and forecast 2025-2030 ($ million)
Chart on Global Market: Year-over-year growth 2025-2030 (%)
Data Table on Global Market: Year-over-year growth 2025-2030 (%)

5. Historic Market Size

5.1 Global Airport Non-Aeronautical Revenue Market 2020 - 2024

Historic Market Size - Data Table on Global Airport Non-Aeronautical Revenue Market 2020 - 2024 ($ million)

5.2 Service segment analysis 2020 - 2024

Historic Market Size - Service Segment 2020 - 2024 ($ million)

5.3 Business segment analysis 2020 - 2024

Historic Market Size - Business Segment 2020 - 2024 ($ million)

5.4 Type segment analysis 2020 - 2024

Historic Market Size - Type Segment 2020 - 2024 ($ million)

5.5 Geography segment analysis 2020 - 2024

Historic Market Size - Geography Segment 2020 - 2024 ($ million)

5.6 Country segment analysis 2020 - 2024

Historic Market Size - Country Segment 2020 - 2024 ($ million)

6. Qualitative Analysis

6.1 Impact of AI on the Global Airport Non-Aeronautical Revenue Market

6.2 Impact of geopolitical conflicts on Global Airport Non-Aeronautical Revenue Market

7. Five Forces Analysis

7.1 Five forces summary

Five forces analysis - Comparison between 2025 and 2030

7.2 Bargaining power of buyers

Bargaining power of buyers - Impact of key factors 2025 and 2030

7.3 Bargaining power of suppliers

Bargaining power of suppliers - Impact of key factors in 2025 and 2030

7.4 Threat of new entrants

Threat of new entrants - Impact of key factors in 2025 and 2030

7.5 Threat of substitutes

Threat of substitutes - Impact of key factors in 2025 and 2030

7.6 Threat of rivalry

Threat of rivalry - Impact of key factors in 2025 and 2030

7.7 Market condition

Chart on Market condition - Five forces 2025 and 2030

8. Market Segmentation by Service

8.1 Market segments

Chart on Service - Market share 2025-2030 (%)
Data Table on Service - Market share 2025-2030 (%)

8.2 Comparison by Service

Chart on Comparison by Service
Data Table on Comparison by Service

8.3 Concessionaries - Market size and forecast 2025-2030

Chart on Concessionaries - Market size and forecast 2025-2030 ($ million)
Data Table on Concessionaries - Market size and forecast 2025-2030 ($ million)
Chart on Concessionaries - Year-over-year growth 2025-2030 (%)
Data Table on Concessionaries - Year-over-year growth 2025-2030 (%)

8.4 Parking and car rentals - Market size and forecast 2025-2030

Chart on Parking and car rentals - Market size and forecast 2025-2030 ($ million)
Data Table on Parking and car rentals - Market size and forecast 2025-2030 ($ million)
Chart on Parking and car rentals - Year-over-year growth 2025-2030 (%)
Data Table on Parking and car rentals - Year-over-year growth 2025-2030 (%)

8.5 Land rentals - Market size and forecast 2025-2030

Chart on Land rentals - Market size and forecast 2025-2030 ($ million)
Data Table on Land rentals - Market size and forecast 2025-2030 ($ million)
Chart on Land rentals - Year-over-year growth 2025-2030 (%)
Data Table on Land rentals - Year-over-year growth 2025-2030 (%)

8.6 Terminal rent by airlines - Market size and forecast 2025-2030

Chart on Terminal rent by airlines - Market size and forecast 2025-2030 ($ million)
Data Table on Terminal rent by airlines - Market size and forecast 2025-2030 ($ million)
Chart on Terminal rent by airlines - Year-over-year growth 2025-2030 (%)
Data Table on Terminal rent by airlines - Year-over-year growth 2025-2030 (%)

8.7 Others - Market size and forecast 2025-2030

Chart on Others - Market size and forecast 2025-2030 ($ million)
Data Table on Others - Market size and forecast 2025-2030 ($ million)
Chart on Others - Year-over-year growth 2025-2030 (%)
Data Table on Others - Year-over-year growth 2025-2030 (%)

8.8 Market opportunity by Service

Market opportunity by Service ($ million)
Data Table on Market opportunity by Service ($ million)

9. Market Segmentation by Business Segment

9.1 Market segments

Chart on Market Segmentation by Business Segment - Market share 2025-2030 (%)
Data Table on Market Segmentation by Business Segment - Market share 2025-2030 (%)

9.2 Comparison by Market Segmentation by Business Segment

Chart on Comparison by Market Segmentation by Business Segment
Data Table on Comparison by Market Segmentation by Business Segment

9.3 Commercial development - Market size and forecast 2025-2030

Chart on Commercial development - Market size and forecast 2025-2030 ($ million)
Data Table on Commercial development - Market size and forecast 2025-2030 ($ million)
Chart on Commercial development - Year-over-year growth 2025-2030 (%)
Data Table on Commercial development - Year-over-year growth 2025-2030 (%)

9.4 Advertising - Market size and forecast 2025-2030

Chart on Advertising - Market size and forecast 2025-2030 ($ million)
Data Table on Advertising - Market size and forecast 2025-2030 ($ million)
Chart on Advertising - Year-over-year growth 2025-2030 (%)
Data Table on Advertising - Year-over-year growth 2025-2030 (%)

9.5 Market opportunity by Market Segmentation by Business Segment

Market opportunity by Market Segmentation by Business Segment ($ million)
Data Table on Market opportunity by Market Segmentation by Business Segment ($ million)

10. Market Segmentation by Type

10.1 Market segments

Chart on Type - Market share 2025-2030 (%)
Data Table on Type - Market share 2025-2030 (%)

10.2 Comparison by Type

Chart on Comparison by Type
Data Table on Comparison by Type

10.3 Large airports - Market size and forecast 2025-2030

Chart on Large airports - Market size and forecast 2025-2030 ($ million)
Data Table on Large airports - Market size and forecast 2025-2030 ($ million)
Chart on Large airports - Year-over-year growth 2025-2030 (%)
Data Table on Large airports - Year-over-year growth 2025-2030 (%)

10.4 Medium airports - Market size and forecast 2025-2030

Chart on Medium airports - Market size and forecast 2025-2030 ($ million)
Data Table on Medium airports - Market size and forecast 2025-2030 ($ million)
Chart on Medium airports - Year-over-year growth 2025-2030 (%)
Data Table on Medium airports - Year-over-year growth 2025-2030 (%)

10.5 Small airports - Market size and forecast 2025-2030

Chart on Small airports - Market size and forecast 2025-2030 ($ million)
Data Table on Small airports - Market size and forecast 2025-2030 ($ million)
Chart on Small airports - Year-over-year growth 2025-2030 (%)
Data Table on Small airports - Year-over-year growth 2025-2030 (%)

10.6 Market opportunity by Type

Market opportunity by Type ($ million)
Data Table on Market opportunity by Type ($ million)

11. Customer Landscape

11.1 Customer landscape overview

Analysis of price sensitivity, lifecycle, customer purchase basket, adoption rates, and purchase criteria

12. Geographic Landscape

12.1 Geographic segmentation

Chart on Market share by geography 2025-2030 (%)
Data Table on Market share by geography 2025-2030 (%)

12.2 Geographic comparison

Chart on Geographic comparison
Data Table on Geographic comparison

12.3 APAC - Market size and forecast 2025-2030

Chart on APAC - Market size and forecast 2025-2030 ($ million)
Data Table on APAC - Market size and forecast 2025-2030 ($ million)
Chart on APAC - Year-over-year growth 2025-2030 (%)
Data Table on APAC - Year-over-year growth 2025-2030 (%)
Chart on Regional Comparison - APAC
Data Table on Regional Comparison - APAC

12.3.1 China - Market size and forecast 2025-2030

Chart on China - Market size and forecast 2025-2030 ($ million)
Data Table on China - Market size and forecast 2025-2030 ($ million)
Chart on China - Year-over-year growth 2025-2030 (%)
Data Table on China - Year-over-year growth 2025-2030 (%)

12.3.2 Japan - Market size and forecast 2025-2030

Chart on Japan - Market size and forecast 2025-2030 ($ million)
Data Table on Japan - Market size and forecast 2025-2030 ($ million)
Chart on Japan - Year-over-year growth 2025-2030 (%)
Data Table on Japan - Year-over-year growth 2025-2030 (%)

12.3.3 India - Market size and forecast 2025-2030

Chart on India - Market size and forecast 2025-2030 ($ million)
Data Table on India - Market size and forecast 2025-2030 ($ million)
Chart on India - Year-over-year growth 2025-2030 (%)
Data Table on India - Year-over-year growth 2025-2030 (%)

12.3.4 Australia - Market size and forecast 2025-2030

Chart on Australia - Market size and forecast 2025-2030 ($ million)
Data Table on Australia - Market size and forecast 2025-2030 ($ million)
Chart on Australia - Year-over-year growth 2025-2030 (%)
Data Table on Australia - Year-over-year growth 2025-2030 (%)

12.3.5 Singapore - Market size and forecast 2025-2030

Chart on Singapore - Market size and forecast 2025-2030 ($ million)
Data Table on Singapore - Market size and forecast 2025-2030 ($ million)
Chart on Singapore - Year-over-year growth 2025-2030 (%)
Data Table on Singapore - Year-over-year growth 2025-2030 (%)

12.3.6 Indonesia - Market size and forecast 2025-2030

Chart on Indonesia - Market size and forecast 2025-2030 ($ million)
Data Table on Indonesia - Market size and forecast 2025-2030 ($ million)
Chart on Indonesia - Year-over-year growth 2025-2030 (%)
Data Table on Indonesia - Year-over-year growth 2025-2030 (%)

12.4 North America - Market size and forecast 2025-2030

Chart on North America - Market size and forecast 2025-2030 ($ million)
Data Table on North America - Market size and forecast 2025-2030 ($ million)
Chart on North America - Year-over-year growth 2025-2030 (%)
Data Table on North America - Year-over-year growth 2025-2030 (%)
Chart on Regional Comparison - North America
Data Table on Regional Comparison - North America

12.4.1 US - Market size and forecast 2025-2030

Chart on US - Market size and forecast 2025-2030 ($ million)
Data Table on US - Market size and forecast 2025-2030 ($ million)
Chart on US - Year-over-year growth 2025-2030 (%)
Data Table on US - Year-over-year growth 2025-2030 (%)

12.4.2 Canada - Market size and forecast 2025-2030

Chart on Canada - Market size and forecast 2025-2030 ($ million)
Data Table on Canada - Market size and forecast 2025-2030 ($ million)
Chart on Canada - Year-over-year growth 2025-2030 (%)
Data Table on Canada - Year-over-year growth 2025-2030 (%)

12.4.3 Mexico - Market size and forecast 2025-2030

Chart on Mexico - Market size and forecast 2025-2030 ($ million)
Data Table on Mexico - Market size and forecast 2025-2030 ($ million)
Chart on Mexico - Year-over-year growth 2025-2030 (%)
Data Table on Mexico - Year-over-year growth 2025-2030 (%)

12.5 Europe - Market size and forecast 2025-2030

Chart on Europe - Market size and forecast 2025-2030 ($ million)
Data Table on Europe - Market size and forecast 2025-2030 ($ million)
Chart on Europe - Year-over-year growth 2025-2030 (%)
Data Table on Europe - Year-over-year growth 2025-2030 (%)
Chart on Regional Comparison - Europe
Data Table on Regional Comparison - Europe

12.5.1 UK - Market size and forecast 2025-2030

Chart on UK - Market size and forecast 2025-2030 ($ million)
Data Table on UK - Market size and forecast 2025-2030 ($ million)
Chart on UK - Year-over-year growth 2025-2030 (%)
Data Table on UK - Year-over-year growth 2025-2030 (%)

12.5.2 Germany - Market size and forecast 2025-2030

Chart on Germany - Market size and forecast 2025-2030 ($ million)
Data Table on Germany - Market size and forecast 2025-2030 ($ million)
Chart on Germany - Year-over-year growth 2025-2030 (%)
Data Table on Germany - Year-over-year growth 2025-2030 (%)

12.5.3 France - Market size and forecast 2025-2030

Chart on France - Market size and forecast 2025-2030 ($ million)
Data Table on France - Market size and forecast 2025-2030 ($ million)
Chart on France - Year-over-year growth 2025-2030 (%)
Data Table on France - Year-over-year growth 2025-2030 (%)

12.5.4 Spain - Market size and forecast 2025-2030

Chart on Spain - Market size and forecast 2025-2030 ($ million)
Data Table on Spain - Market size and forecast 2025-2030 ($ million)
Chart on Spain - Year-over-year growth 2025-2030 (%)
Data Table on Spain - Year-over-year growth 2025-2030 (%)

12.5.5 Italy - Market size and forecast 2025-2030

Chart on Italy - Market size and forecast 2025-2030 ($ million)
Data Table on Italy - Market size and forecast 2025-2030 ($ million)
Chart on Italy - Year-over-year growth 2025-2030 (%)
Data Table on Italy - Year-over-year growth 2025-2030 (%)

12.5.6 The Netherlands - Market size and forecast 2025-2030

Chart on The Netherlands - Market size and forecast 2025-2030 ($ million)
Data Table on The Netherlands - Market size and forecast 2025-2030 ($ million)
Chart on The Netherlands - Year-over-year growth 2025-2030 (%)
Data Table on The Netherlands - Year-over-year growth 2025-2030 (%)

12.6 Middle East and Africa - Market size and forecast 2025-2030

Chart on Middle East and Africa - Market size and forecast 2025-2030 ($ million)
Data Table on Middle East and Africa - Market size and forecast 2025-2030 ($ million)
Chart on Middle East and Africa - Year-over-year growth 2025-2030 (%)
Data Table on Middle East and Africa - Year-over-year growth 2025-2030 (%)
Chart on Regional Comparison - Middle East and Africa
Data Table on Regional Comparison - Middle East and Africa

12.6.1 UAE - Market size and forecast 2025-2030

Chart on UAE - Market size and forecast 2025-2030 ($ million)
Data Table on UAE - Market size and forecast 2025-2030 ($ million)
Chart on UAE - Year-over-year growth 2025-2030 (%)
Data Table on UAE - Year-over-year growth 2025-2030 (%)

12.6.2 Saudi Arabia - Market size and forecast 2025-2030

Chart on Saudi Arabia - Market size and forecast 2025-2030 ($ million)
Data Table on Saudi Arabia - Market size and forecast 2025-2030 ($ million)
Chart on Saudi Arabia - Year-over-year growth 2025-2030 (%)
Data Table on Saudi Arabia - Year-over-year growth 2025-2030 (%)

12.6.3 Qatar - Market size and forecast 2025-2030

Chart on Qatar - Market size and forecast 2025-2030 ($ million)
Data Table on Qatar - Market size and forecast 2025-2030 ($ million)
Chart on Qatar - Year-over-year growth 2025-2030 (%)
Data Table on Qatar - Year-over-year growth 2025-2030 (%)

12.6.4 South Africa - Market size and forecast 2025-2030

Chart on South Africa - Market size and forecast 2025-2030 ($ million)
Data Table on South Africa - Market size and forecast 2025-2030 ($ million)
Chart on South Africa - Year-over-year growth 2025-2030 (%)
Data Table on South Africa - Year-over-year growth 2025-2030 (%)

12.6.5 Egypt - Market size and forecast 2025-2030

Chart on Egypt - Market size and forecast 2025-2030 ($ million)
Data Table on Egypt - Market size and forecast 2025-2030 ($ million)
Chart on Egypt - Year-over-year growth 2025-2030 (%)
Data Table on Egypt - Year-over-year growth 2025-2030 (%)

12.7 South America - Market size and forecast 2025-2030

Chart on South America - Market size and forecast 2025-2030 ($ million)
Data Table on South America - Market size and forecast 2025-2030 ($ million)
Chart on South America - Year-over-year growth 2025-2030 (%)
Data Table on South America - Year-over-year growth 2025-2030 (%)
Chart on Regional Comparison - South America
Data Table on Regional Comparison - South America

12.7.1 Brazil - Market size and forecast 2025-2030

Chart on Brazil - Market size and forecast 2025-2030 ($ million)
Data Table on Brazil - Market size and forecast 2025-2030 ($ million)
Chart on Brazil - Year-over-year growth 2025-2030 (%)
Data Table on Brazil - Year-over-year growth 2025-2030 (%)

12.7.2 Argentina - Market size and forecast 2025-2030

Chart on Argentina - Market size and forecast 2025-2030 ($ million)
Data Table on Argentina - Market size and forecast 2025-2030 ($ million)
Chart on Argentina - Year-over-year growth 2025-2030 (%)
Data Table on Argentina - Year-over-year growth 2025-2030 (%)

12.7.3 Colombia - Market size and forecast 2025-2030

Chart on Colombia - Market size and forecast 2025-2030 ($ million)
Data Table on Colombia - Market size and forecast 2025-2030 ($ million)
Chart on Colombia - Year-over-year growth 2025-2030 (%)
Data Table on Colombia - Year-over-year growth 2025-2030 (%)

12.8 Market opportunity by geography

Market opportunity by geography ($ million)
Data Tables on Market opportunity by geography ($ million)

13. Drivers, Challenges, and Opportunity

13.1 Market drivers

Rising passenger traffic and global connectivity
Strategic commercial diversification and premiumization
Growth of passenger centric retail ecosystems

13.2 Market challenges

Economic pressure and consumer spending shifts
Regulatory constraints and evolving tariff frameworks
Digital disruption and changing retail paradigms

13.3 Impact of drivers and challenges

Impact of drivers and challenges in 2025 and 2030

13.4 Market opportunities

Expansion of airport city and aerotropolis model
Integration of omnichannel retail and digital commerce platforms
Premiumization and rise of experiential luxury services

14. Competitive Landscape

14.1 Overview

14.2

Overview on criticality of inputs and factors of differentiation

14.3 Landscape disruption

Overview on factors of disruption

14.4 Industry risks

Impact of key risks on business

15. Competitive Analysis

15.1 Companies profiled

Companies covered

15.2 Company ranking index

15.3 Market positioning of companies

Matrix on companies position and classification

15.4 Aena S.M.E. SA

Aena S.M.E. SA - Overview
Aena S.M.E. SA - Business segments
Aena S.M.E. SA - Key offerings
Aena S.M.E. SA - Segment focus
SWOT

15.5 Aeroports de Paris SA

Aeroports de Paris SA - Overview
Aeroports de Paris SA - Business segments
Aeroports de Paris SA - Key offerings
Aeroports de Paris SA - Segment focus
SWOT

15.6 Airports of Thailand PCL

Airports of Thailand PCL - Overview
Airports of Thailand PCL - Business segments
Airports of Thailand PCL - Key offerings
Airports of Thailand PCL - Segment focus
SWOT

15.7 Copenhagen Airports AS

Copenhagen Airports AS - Overview
Copenhagen Airports AS - Business segments
Copenhagen Airports AS - Key offerings
Copenhagen Airports AS - Segment focus
SWOT

15.8 Dubai Airports Co.

Dubai Airports Co. - Overview
Dubai Airports Co. - Product / Service
Dubai Airports Co. - Key offerings
SWOT

15.9 Flughafen Munchen GmbH

Flughafen Munchen GmbH - Overview
Flughafen Munchen GmbH - Product / Service
Flughafen Munchen GmbH - Key offerings
SWOT

15.10 Flughafen Zurich AG

Flughafen Zurich AG - Overview
Flughafen Zurich AG - Business segments
Flughafen Zurich AG - Key offerings
Flughafen Zurich AG - Segment focus
SWOT

15.11 Fraport AG

Fraport AG - Overview
Fraport AG - Business segments
Fraport AG - Key news
Fraport AG - Key offerings
Fraport AG - Segment focus
SWOT

15.12 GMR Airports Infrastructure Ltd.

GMR Airports Infrastructure Ltd. - Overview
GMR Airports Infrastructure Ltd. - Business segments
GMR Airports Infrastructure Ltd. - Key offerings
GMR Airports Infrastructure Ltd. - Segment focus
SWOT

15.13 IGA Istanbul Airport

IGA Istanbul Airport - Overview
IGA Istanbul Airport - Product / Service
IGA Istanbul Airport - Key offerings
SWOT

15.14 Japan Airport Terminal Co. Ltd.

Japan Airport Terminal Co. Ltd. - Overview
Japan Airport Terminal Co. Ltd. - Business segments
Japan Airport Terminal Co. Ltd. - Key offerings
Japan Airport Terminal Co. Ltd. - Segment focus
SWOT

15.15 Korea Airports Corp.

Korea Airports Corp. - Overview
Korea Airports Corp. - Product / Service
Korea Airports Corp. - Key news
Korea Airports Corp. - Key offerings
SWOT

15.16 Malaysia Airports Holdings

Malaysia Airports Holdings - Overview
Malaysia Airports Holdings - Product / Service
Malaysia Airports Holdings - Key offerings
SWOT

15.17 Royal Schiphol Group N.V.

Royal Schiphol Group N.V. - Overview
Royal Schiphol Group N.V. - Product / Service
Royal Schiphol Group N.V. - Key offerings
SWOT

15.18 Vinci SA

Vinci SA - Overview
Vinci SA - Business segments
Vinci SA - Key offerings
Vinci SA - Segment focus
SWOT

16. Appendix

16.1 Scope of the report

Market definition
Objectives
Notes and caveats

16.2 Inclusions and exclusions checklist

Inclusions checklist
Exclusions checklist

16.3 Currency conversion rates for US$

16.4 Research methodology

16.5 Data procurement

Information sources

16.6 Data validation

16.7 Validation techniques employed for market sizing

16.8 Data synthesis

16.9 360 degree market analysis

16.10 List of abbreviations

Research Methodology

Technavio presents a detailed picture of the market by way of study, synthesis, and summation of data from multiple sources. The analysts have presented the various facets of the market with a particular focus on identifying the key industry influencers. The data thus presented is comprehensive, reliable, and the result of extensive research, both primary and secondary.

INFORMATION SOURCES

Primary sources

  • Manufacturers and suppliers
  • Channel partners
  • Industry experts
  • Strategic decision makers

Secondary sources

  • Industry journals and periodicals
  • Government data
  • Financial reports of key industry players
  • Historical data
  • Press releases

DATA ANALYSIS

Data Synthesis

  • Collation of data
  • Estimation of key figures
  • Analysis of derived insights

Data Validation

  • Triangulation with data models
  • Reference against proprietary databases
  • Corroboration with industry experts

REPORT WRITING

Qualitative

  • Market drivers
  • Market challenges
  • Market trends
  • Five forces analysis

Quantitative

  • Market size and forecast
  • Market segmentation
  • Geographical insights
  • Competitive landscape

Interested in this report?

Get your sample now to see our research methodology and insights!

Download Now

Frequently Asked Questions

Airport Non-aeronautical Revenue market growth will increase by USD 48005.8 million during 2026-2030.

The Airport Non-aeronautical Revenue market is expected to grow at a CAGR of 8.5% during 2026-2030.

Airport Non-aeronautical Revenue market is segmented by Service (Concessionaries, Parking and car rentals, Land rentals, Terminal rent by airlines, Others) Business segment (Commercial development, Advertising) Type (Large airports, Medium airports, Small airports)

Aena S.M.E. SA, Aeroports de Paris SA, Airports of Thailand PCL, Changi Airport Group Pte. Ltd., Copenhagen Airports AS, Dubai Airports Co., Flughafen Munchen GmbH, Flughafen Zurich AG, Fraport AG, GMR Airports Infrastructure Ltd., Heathrow Airport Holdings Ltd., IGA Istanbul Airport, Japan Airport Terminal Co. Ltd., Korea Airports Corp., Malaysia Airports Holdings, Royal Schiphol Group N.V., Sydney Airport Corp. Ltd., Vancouver Airport Authority, Vinci SA are a few of the key vendors in the Airport Non-aeronautical Revenue market.

North America will register the highest growth rate of 28.4% among the other regions. Therefore, the Airport Non-aeronautical Revenue market in North America is expected to garner significant business opportunities for the vendors during the forecast period.

China, Japan, India, Australia, Singapore, Indonesia, US, Canada, Mexico, UK, Germany, France, Spain, Italy, The Netherlands, UAE, Saudi Arabia, Qatar, South Africa, Egypt, Brazil, Argentina, Colombia

  • Rising passenger traffic and global connectivity is the driving factor this market.

The Airport Non-aeronautical Revenue market vendors should focus on grabbing business opportunities from the Service segment as it accounted for the largest market share in the base year.
RIA - Research AI Assistant
Ask RIA