Alcoholic Beverages Market Analysis, Size, and Forecast 2026-2030: Europe (Germany, UK, and France), APAC (China, Japan, and India), North America (US, Canada, and Mexico), South America (Brazil, Argentina, and Colombia), Middle East and Africa (Saudi Arabia, UAE, and South Africa), and Rest of World (ROW)

Alcoholic Beverages Market Analysis, Size, and Forecast 2026-2030:
Europe (Germany, UK, and France), APAC (China, Japan, and India), North America (US, Canada, and Mexico), South America (Brazil, Argentina, and Colombia), Middle East and Africa (Saudi Arabia, UAE, and South Africa), and Rest of World (ROW)

Published: Mar 2026 298 Pages SKU: IRTNTR72902

Market Overview at a Glance

$458.2 B
Market Opportunity
3.4%
CAGR 2025 - 2030
29.2%
APAC Growth
$973.8 B
Beer segment 2024

Alcoholic Beverages Market Size 2026-2030

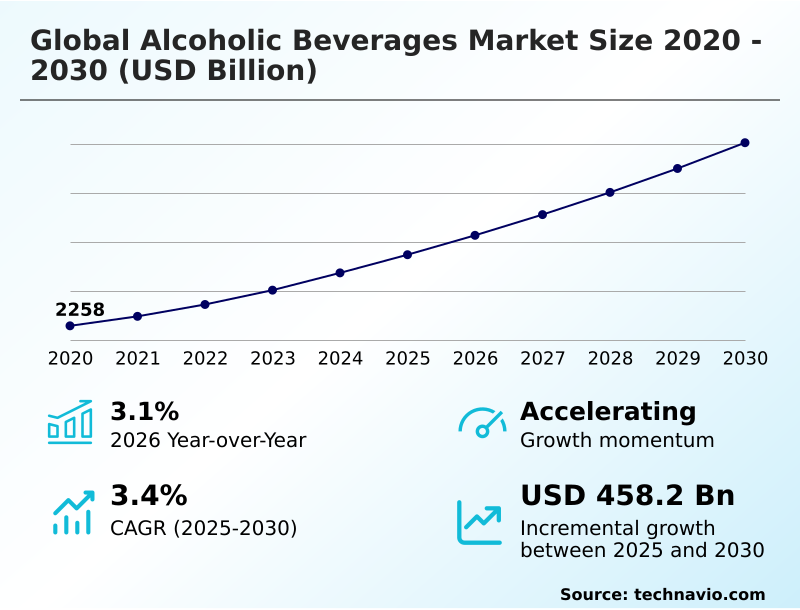
The alcoholic beverages market size is valued to increase by USD 458.2 billion, at a CAGR of 3.4% from 2025 to 2030. Increase in popularity of craft segment will drive the alcoholic beverages market.

Major Market Trends & Insights

  • APAC dominated the market and accounted for a 29.2% growth during the forecast period.
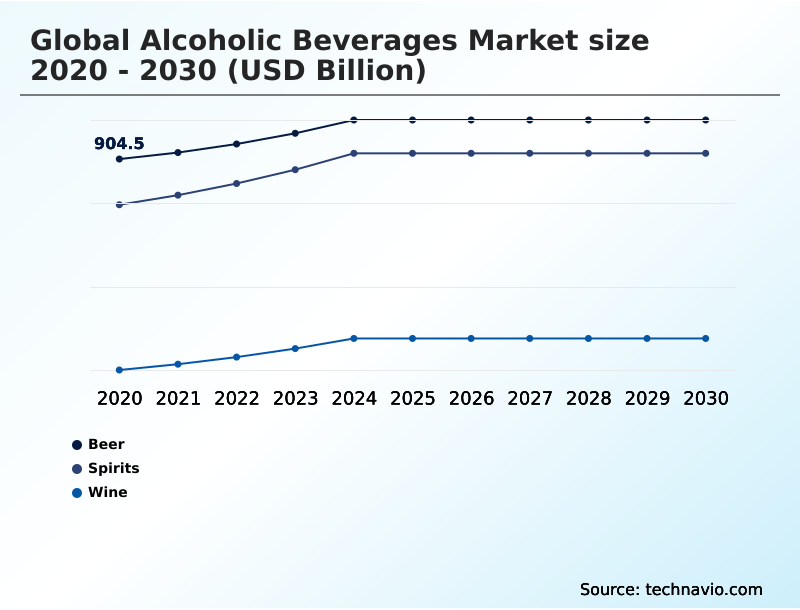
  • By Product - Beer segment was valued at USD 973.8 billion in 2024
  • By Distribution Channel - Off-trade segment accounted for the largest market revenue share in 2024

Market Size & Forecast

  • Market Opportunities: USD 749.1 billion
  • Market Future Opportunities: USD 458.2 billion
  • CAGR from 2025 to 2030 : 3.4%

Market Summary

  • The Alcoholic Beverages Market is navigating a period of significant transformation, defined by evolving consumer preferences and technological advancements. Key drivers include the rise of a prominent craft segment, where artisanal quality and flavor innovation are paramount, and the growing popularity of social drinking venues that foster experiential consumption.
  • Concurrently, the industry is shaped by trends such as the premiumization trend and increasing online sales through dedicated e-commerce platforms, which necessitates robust age verification technologies. For instance, a spirits company implementing advanced supply chain oversight with forensic markers on its single-malt whiskies can reduce counterfeit infiltration by over 30%, protecting brand identity and consumer trust.
  • However, the market faces challenges from the growing demand for non-alcoholic alternatives driven by a focus on health and wellness, alongside the persistent pressure of high taxation rates and excise duties. Success hinges on balancing tradition with innovation, from refining fermentation process and distillation techniques to adopting sustainable packaging and embracing digital engagement to promote responsible drinking.

What will be the Size of the Alcoholic Beverages Market during the forecast period?

Get Key Insights on Market Forecast (PDF) Request Free Sample

How is the Alcoholic Beverages Market Segmented?

The alcoholic beverages industry research report provides comprehensive data (region-wise segment analysis), with forecasts and estimates in "USD billion" for the period 2026-2030, as well as historical data from 2020-2024 for the following segments.

  • Product
    • Beer
    • Spirits
    • Wine
  • Distribution channel
    • Off-trade
    • On-trade
  • Type
    • Low alcohol
    • Medium alcohol
    • High alcohol
  • Geography
    • Europe
      • Germany
      • UK
      • France
    • APAC
      • China
      • Japan
      • India
    • North America
      • US
      • Canada
      • Mexico
    • South America
      • Brazil
      • Argentina
      • Colombia
    • Middle East and Africa
      • Saudi Arabia
      • UAE
      • South Africa
    • Rest of World (ROW)

By Product Insights

The beer segment is estimated to witness significant growth during the forecast period.

Market segmentation is increasingly influenced by digital transformation and regulatory pressures. The rise of e-commerce platforms is compelling brands to refine their approach, with a focus on digital engagement and robust age verification technologies to manage online sales.

This shift has led to a nearly 15% increase in investment in secure checkout systems. High taxation rates continue to shape product strategies, while the demand for experiential consumption drives innovation in both product and delivery.

Boutiques distilleries are leveraging direct-to-consumer models, which now account for over 10% of craft spirit sales, to bypass traditional channels.

This approach, alongside the adoption of low-alcohol beverages, and a variety of still wine and fortified wines, helps mitigate the carbon footprint associated with complex distribution networks, reshaping how producers of craft ale and premium lagers reach consumers.

Request Free Sample

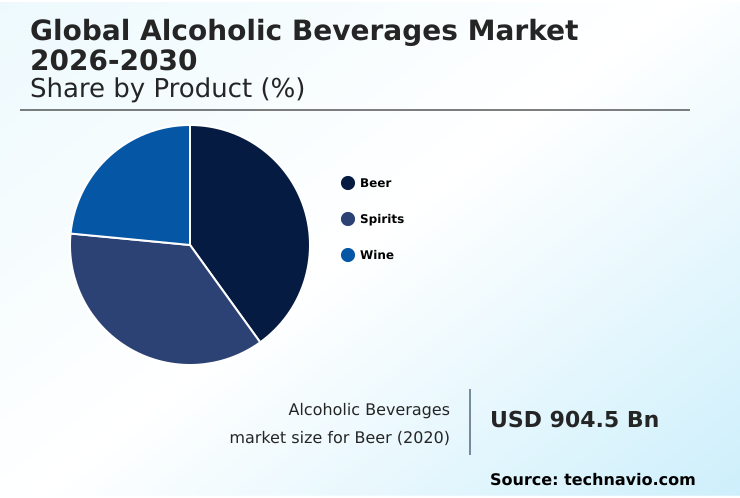
The Beer segment was valued at USD 973.8 billion in 2024 and showed a gradual increase during the forecast period.

Request Free Sample

Regional Analysis

APAC is estimated to contribute 29.2% to the growth of the global market during the forecast period.Technavio’s analysts have elaborately explained the regional trends and drivers that shape the market during the forecast period.

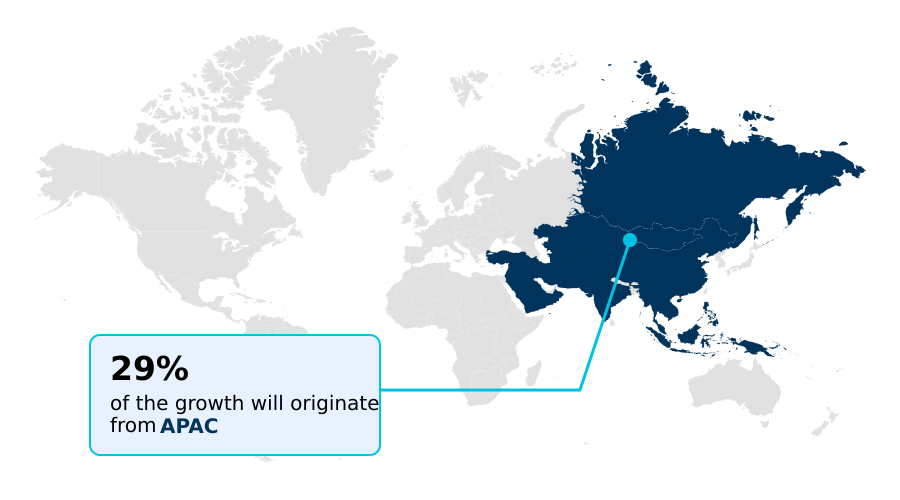
See How Alcoholic Beverages Market Demand is Rising in APAC Request Free Sample

The geographic landscape is shifting, with APAC poised to become the largest region, exhibiting a growth rate of 3.9% compared to Europe's 3.1%.

This expansion is driven by a strong premiumization trend and targeted marketing and promotional activities that build brand identity.

In North America, the cocktail culture continues to fuel demand for premium beer and spirits, while a surge in craft breweries and boutique distilleries focusing on flavor innovation reshapes local markets.

Consumers are exploring western-style wine and whiskey, craft ale, and premium lagers. The rising popularity of sparkling wines and zero-proof versions in developed regions highlights a turn towards diverse and mindful consumption.

Firms that adapt their portfolios to these regional nuances, such as introducing low-alcohol beverages, are capturing a larger market share.

Market Dynamics

Our researchers analyzed the data with 2025 as the base year, along with the key drivers, trends, and challenges. A holistic analysis of drivers will help companies refine their marketing strategies to gain a competitive advantage.

  • Strategic navigation of the alcoholic beverages market requires a deep understanding of several interconnected dynamics. The impact of premiumization on the spirits market continues to reshape revenue streams, while the rise of craft beer in emerging economies is creating new competitive fronts. Simultaneously, brands face the persistent challenges of counterfeit alcoholic products, which necessitate advanced supply chain management.
  • The growth of online sales channels for alcoholic beverages is a primary focus, forcing companies to master digital engagement strategies for wine brands and implement effective age verification in online sales. The increasing adoption of sustainable packaging solutions for the wine industry is now a key differentiator, addressing consumer demand for environmental responsibility.
  • Competition from non-alcoholic beverage alternatives, fueled by health and wellness trends affecting consumption, is pushing for innovation in flavor profiles for beer and the expansion of low-alcohol options. The growth drivers for ready-to-drink cocktails are linked to convenience, while the popularity of social drinking venues post-pandemic underscores the value of experiential marketing.
  • Successfully managing the regulatory impact of high taxation rates and developing marketing strategies for premium spirit brands are crucial for profitability. The market's future will be defined by how well companies address the consumer demand for organic and natural wines while managing their supply chains against counterfeit goods, with digital platforms showing over 40% more engagement than traditional advertising.

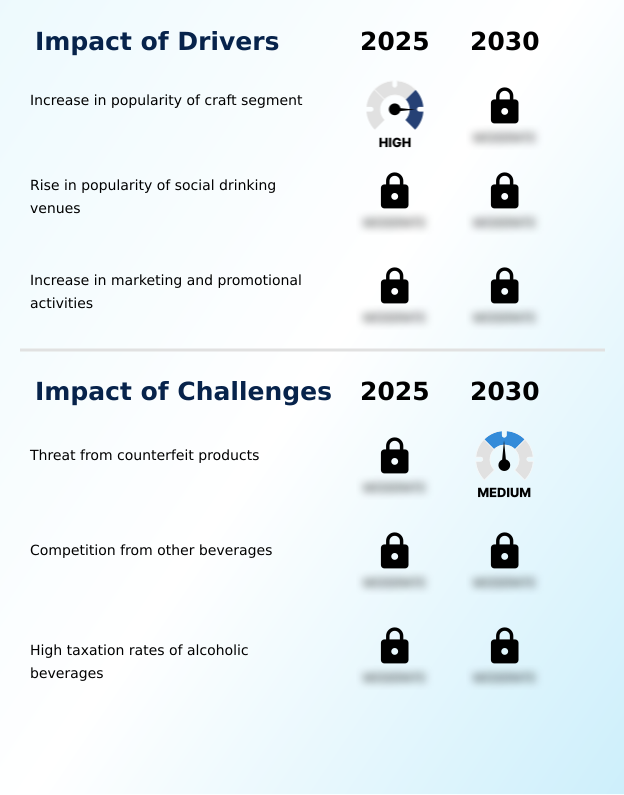
What are the key market drivers leading to the rise in the adoption of Alcoholic Beverages Industry?

  • The increasing popularity of the craft segment, which emphasizes local heritage and artisanal quality over mass production, is a key driver for the market.

  • Market growth is significantly propelled by the consumer quest for authentic and unique experiences. The rise of microbreweries and the popularity of artisanal gins and craft heritage whiskey reflect a demand for products with a compelling narrative.
  • This is amplified by the growth of themed pop-up bars and other venues that prioritize brand discovery, leading to a 25% increase in engagement for brands that offer immersive events.
  • The influence of cocktail culture, promoted through social media, has expanded the market for specialized spirits used in gourmet meals. Furthermore, direct-to-consumer models, bypassing traditional retail, allow for greater flavor innovation and direct feedback.
  • Effective supply chain oversight ensures that these premium products, defined by their unique ethyl alcohol profiles, reach consumers efficiently, while sustainable packaging enhances brand appeal, boosting loyalty by up to 15%.

What are the market trends shaping the Alcoholic Beverages Industry?

  • A notable surge in the consumption of alcoholic beverages globally is a significant upcoming market trend. This is primarily driven by rapid urbanization and the expansion of the middle class in emerging economies.

  • Key trends are reshaping the market, driven by consumer demand for healthier and more convenient options. The sober curious movement has propelled the premiumization trend for non-alcoholic alternatives, with sales of sophisticated soft drinks and low-alcohol beverages growing 12% faster than their full-strength counterparts. This shift challenges traditional fermentation process and distillation techniques, pushing brands to innovate.
  • The rise of ready to drink cocktails, offering convenience without sacrificing artisanal quality, has captured significant market share. Simultaneously, the growth of e-commerce has been pivotal, with sales of premium beer and spirits and western-style wine and whiskey through online channels increasing by over 30% in key demographics.
  • Navigating this landscape requires balancing the craft segment with scalable production while managing complex excise duties.

What challenges does the Alcoholic Beverages Industry face during its growth?

  • The significant threat from counterfeit products, which undermines brand integrity and poses severe health risks to consumers, is a key challenge affecting industry growth.

  • The market is confronting significant challenges, led by the proliferation of counterfeit products, which erodes consumer trust and results in revenue losses estimated at 10-15% for premium brands. Addressing this requires robust supply chain oversight combined with technologies like forensic markers and digital identifiers. Concurrently, high taxation rates and excise duties compress margins and stifle growth, particularly for smaller producers.
  • The global health and wellness trend has also spurred competition from non-alcoholic alternatives, with sophisticated soft drinks and plant-based energy drinks capturing a larger share of social occasions. This sober curious movement is compelling established brands to innovate with non-alcoholic spirits and zero-proof versions to retain market share, all while promoting responsible drinking to align with public health expectations.

Exclusive Technavio Analysis on Customer Landscape

The alcoholic beverages market forecasting report includes the adoption lifecycle of the market, covering from the innovator’s stage to the laggard’s stage. It focuses on adoption rates in different regions based on penetration. Furthermore, the alcoholic beverages market report also includes key purchase criteria and drivers of price sensitivity to help companies evaluate and develop their market growth analysis strategies.

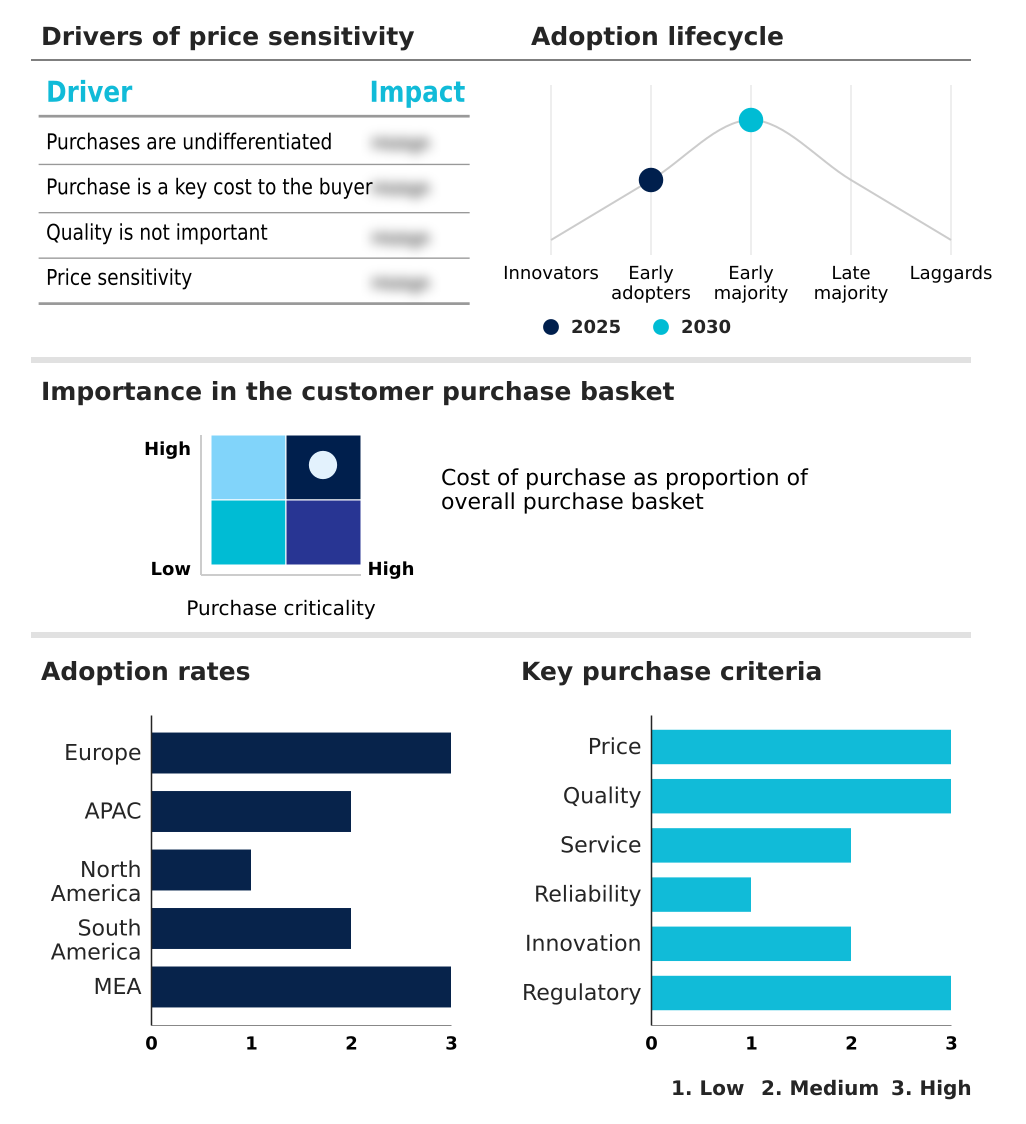
Customer Landscape of Alcoholic Beverages Industry

Competitive Landscape

Companies are implementing various strategies, such as strategic alliances, alcoholic beverages market forecast, partnerships, mergers and acquisitions, geographical expansion, and product/service launches, to enhance their presence in the industry.

Anheuser-Busch Companies - The market features a portfolio of premium spirits, wines, and beers, distinguished by artisanal craftsmanship, flavor innovation, and a strong emphasis on global brand heritage.

The industry research and growth report includes detailed analyses of the competitive landscape of the market and information about key companies, including:

  • Anheuser-Busch Companies
  • Asahi Group Holdings Ltd.
  • Bells Brewery Inc.
  • Campari Group
  • Carlsberg Breweries AS
  • Constellation Brands Inc.
  • D.G. Yuengling and Son Inc.
  • Deschutes Brewery
  • Diageo PLC
  • FIFCO USA
  • Heineken NV
  • Kirin Holdings Co. Ltd.
  • Medusa Brewing Co
  • Molson Coors Beverage Co.
  • New Belgium Brewing Co. Inc.
  • Pernod Ricard SA
  • Stone Brewing Co. LLC
  • Suntory Beverage and Food Ltd.
  • Treasury Wine Estates Ltd.

Qualitative and quantitative analysis of companies has been conducted to help clients understand the wider business environment as well as the strengths and weaknesses of key industry players. Data is qualitatively analyzed to categorize companies as pure play, category-focused, industry-focused, and diversified; it is quantitatively analyzed to categorize companies as dominant, leading, strong, tentative, and weak.

Recent Development and News in Alcoholic beverages market

  • In January, 2025, Heineken NV reported that surging urban consumer demand in Asian markets contributed to a record-breaking volume growth for its premium lager segment during the first quarter.
  • In March, 2025, Diageo PLC announced the launch of its new carbon-neutral distillery in North America, a significant milestone in its strategy to achieve fully sustainable spirit production.
  • In May, 2025, Pernod Ricard SA highlighted a strategic investment in a new series of global experiential flagship bars designed to offer immersive cocktail workshops and tasting events for brand enthusiasts.
  • In October, 2024, Anheuser Busch InBev announced a major new marketing partnership with a world-famous music streaming service to promote its latest light beer variety through personalized playlists and virtual concert events.

Dive into Technavio’s robust research methodology, blending expert interviews, extensive data synthesis, and validated models for unparalleled Alcoholic Beverages Market insights. See full methodology.

Market Scope
Page number 298
Base year 2025
Historic period 2020-2024
Forecast period 2026-2030
Growth momentum & CAGR Accelerate at a CAGR of 3.4%
Market growth 2026-2030 USD 458.2 billion
Market structure Fragmented
YoY growth 2025-2026(%) 3.1%
Key countries Germany, UK, France, Italy, Spain, The Netherlands, China, Japan, India, South Korea, Australia, Indonesia, US, Canada, Mexico, Brazil, Argentina, Colombia, Saudi Arabia, UAE, South Africa, Israel and Turkey
Competitive landscape Leading Companies, Market Positioning of Companies, Competitive Strategies, and Industry Risks

Request Free Sample

Research Analyst Overview

  • The alcoholic beverages market is defined by a complex interplay of consumer trends, technological shifts, and regulatory pressures. The premiumization trend is a dominant force, compelling producers of single-malt whiskies and organic wines to emphasize artisanal quality and local heritage.
  • This pivot toward small-batch products is supported by a robust craft segment, with craft breweries and boutique distilleries leveraging direct-to-consumer models for brand discovery. Simultaneously, the rise of e-commerce platforms fuels online sales, demanding sophisticated digital engagement and age verification technologies.
  • In response to health and wellness concerns, the industry is expanding its portfolio of non-alcoholic alternatives and promoting responsible drinking. For boardroom decisions, adopting sustainable packaging to reduce the carbon footprint is no longer optional, with new formats leading to a 20% reduction in shipping costs.
  • Strategic challenges include combating counterfeit products through enhanced supply chain oversight and navigating high taxation rates and excise duties.
  • Success requires mastering everything from the core fermentation process and distillation techniques to innovative flavor innovation and marketing and promotional activities that build a resilient brand identity in a crowded marketplace, including the growing cocktail culture and the expansion of ready-to-drink cocktails in social drinking venues.

What are the Key Data Covered in this Alcoholic Beverages Market Research and Growth Report?

  • What is the expected growth of the Alcoholic Beverages Market between 2026 and 2030?

    • USD 458.2 billion, at a CAGR of 3.4%

  • What segmentation does the market report cover?

    • The report is segmented by Product (Beer, Spirits, and Wine), Distribution Channel (Off-trade, and On-trade), Type (Low alcohol, Medium alcohol, and High alcohol) and Geography (Europe, APAC, North America, South America, Middle East and Africa)

  • Which regions are analyzed in the report?

    • Europe, APAC, North America, South America and Middle East and Africa

  • What are the key growth drivers and market challenges?

    • Increase in popularity of craft segment, Threat from counterfeit products

  • Who are the major players in the Alcoholic Beverages Market?

    • Anheuser-Busch Companies, Asahi Group Holdings Ltd., Bells Brewery Inc., Campari Group, Carlsberg Breweries AS, Constellation Brands Inc., D.G. Yuengling and Son Inc., Deschutes Brewery, Diageo PLC, FIFCO USA, Heineken NV, Kirin Holdings Co. Ltd., Medusa Brewing Co, Molson Coors Beverage Co., New Belgium Brewing Co. Inc., Pernod Ricard SA, Stone Brewing Co. LLC, Suntory Beverage and Food Ltd. and Treasury Wine Estates Ltd.

Market Research Insights

  • The market's dynamics are increasingly shaped by the pursuit of premium and convenient consumer experiences. The demand for sophisticated soft drinks and plant-based energy drinks is compelling alcohol brands to innovate, with some achieving a 15% growth in their low-alcohol beverage lines.
  • In parallel, the direct-to-consumer channel is surging, with microbreweries and producers of craft heritage whiskey leveraging online platforms to bypass traditional retail. This has led to a 25% improvement in profit margins for small-batch producers. The cocktail culture, supported by social media influencers, continues to fuel interest in artisanal gins and unique spirits for gourmet meals.
  • As companies adapt, the focus on experience-driven venues like themed pop-up bars is proving critical for brand differentiation and consumer engagement in a competitive landscape.

We can help! Our analysts can customize this alcoholic beverages market research report to meet your requirements.

Get in touch

1. Executive Summary

1.1 Market overview

Executive Summary - Chart on Market Overview
Executive Summary - Data Table on Market Overview
Executive Summary - Chart on Global Market Characteristics
Executive Summary - Chart on Market by Geography
Executive Summary - Chart on Market Segmentation by Product
Executive Summary - Chart on Market Segmentation by Distribution Channel
Executive Summary - Chart on Market Segmentation by Type
Executive Summary - Chart on Incremental Growth
Executive Summary - Data Table on Incremental Growth
Executive Summary - Chart on Company Market Positioning

2. Technavio Analysis

2.1 Analysis of price sensitivity, lifecycle, customer purchase basket, adoption rates, and purchase criteria

2.2 Criticality of inputs and Factors of differentiation

Chart on Overview on criticality of inputs and factors of differentiation

2.3 Factors of disruption

Chart on Overview on factors of disruption

2.4 Impact of drivers and challenges

Chart on Impact of drivers and challenges in 2025 and 2030

3. Market Landscape

3.1 Market ecosystem

Chart on Parent Market
Data Table on - Parent Market

3.2 Market characteristics

Chart on Market characteristics analysis

3.3 Value chain analysis

Chart on Value chain analysis

4. Market Sizing

4.1 Market definition

Data Table on Offerings of companies included in the market definition

4.2 Market segment analysis

Market segments

4.3 Market size 2025

4.4 Market outlook: Forecast for 2025-2030

Chart on Global - Market size and forecast 2025-2030 ($ billion)
Data Table on Global - Market size and forecast 2025-2030 ($ billion)
Chart on Global Market: Year-over-year growth 2025-2030 (%)
Data Table on Global Market: Year-over-year growth 2025-2030 (%)

5. Historic Market Size

5.1 Global Alcoholic Beverages Market 2020 - 2024

Historic Market Size - Data Table on Global Alcoholic Beverages Market 2020 - 2024 ($ billion)

5.2 Product segment analysis 2020 - 2024

Historic Market Size - Product Segment 2020 - 2024 ($ billion)

5.3 Distribution Channel segment analysis 2020 - 2024

Historic Market Size - Distribution Channel Segment 2020 - 2024 ($ billion)

5.4 Type segment analysis 2020 - 2024

Historic Market Size - Type Segment 2020 - 2024 ($ billion)

5.5 Geography segment analysis 2020 - 2024

Historic Market Size - Geography Segment 2020 - 2024 ($ billion)

5.6 Country segment analysis 2020 - 2024

Historic Market Size - Country Segment 2020 - 2024 ($ billion)

6. Qualitative Analysis

6.1 Impact of AI on Global Alcoholic Beverages Market

7. Five Forces Analysis

7.1 Five forces summary

Five forces analysis - Comparison between 2025 and 2030

7.2 Bargaining power of buyers

Bargaining power of buyers - Impact of key factors 2025 and 2030

7.3 Bargaining power of suppliers

Bargaining power of suppliers - Impact of key factors in 2025 and 2030

7.4 Threat of new entrants

Threat of new entrants - Impact of key factors in 2025 and 2030

7.5 Threat of substitutes

Threat of substitutes - Impact of key factors in 2025 and 2030

7.6 Threat of rivalry

Threat of rivalry - Impact of key factors in 2025 and 2030

7.7 Market condition

Chart on Market condition - Five forces 2025 and 2030

8. Market Segmentation by Product

8.1 Market segments

Chart on Product - Market share 2025-2030 (%)
Data Table on Product - Market share 2025-2030 (%)

8.2 Comparison by Product

Chart on Comparison by Product
Data Table on Comparison by Product

8.3 Beer - Market size and forecast 2025-2030

Chart on Beer - Market size and forecast 2025-2030 ($ billion)
Data Table on Beer - Market size and forecast 2025-2030 ($ billion)
Chart on Beer - Year-over-year growth 2025-2030 (%)
Data Table on Beer - Year-over-year growth 2025-2030 (%)

8.4 Spirits - Market size and forecast 2025-2030

Chart on Spirits - Market size and forecast 2025-2030 ($ billion)
Data Table on Spirits - Market size and forecast 2025-2030 ($ billion)
Chart on Spirits - Year-over-year growth 2025-2030 (%)
Data Table on Spirits - Year-over-year growth 2025-2030 (%)

8.5 Wine - Market size and forecast 2025-2030

Chart on Wine - Market size and forecast 2025-2030 ($ billion)
Data Table on Wine - Market size and forecast 2025-2030 ($ billion)
Chart on Wine - Year-over-year growth 2025-2030 (%)
Data Table on Wine - Year-over-year growth 2025-2030 (%)

8.6 Market opportunity by Product

Market opportunity by Product ($ billion)
Data Table on Market opportunity by Product ($ billion)

9. Market Segmentation by Distribution Channel

9.1 Market segments

Chart on Distribution Channel - Market share 2025-2030 (%)
Data Table on Distribution Channel - Market share 2025-2030 (%)

9.2 Comparison by Distribution Channel

Chart on Comparison by Distribution Channel
Data Table on Comparison by Distribution Channel

9.3 Off-trade - Market size and forecast 2025-2030

Chart on Off-trade - Market size and forecast 2025-2030 ($ billion)
Data Table on Off-trade - Market size and forecast 2025-2030 ($ billion)
Chart on Off-trade - Year-over-year growth 2025-2030 (%)
Data Table on Off-trade - Year-over-year growth 2025-2030 (%)

9.4 On-trade - Market size and forecast 2025-2030

Chart on On-trade - Market size and forecast 2025-2030 ($ billion)
Data Table on On-trade - Market size and forecast 2025-2030 ($ billion)
Chart on On-trade - Year-over-year growth 2025-2030 (%)
Data Table on On-trade - Year-over-year growth 2025-2030 (%)

9.5 Market opportunity by Distribution Channel

Market opportunity by Distribution Channel ($ billion)
Data Table on Market opportunity by Distribution Channel ($ billion)

10. Market Segmentation by Type

10.1 Market segments

Chart on Type - Market share 2025-2030 (%)
Data Table on Type - Market share 2025-2030 (%)

10.2 Comparison by Type

Chart on Comparison by Type
Data Table on Comparison by Type

10.3 Low alcohol - Market size and forecast 2025-2030

Chart on Low alcohol - Market size and forecast 2025-2030 ($ billion)
Data Table on Low alcohol - Market size and forecast 2025-2030 ($ billion)
Chart on Low alcohol - Year-over-year growth 2025-2030 (%)
Data Table on Low alcohol - Year-over-year growth 2025-2030 (%)

10.4 Medium alcohol - Market size and forecast 2025-2030

Chart on Medium alcohol - Market size and forecast 2025-2030 ($ billion)
Data Table on Medium alcohol - Market size and forecast 2025-2030 ($ billion)
Chart on Medium alcohol - Year-over-year growth 2025-2030 (%)
Data Table on Medium alcohol - Year-over-year growth 2025-2030 (%)

10.5 High alcohol - Market size and forecast 2025-2030

Chart on High alcohol - Market size and forecast 2025-2030 ($ billion)
Data Table on High alcohol - Market size and forecast 2025-2030 ($ billion)
Chart on High alcohol - Year-over-year growth 2025-2030 (%)
Data Table on High alcohol - Year-over-year growth 2025-2030 (%)

10.6 Market opportunity by Type

Market opportunity by Type ($ billion)
Data Table on Market opportunity by Type ($ billion)

11. Customer Landscape

11.1 Customer landscape overview

Analysis of price sensitivity, lifecycle, customer purchase basket, adoption rates, and purchase criteria

12. Geographic Landscape

12.1 Geographic segmentation

Chart on Market share by geography 2025-2030 (%)
Data Table on Market share by geography 2025-2030 (%)

12.2 Geographic comparison

Chart on Geographic comparison
Data Table on Geographic comparison

12.3 Europe - Market size and forecast 2025-2030

Chart on Europe - Market size and forecast 2025-2030 ($ billion)
Data Table on Europe - Market size and forecast 2025-2030 ($ billion)
Chart on Europe - Year-over-year growth 2025-2030 (%)
Data Table on Europe - Year-over-year growth 2025-2030 (%)
Chart on Regional Comparison - Europe
Data Table on Regional Comparison - Europe

12.3.1 Germany - Market size and forecast 2025-2030

Chart on Germany - Market size and forecast 2025-2030 ($ billion)
Data Table on Germany - Market size and forecast 2025-2030 ($ billion)
Chart on Germany - Year-over-year growth 2025-2030 (%)
Data Table on Germany - Year-over-year growth 2025-2030 (%)

12.3.2 UK - Market size and forecast 2025-2030

Chart on UK - Market size and forecast 2025-2030 ($ billion)
Data Table on UK - Market size and forecast 2025-2030 ($ billion)
Chart on UK - Year-over-year growth 2025-2030 (%)
Data Table on UK - Year-over-year growth 2025-2030 (%)

12.3.3 France - Market size and forecast 2025-2030

Chart on France - Market size and forecast 2025-2030 ($ billion)
Data Table on France - Market size and forecast 2025-2030 ($ billion)
Chart on France - Year-over-year growth 2025-2030 (%)
Data Table on France - Year-over-year growth 2025-2030 (%)

12.3.4 Italy - Market size and forecast 2025-2030

Chart on Italy - Market size and forecast 2025-2030 ($ billion)
Data Table on Italy - Market size and forecast 2025-2030 ($ billion)
Chart on Italy - Year-over-year growth 2025-2030 (%)
Data Table on Italy - Year-over-year growth 2025-2030 (%)

12.3.5 Spain - Market size and forecast 2025-2030

Chart on Spain - Market size and forecast 2025-2030 ($ billion)
Data Table on Spain - Market size and forecast 2025-2030 ($ billion)
Chart on Spain - Year-over-year growth 2025-2030 (%)
Data Table on Spain - Year-over-year growth 2025-2030 (%)

12.3.6 The Netherlands - Market size and forecast 2025-2030

Chart on The Netherlands - Market size and forecast 2025-2030 ($ billion)
Data Table on The Netherlands - Market size and forecast 2025-2030 ($ billion)
Chart on The Netherlands - Year-over-year growth 2025-2030 (%)
Data Table on The Netherlands - Year-over-year growth 2025-2030 (%)

12.4 APAC - Market size and forecast 2025-2030

Chart on APAC - Market size and forecast 2025-2030 ($ billion)
Data Table on APAC - Market size and forecast 2025-2030 ($ billion)
Chart on APAC - Year-over-year growth 2025-2030 (%)
Data Table on APAC - Year-over-year growth 2025-2030 (%)
Chart on Regional Comparison - APAC
Data Table on Regional Comparison - APAC

12.4.1 China - Market size and forecast 2025-2030

Chart on China - Market size and forecast 2025-2030 ($ billion)
Data Table on China - Market size and forecast 2025-2030 ($ billion)
Chart on China - Year-over-year growth 2025-2030 (%)
Data Table on China - Year-over-year growth 2025-2030 (%)

12.4.2 Japan - Market size and forecast 2025-2030

Chart on Japan - Market size and forecast 2025-2030 ($ billion)
Data Table on Japan - Market size and forecast 2025-2030 ($ billion)
Chart on Japan - Year-over-year growth 2025-2030 (%)
Data Table on Japan - Year-over-year growth 2025-2030 (%)

12.4.3 India - Market size and forecast 2025-2030

Chart on India - Market size and forecast 2025-2030 ($ billion)
Data Table on India - Market size and forecast 2025-2030 ($ billion)
Chart on India - Year-over-year growth 2025-2030 (%)
Data Table on India - Year-over-year growth 2025-2030 (%)

12.4.4 South Korea - Market size and forecast 2025-2030

Chart on South Korea - Market size and forecast 2025-2030 ($ billion)
Data Table on South Korea - Market size and forecast 2025-2030 ($ billion)
Chart on South Korea - Year-over-year growth 2025-2030 (%)
Data Table on South Korea - Year-over-year growth 2025-2030 (%)

12.4.5 Australia - Market size and forecast 2025-2030

Chart on Australia - Market size and forecast 2025-2030 ($ billion)
Data Table on Australia - Market size and forecast 2025-2030 ($ billion)
Chart on Australia - Year-over-year growth 2025-2030 (%)
Data Table on Australia - Year-over-year growth 2025-2030 (%)

12.4.6 Indonesia - Market size and forecast 2025-2030

Chart on Indonesia - Market size and forecast 2025-2030 ($ billion)
Data Table on Indonesia - Market size and forecast 2025-2030 ($ billion)
Chart on Indonesia - Year-over-year growth 2025-2030 (%)
Data Table on Indonesia - Year-over-year growth 2025-2030 (%)

12.5 North America - Market size and forecast 2025-2030

Chart on North America - Market size and forecast 2025-2030 ($ billion)
Data Table on North America - Market size and forecast 2025-2030 ($ billion)
Chart on North America - Year-over-year growth 2025-2030 (%)
Data Table on North America - Year-over-year growth 2025-2030 (%)
Chart on Regional Comparison - North America
Data Table on Regional Comparison - North America

12.5.1 US - Market size and forecast 2025-2030

Chart on US - Market size and forecast 2025-2030 ($ billion)
Data Table on US - Market size and forecast 2025-2030 ($ billion)
Chart on US - Year-over-year growth 2025-2030 (%)
Data Table on US - Year-over-year growth 2025-2030 (%)

12.5.2 Canada - Market size and forecast 2025-2030

Chart on Canada - Market size and forecast 2025-2030 ($ billion)
Data Table on Canada - Market size and forecast 2025-2030 ($ billion)
Chart on Canada - Year-over-year growth 2025-2030 (%)
Data Table on Canada - Year-over-year growth 2025-2030 (%)

12.5.3 Mexico - Market size and forecast 2025-2030

Chart on Mexico - Market size and forecast 2025-2030 ($ billion)
Data Table on Mexico - Market size and forecast 2025-2030 ($ billion)
Chart on Mexico - Year-over-year growth 2025-2030 (%)
Data Table on Mexico - Year-over-year growth 2025-2030 (%)

12.6 South America - Market size and forecast 2025-2030

Chart on South America - Market size and forecast 2025-2030 ($ billion)
Data Table on South America - Market size and forecast 2025-2030 ($ billion)
Chart on South America - Year-over-year growth 2025-2030 (%)
Data Table on South America - Year-over-year growth 2025-2030 (%)
Chart on Regional Comparison - South America
Data Table on Regional Comparison - South America

12.6.1 Brazil - Market size and forecast 2025-2030

Chart on Brazil - Market size and forecast 2025-2030 ($ billion)
Data Table on Brazil - Market size and forecast 2025-2030 ($ billion)
Chart on Brazil - Year-over-year growth 2025-2030 (%)
Data Table on Brazil - Year-over-year growth 2025-2030 (%)

12.6.2 Argentina - Market size and forecast 2025-2030

Chart on Argentina - Market size and forecast 2025-2030 ($ billion)
Data Table on Argentina - Market size and forecast 2025-2030 ($ billion)
Chart on Argentina - Year-over-year growth 2025-2030 (%)
Data Table on Argentina - Year-over-year growth 2025-2030 (%)

12.6.3 Colombia - Market size and forecast 2025-2030

Chart on Colombia - Market size and forecast 2025-2030 ($ billion)
Data Table on Colombia - Market size and forecast 2025-2030 ($ billion)
Chart on Colombia - Year-over-year growth 2025-2030 (%)
Data Table on Colombia - Year-over-year growth 2025-2030 (%)

12.7 Middle East and Africa - Market size and forecast 2025-2030

Chart on Middle East and Africa - Market size and forecast 2025-2030 ($ billion)
Data Table on Middle East and Africa - Market size and forecast 2025-2030 ($ billion)
Chart on Middle East and Africa - Year-over-year growth 2025-2030 (%)
Data Table on Middle East and Africa - Year-over-year growth 2025-2030 (%)
Chart on Regional Comparison - Middle East and Africa
Data Table on Regional Comparison - Middle East and Africa

12.7.1 Saudi Arabia - Market size and forecast 2025-2030

Chart on Saudi Arabia - Market size and forecast 2025-2030 ($ billion)
Data Table on Saudi Arabia - Market size and forecast 2025-2030 ($ billion)
Chart on Saudi Arabia - Year-over-year growth 2025-2030 (%)
Data Table on Saudi Arabia - Year-over-year growth 2025-2030 (%)

12.7.2 UAE - Market size and forecast 2025-2030

Chart on UAE - Market size and forecast 2025-2030 ($ billion)
Data Table on UAE - Market size and forecast 2025-2030 ($ billion)
Chart on UAE - Year-over-year growth 2025-2030 (%)
Data Table on UAE - Year-over-year growth 2025-2030 (%)

12.7.3 South Africa - Market size and forecast 2025-2030

Chart on South Africa - Market size and forecast 2025-2030 ($ billion)
Data Table on South Africa - Market size and forecast 2025-2030 ($ billion)
Chart on South Africa - Year-over-year growth 2025-2030 (%)
Data Table on South Africa - Year-over-year growth 2025-2030 (%)

12.7.4 Israel - Market size and forecast 2025-2030

Chart on Israel - Market size and forecast 2025-2030 ($ billion)
Data Table on Israel - Market size and forecast 2025-2030 ($ billion)
Chart on Israel - Year-over-year growth 2025-2030 (%)
Data Table on Israel - Year-over-year growth 2025-2030 (%)

12.7.5 Turkey - Market size and forecast 2025-2030

Chart on Turkey - Market size and forecast 2025-2030 ($ billion)
Data Table on Turkey - Market size and forecast 2025-2030 ($ billion)
Chart on Turkey - Year-over-year growth 2025-2030 (%)
Data Table on Turkey - Year-over-year growth 2025-2030 (%)

12.8 Market opportunity by geography

Market opportunity by geography ($ billion)
Data Tables on Market opportunity by geography ($ billion)

13. Drivers, Challenges, and Opportunity

13.1 Market drivers

Increase in popularity of craft segment
Rise in popularity of social drinking venues
Increase in marketing and promotional activities

13.2 Market challenges

Threat from counterfeit products
Competition from other beverages
High taxation rates of alcoholic beverages

13.3 Impact of drivers and challenges

Impact of drivers and challenges in 2025 and 2030

13.4 Market opportunities

Surge in consumption of alcoholic beverages globally
Increasing online sales of alcoholic beverages
New packaging formats

14. Competitive Landscape

14.1 Overview

14.2

Overview on criticality of inputs and factors of differentiation

14.3 Landscape disruption

Overview on factors of disruption

14.4 Industry risks

Impact of key risks on business

15. Competitive Analysis

15.1 Companies profiled

Companies covered

15.2 Company ranking index

15.3 Market positioning of companies

Matrix on companies position and classification

15.4 Anheuser-Busch Companies

Anheuser-Busch Companies - Overview
Anheuser-Busch Companies - Business segments
Anheuser-Busch Companies - Key offerings
Anheuser-Busch Companies - Segment focus
SWOT

15.5 Asahi Group Holdings Ltd.

Asahi Group Holdings Ltd. - Overview
Asahi Group Holdings Ltd. - Business segments
Asahi Group Holdings Ltd. - Key news
Asahi Group Holdings Ltd. - Key offerings
Asahi Group Holdings Ltd. - Segment focus
SWOT

15.6 Bells Brewery Inc.

Bells Brewery Inc. - Overview
Bells Brewery Inc. - Product / Service
Bells Brewery Inc. - Key offerings
SWOT

15.7 Campari Group

Campari Group - Overview
Campari Group - Business segments
Campari Group - Key offerings
Campari Group - Segment focus
SWOT

15.8 Carlsberg Breweries AS

Carlsberg Breweries AS - Overview
Carlsberg Breweries AS - Business segments
Carlsberg Breweries AS - Key news
Carlsberg Breweries AS - Key offerings
Carlsberg Breweries AS - Segment focus
SWOT

15.9 Constellation Brands Inc.

Constellation Brands Inc. - Overview
Constellation Brands Inc. - Business segments
Constellation Brands Inc. - Key offerings
Constellation Brands Inc. - Segment focus
SWOT

15.10 Deschutes Brewery

Deschutes Brewery - Overview
Deschutes Brewery - Product / Service
Deschutes Brewery - Key offerings
SWOT

15.11 Diageo PLC

Diageo PLC - Overview
Diageo PLC - Business segments
Diageo PLC - Key news
Diageo PLC - Key offerings
Diageo PLC - Segment focus
SWOT

15.12 Heineken NV

Heineken NV - Overview
Heineken NV - Business segments
Heineken NV - Key offerings
Heineken NV - Segment focus
SWOT

15.13 Kirin Holdings Co. Ltd.

Kirin Holdings Co. Ltd. - Overview
Kirin Holdings Co. Ltd. - Business segments
Kirin Holdings Co. Ltd. - Key offerings
Kirin Holdings Co. Ltd. - Segment focus
SWOT

15.14 Medusa Brewing Co

Medusa Brewing Co - Overview
Medusa Brewing Co - Product / Service
Medusa Brewing Co - Key offerings
SWOT

15.15 Molson Coors Beverage Co.

Molson Coors Beverage Co. - Overview
Molson Coors Beverage Co. - Business segments
Molson Coors Beverage Co. - Key news
Molson Coors Beverage Co. - Key offerings
Molson Coors Beverage Co. - Segment focus
SWOT

15.16 New Belgium Brewing Co. Inc.

New Belgium Brewing Co. Inc. - Overview
New Belgium Brewing Co. Inc. - Product / Service
New Belgium Brewing Co. Inc. - Key offerings
SWOT

15.17 Stone Brewing Co. LLC

Stone Brewing Co. LLC - Overview
Stone Brewing Co. LLC - Product / Service
Stone Brewing Co. LLC - Key offerings
SWOT

15.18 Suntory Beverage and Food Ltd.

Suntory Beverage and Food Ltd. - Overview
Suntory Beverage and Food Ltd. - Business segments
Suntory Beverage and Food Ltd. - Key news
Suntory Beverage and Food Ltd. - Key offerings
Suntory Beverage and Food Ltd. - Segment focus
SWOT

16. Appendix

16.1 Scope of the report

Market definition
Objectives
Notes and caveats

16.2 Inclusions and exclusions checklist

Inclusions checklist
Exclusions checklist

16.3 Currency conversion rates for US$

16.4 Research methodology

16.5 Data procurement

Information sources

16.6 Data validation

16.7 Validation techniques employed for market sizing

16.8 Data synthesis

16.9 360 degree market analysis

16.10 List of abbreviations

Research Methodology

Technavio presents a detailed picture of the market by way of study, synthesis, and summation of data from multiple sources. The analysts have presented the various facets of the market with a particular focus on identifying the key industry influencers. The data thus presented is comprehensive, reliable, and the result of extensive research, both primary and secondary.

INFORMATION SOURCES

Primary sources

  • Manufacturers and suppliers
  • Channel partners
  • Industry experts
  • Strategic decision makers

Secondary sources

  • Industry journals and periodicals
  • Government data
  • Financial reports of key industry players
  • Historical data
  • Press releases

DATA ANALYSIS

Data Synthesis

  • Collation of data
  • Estimation of key figures
  • Analysis of derived insights

Data Validation

  • Triangulation with data models
  • Reference against proprietary databases
  • Corroboration with industry experts

REPORT WRITING

Qualitative

  • Market drivers
  • Market challenges
  • Market trends
  • Five forces analysis

Quantitative

  • Market size and forecast
  • Market segmentation
  • Geographical insights
  • Competitive landscape

Interested in this report?

Get your sample now to see our research methodology and insights!

Download Now

Frequently Asked Questions

Alcoholic Beverages market growth will increase by USD 458.2 billion during 2026-2030.

The Alcoholic Beverages market is expected to grow at a CAGR of 3.4% during 2026-2030.

Alcoholic Beverages market is segmented by Product (Beer, Spirits, Wine) Distribution channel (Off-trade, On-trade) Type (Low alcohol, Medium alcohol, High alcohol)

Anheuser-Busch Companies, Asahi Group Holdings Ltd., Bells Brewery Inc., Campari Group, Carlsberg Breweries AS, Constellation Brands Inc., D.G. Yuengling and Son Inc., Deschutes Brewery, Diageo PLC, FIFCO USA, Heineken NV, Kirin Holdings Co. Ltd., Medusa Brewing Co, Molson Coors Beverage Co., New Belgium Brewing Co. Inc., Pernod Ricard SA, Stone Brewing Co. LLC, Suntory Beverage and Food Ltd., Treasury Wine Estates Ltd. are a few of the key vendors in the Alcoholic Beverages market.

APAC will register the highest growth rate of 29.2% among the other regions. Therefore, the Alcoholic Beverages market in APAC is expected to garner significant business opportunities for the vendors during the forecast period.

Germany, UK, France, Italy, Spain, The Netherlands, China, Japan, India, South Korea, Australia, Indonesia, US, Canada, Mexico, Brazil, Argentina, Colombia, Saudi Arabia, UAE, South Africa, Israel, Turkey

  • Increase in popularity of craft segment is the driving factor this market.

The Alcoholic Beverages market vendors should focus on grabbing business opportunities from the Product segment as it accounted for the largest market share in the base year.
RIA - Research AI Assistant
Ask RIA