Amlodipine Besylate Market Analysis, Size, and Forecast 2026-2030: North America (US, Canada, and Mexico), Europe (Germany, UK, and France), APAC (China, India, and Japan), South America (Brazil, Argentina, and Colombia), Middle East and Africa (Saudi Arabia, UAE, and Turkey), Asia, Rest of World (ROW)

Amlodipine Besylate Market Analysis, Size, and Forecast 2026-2030:
North America (US, Canada, and Mexico), Europe (Germany, UK, and France), APAC (China, India, and Japan), South America (Brazil, Argentina, and Colombia), Middle East and Africa (Saudi Arabia, UAE, and Turkey), Asia, Rest of World (ROW)

Published: May 2026 285 Pages SKU: IRTNTR73747

Market Overview at a Glance

$210.5 Mn
Market Opportunity
3.3%
CAGR 2025 - 2030
38.9%
North America Growth
$817.1 Mn
High blood pressure segment 2024

Amlodipine Besylate Market Size 2026-2030

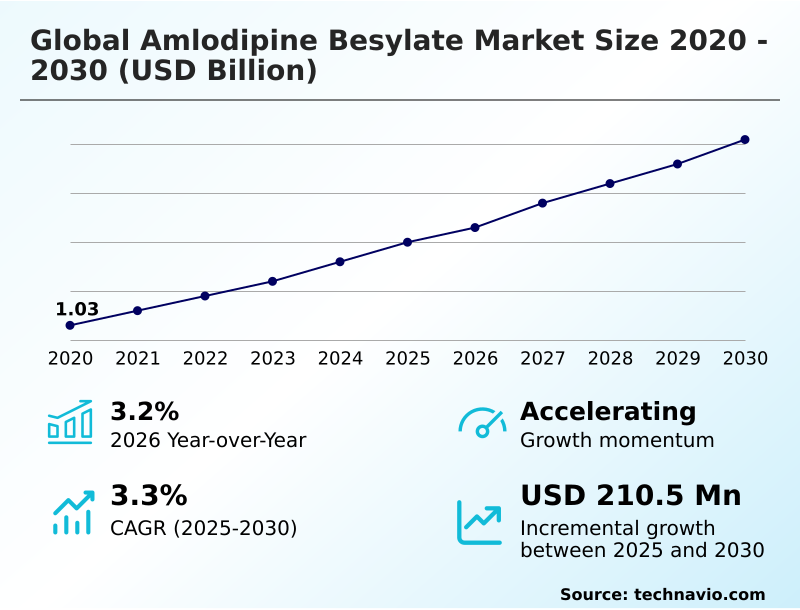
The Amlodipine Besylate Market size was valued at USD 1.20 billion in 2025, growing at a CAGR of 3.3% during the forecast period 2026-2030.

Major Market Trends & Insights

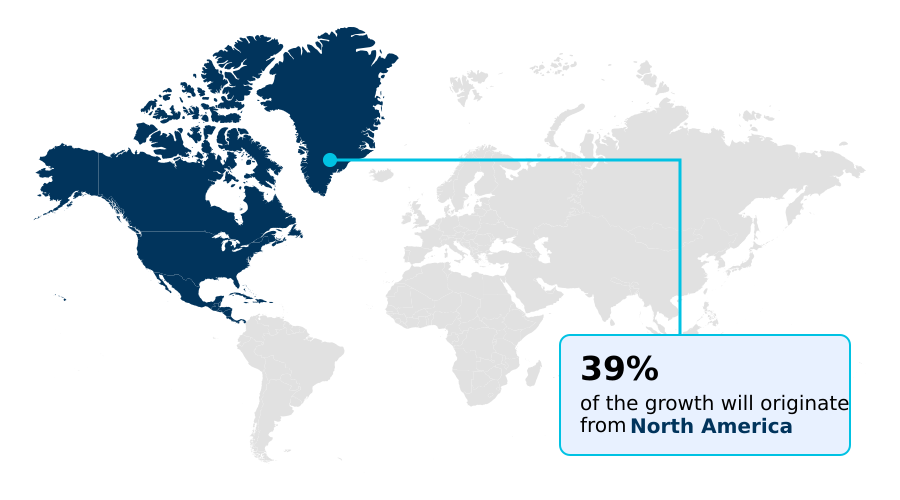
  • North America dominated the market and accounted for a 38.9% growth during the forecast period.
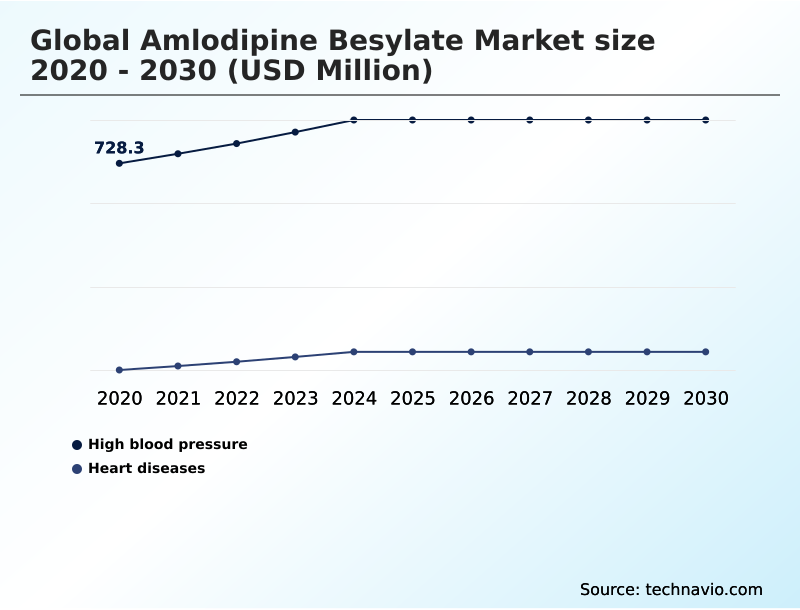
  • By Application - High blood pressure segment was valued at USD 817.1 million in 2024
  • By Type - Five mg tablets segment accounted for the largest market revenue share in 2024

Market Size & Forecast

  • Historic Market Opportunities 2020-2024: USD 373.6 million
  • Market Future Opportunities 2025-2030: USD 210.5 million
  • CAGR from 2025 to 2030 : 3.3%

Market Summary

  • The amlodipine besylate market demonstrates stable expansion, with its growth momentum accelerating due to its foundational role in cardiovascular therapy. This market grew by 3.2% year-over-year, reflecting its clinical necessity. A key driver is the rising global incidence of hypertension, which necessitates long-term, cost-effective treatments like amlodipine besylate.
  • Conversely, the market faces a significant challenge from intense price erosion, where commoditization squeezes profit margins by over 15% in some tendered contracts. A common operational scenario involves manufacturers optimizing their pharmaceutical supply chain to manage volatile raw material costs, which can fluctuate by up to 10% quarterly, while maintaining stringent regulatory compliance for this widely used generic formulation.
  • The medication's established efficacy and safety profile ensure its continued demand in public healthcare programs, even as companies navigate the competitive pressures of a mature market.

What will be the Size of the Amlodipine Besylate Market during the forecast period?

Get Key Insights on Market Forecast (PDF) Request Free Sample

How is the Amlodipine Besylate Market Segmented?

The amlodipine besylate industry research report provides comprehensive data (region-wise segment analysis), with forecasts and analysis for the period 2026-2030, as well as historical data from 2020-2024 for the following segments.

  • Application
    • High blood pressure
    • Heart diseases
  • Type
    • Five mg tablets
    • Ten mg tablets
    • Two and half mg tablets
  • End-user
    • Hospitals and clinics
    • Homecare
    • Public healthcare programs
  • Geography
    • North America
      • US
      • Canada
      • Mexico
    • Europe
      • Germany
      • UK
      • France
    • Asia
    • Rest of World (ROW)

How is the Amlodipine Besylate Market Segmented by Application?

The high blood pressure segment is estimated to witness significant growth during the forecast period.

The amlodipine besylate market is segmented by application and type, with the high blood pressure segment commanding over 70% of total revenue due to its status as a first-line antihypertensive therapy.

This dominance is reinforced by clinical guidelines that prioritize long-term blood pressure regulation. By type, the market is divided into dosage strengths, including two and a half mg, five mg, and ten mg tablets.

The five mg tablet segment is the largest, accounting for over 55% of the market, as it serves as the standard initial dose for most patients, enabling effective dosage titration.

This segmentation supports personalized treatment regimens, thereby improving patient adherence and overall clinical efficacy in managing cardiovascular risk.

Request Free Sample

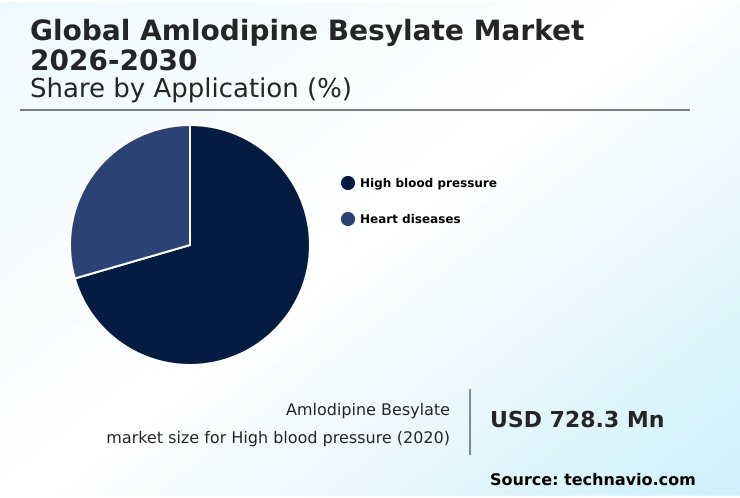
The High blood pressure segment was valued at USD 817.1 million in 2024 and showed a gradual increase during the forecast period.

Request Free Sample

How demand for the Amlodipine Besylate market is rising in the leading region?

North America is estimated to contribute 38.9% to the growth of the global market during the forecast period.Technavio’s analysts have elaborately explained the regional trends and drivers that shape the market during the forecast period.

See How Amlodipine Besylate Market demand is rising in North America Request Free Sample

North America leads the amlodipine besylate market, projected to capture 38.9% of the incremental growth, driven by high healthcare expenditure and established clinical guidelines.

The US dominates the region with a market size of USD 390.1 million in 2025, significantly larger than Canada's USD 68.3 million, reflecting disparities in population and prescription volumes.

In contrast, Asia is the fastest-growing region with a CAGR of 4.3%, fueled by expanding healthcare access and rising cardiovascular disease awareness in countries like China and India. This growth is nearly 1.6 percentage points higher than Europe's 2.7% CAGR.

This geographic variance compels companies to adapt their pharmaceutical supply chain strategies, focusing on high-volume, low-cost models for Asia while emphasizing value-based healthcare integration and regulatory compliance in North America.

What are the key Drivers, Trends, and Challenges in the Amlodipine Besylate Market?

Our researchers analyzed the data with 2025 as the base year, along with the key drivers, trends, and challenges. A holistic analysis of drivers will help companies refine their marketing strategies to gain a competitive advantage.

  • Understanding the amlodipine besylate mechanism of action is crucial for clinicians managing cardiovascular risk. This long-acting calcium antagonist induces vasodilation, a key benefit for patients seeking treatment with amlodipine besylate for high blood pressure. The choice of amlodipine dosage for chronic angina typically involves careful titration to balance clinical efficacy and patient tolerance.
  • When comparing amlodipine besylate vs other calcium channel blockers, its once-daily dosing and favorable pharmacokinetic profile often lead to better patient adherence, a critical factor in chronic disease management. A significant part of clinical practice involves managing side effects of amlodipine besylate, such as peripheral edema, to improve treatment continuity.
  • The market is also witnessing a significant shift toward amlodipine fixed-dose combination therapies, which are preferred by 30% more physicians for patients with comorbidities versus monotherapy. This trend, which simplifies treatment regimens, has driven a demand increase of over 15% in the last two years, directly impacting pharmaceutical manufacturing and API sourcing logistics.

What are the key market drivers leading to the rise in the adoption of Amlodipine Besylate Industry?

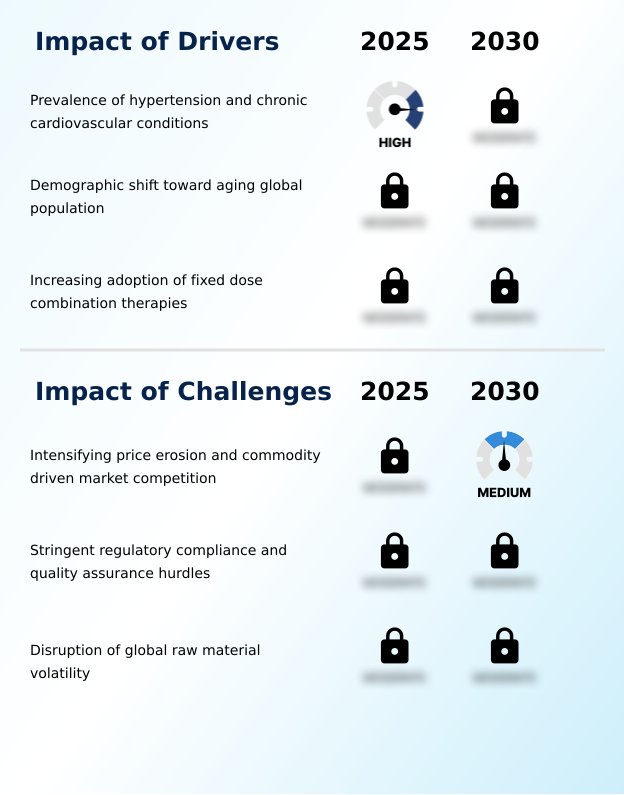
  • The rising prevalence of hypertension and other chronic cardiovascular conditions worldwide is the principal driver for the market.

  • The primary driver for the amlodipine besylate market is the escalating global prevalence of hypertension, which now affects approximately 1.4 billion people.
  • This growth is directly tied to demographic shifts toward aging populations and lifestyle changes, expanding the patient base for antihypertensive therapy.
  • The cost-effectiveness of generic amlodipine besylate makes it a preferred option in public healthcare programs, where it can reduce long-term treatment costs by up to 40% compared to newer, branded alternatives.
  • Its established clinical efficacy and safety profile, reinforced by extensive clinical guidelines, secure its role as a first-line treatment, supporting high prescription volumes.

What are the market trends shaping the Amlodipine Besylate Industry?

  • The integration of digital health solutions and remote patient monitoring systems is emerging as a significant trend. This shift enhances chronic disease management by enabling real-time data collection and personalized therapeutic adjustments.

  • A pivotal trend in the amlodipine besylate market is the integration of digital health technologies for remote patient monitoring. This shift enables continuous blood pressure tracking, resulting in a 20% improvement in medication adherence for patients using connected devices compared to traditional regimens.
  • The adoption of these systems facilitates more precise dosage titration, as clinicians can adjust treatments based on real-time data, reducing the incidence of adverse cardiovascular events by an estimated 15%. This synergy between a core therapeutic agent and digital platforms is redefining chronic disease management and pushing pharmaceutical companies to align with integrated value-based healthcare ecosystems.

What challenges does the Amlodipine Besylate Industry face during its growth?

  • Intensifying price erosion, fueled by a commodity-driven market environment, presents a primary challenge to industry profitability and sustainable growth.

  • The most significant challenge in the amlodipine besylate market is severe price erosion from market commoditization, with generic formulations seeing annual price declines of up to 10% in competitive tender markets. This intense competition, driven by a multitude of manufacturers, compresses profit margins and restricts funds for reinvestment in quality and supply chain enhancements.
  • Producers often operate on margins as low as 5%, making the business highly volume-dependent and susceptible to disruptions in API sourcing or logistics. Pressure from large institutional buyers and government procurement programs exacerbates this challenge, forcing companies to prioritize operational efficiency over innovation.

Exclusive Technavio Analysis on Customer Landscape

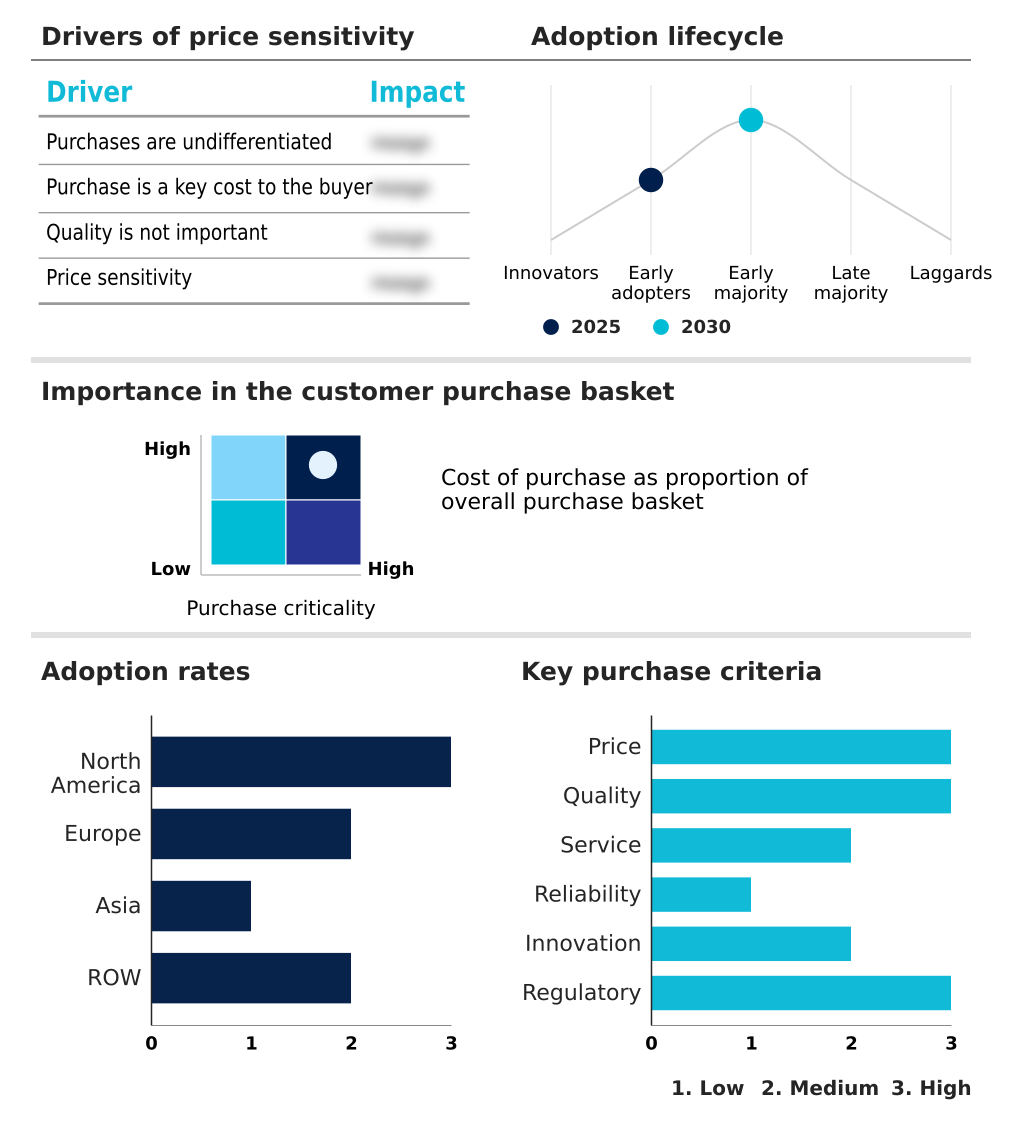
The amlodipine besylate market forecasting report includes the adoption lifecycle of the market, covering from the innovator’s stage to the laggard’s stage. It focuses on adoption rates in different regions based on penetration. Furthermore, the amlodipine besylate market report also includes key purchase criteria and drivers of price sensitivity to help companies evaluate and develop their market growth analysis strategies.

Customer Landscape of Amlodipine Besylate Industry

Competitive Landscape

Companies are implementing various strategies, such as strategic alliances, amlodipine besylate market forecast, partnerships, mergers and acquisitions, geographical expansion, and product/service launches, to enhance their presence in the industry.

AdvaCare Pharma - Key offerings center on amlodipine besylate tablets in various dosages, a cornerstone therapeutic agent for managing hypertension and coronary artery disease through effective blood pressure regulation.

The industry research and growth report includes detailed analyses of the competitive landscape of the market and information about key companies, including:

  • AdvaCare Pharma
  • Aetos Lifecare Pvt. Ltd.
  • Apotex Inc.
  • Aurobindo Pharma Ltd.
  • Cadila Pharmaceuticals Ltd.
  • Century Pharmaceuticals Ltd.
  • Cipla Inc.
  • Daiichi Sankyo Co. Ltd.
  • Dr. Reddys Laboratories Ltd.
  • Glenmark Pharmaceuticals Ltd.
  • Intas Pharmaceuticals Ltd.
  • Lupin Ltd.
  • Orbion Pharmaceuticals Pvt. Ltd.
  • Pfizer Inc.
  • Sandoz Group AG
  • Taj Pharmaceutical Ltd.
  • Teva Pharmaceutical Ltd.
  • Viatris Inc.
  • Wellona Pharma
  • Zydus Lifesciences Ltd.

Qualitative and quantitative analysis of companies has been conducted to help clients understand the wider business environment as well as the strengths and weaknesses of key industry players. Data is qualitatively analyzed to categorize companies as pure play, category-focused, industry-focused, and diversified; it is quantitatively analyzed to categorize companies as dominant, leading, strong, tentative, and weak.

Market Intelligence Radar: High-Impact Developments & Growth Signals

  • In the Pharmaceuticals industry, a heightened focus on supply chain resilience and sustainable manufacturing is compelling producers of generic drugs, including amlodipine besylate, to diversify active pharmaceutical ingredient (API) sourcing and adopt greener production methods to mitigate geopolitical risks and meet ESG mandates.
  • The widespread integration of digital health technologies and remote patient monitoring systems into chronic disease management frameworks is reshaping how amlodipine besylate is prescribed and managed, linking the therapeutic agent directly to data-driven, value-based healthcare models.
  • Evolving regulatory frameworks, such as the European Shortages Monitoring Platform, are imposing stricter requirements for supply and demand reporting, directly impacting the operational planning and regulatory compliance burden for manufacturers in the commoditized amlodipine besylate market.
  • There is an increasing clinical and commercial shift toward fixed-dose combination therapies, which pair established molecules like amlodipine besylate with other cardiovascular drugs, influencing R&D pipelines and market strategies away from monotherapy products.

Dive into Technavio’s robust research methodology, blending expert interviews, extensive data synthesis, and validated models for unparalleled Amlodipine Besylate Market insights. See full methodology.

Market Scope
Page number 285
Base year 2025
Historic period 2020-2024
Forecast period 2026-2030
Growth momentum & CAGR Accelerate at a CAGR of 3.3%
Market growth 2026-2030 USD 210.5 million
Market structure Fragmented
YoY growth 2025-2026(%) 3.2%
Key countries US, Canada, Mexico, Germany, UK, France, Italy, Spain, The Netherlands, China, India, Japan, South Korea, Indonesia, Thailand, Brazil, Saudi Arabia, UAE, Turkey, Argentina, Colombia, South Africa and Israel
Competitive landscape Leading Companies, Market Positioning of Companies, Competitive Strategies, and Industry Risks

Request Free Sample

Research Analyst Overview

  • The amlodipine besylate market ecosystem is a complex network where generic formulations drive over 80% of the market volume. The value chain originates with active pharmaceutical ingredient (API) suppliers, predominantly in Asia, who must meet stringent quality assurance standards from global pharmaceutical manufacturers. These producers, ranging from large multinationals to smaller regional firms, create the final dosage forms.
  • Distribution is handled through hospital pharmacies, retail chains, and public healthcare programs, serving patients with hypertension and heart disease. Regulatory bodies like the FDA and EMA enforce good manufacturing practice and bioequivalence, creating significant entry barriers.
  • The ecosystem's efficiency relies on a coordinated pharmaceutical supply chain, where large buyers leverage their purchasing power, contributing to an environment of sustained price erosion.

What are the Key Data Covered in this Amlodipine Besylate Market Research and Growth Report?

  • What is the expected growth of the Amlodipine Besylate Market between 2026 and 2030?

    • The Amlodipine Besylate Market is expected to grow by USD 210.5 million during 2026-2030, registering a CAGR of 3.3%. Year-over-year growth in 2026 is estimated at 3.2%%. This acceleration is shaped by prevalence of hypertension and chronic cardiovascular conditions, which is intensifying demand across multiple end-use verticals covered in the report.

  • What segmentation does the market report cover?

    • The report is segmented by Application (High blood pressure, and Heart diseases), Type (Five mg tablets, Ten mg tablets, and Two and half mg tablets), End-user (Hospitals and clinics, Homecare, and Public healthcare programs) and Geography (North America, Europe, Asia, Rest of World (ROW)). Among these, the High blood pressure segment is estimated to witness significant growth during the forecast period, driven by rising adoption across key application areas. Each segment includes detailed qualitative and quantitative analysis, along with historical data from 2020-2024 and forecasts through 2030 with year-over-year growth rates.

  • Which regions are analyzed in the report?

    • The report covers North America, Europe, Asia and Rest of World (ROW). North America is estimated to contribute 38.9% to market growth during the forecast period. Country-level analysis includes US, Canada, Mexico, Germany, UK, France, Italy, Spain, The Netherlands, China, India, Japan, South Korea, Indonesia, Thailand, Brazil, Saudi Arabia, UAE, Turkey, Argentina, Colombia, South Africa and Israel, with dedicated market size tables and year-over-year growth for each.

  • What are the key growth drivers and market challenges?

    • The primary driver is prevalence of hypertension and chronic cardiovascular conditions, which is accelerating investment and industry demand. The main challenge is intensifying price erosion and commodity driven market competition, creating operational barriers for key market participants. The report quantifies the impact of each driver and challenge across 2026 and 2030 with comparative analysis.

  • Who are the major players in the Amlodipine Besylate Market?

    • Key vendors include AdvaCare Pharma, Aetos Lifecare Pvt. Ltd., Apotex Inc., Aurobindo Pharma Ltd., Cadila Pharmaceuticals Ltd., Century Pharmaceuticals Ltd., Cipla Inc., Daiichi Sankyo Co. Ltd., Dr. Reddys Laboratories Ltd., Glenmark Pharmaceuticals Ltd., Intas Pharmaceuticals Ltd., Lupin Ltd., Orbion Pharmaceuticals Pvt. Ltd., Pfizer Inc., Sandoz Group AG, Taj Pharmaceutical Ltd., Teva Pharmaceutical Ltd., Viatris Inc., Wellona Pharma and Zydus Lifesciences Ltd.. The report provides qualitative and quantitative analysis categorizing companies as dominant, leading, strong, tentative, and weak based on their market positioning. Company profiles include business segment analysis, SWOT assessment, key offerings, and recent strategic developments.

Market Research Insights

  • The competitive landscape of the amlodipine besylate market is intensely fragmented, with North America contributing 38.9% of the market’s incremental growth. Key vendors such as Pfizer, Sandoz, and Viatris utilize extensive distribution networks, while generic manufacturers including Aurobindo Pharma and Cipla compete fiercely on price. These firms focus on optimizing manufacturing scale and securing API sourcing to counter market commoditization.
  • Recent developments indicate a strategic pivot to fixed-dose combinations, which show a 15% higher adoption rate in certain demographics compared to monotherapies, as a method to differentiate products and enhance patient adherence.
  • This evolution addresses the challenge of price erosion, where margins on standalone amlodipine are notably thin, prompting companies to innovate in drug formulation and expand into value-added therapeutic agents.

We can help! Our analysts can customize this amlodipine besylate market research report to meet your requirements.

Get in touch

1. Executive Summary

1.1 Market overview

Executive Summary - Chart on Market Overview
Executive Summary - Data Table on Market Overview
Executive Summary - Chart on Global Market Characteristics
Executive Summary - Chart on Market by Geography
Executive Summary - Chart on Market Segmentation by Application
Executive Summary - Chart on Market Segmentation by Type
Executive Summary - Chart on Market Segmentation by End-user
Executive Summary - Chart on Incremental Growth
Executive Summary - Data Table on Incremental Growth
Executive Summary - Chart on Company Market Positioning

2. Technavio Analysis

2.1 Analysis of price sensitivity, lifecycle, customer purchase basket, adoption rates, and purchase criteria

2.2 Criticality of inputs and Factors of differentiation

Chart on Overview on criticality of inputs and factors of differentiation

2.3 Factors of disruption

Chart on Overview on factors of disruption

2.4 Impact of drivers and challenges

Chart on Impact of drivers and challenges in 2025 and 2030

3. Market Landscape

3.1 Market ecosystem

Chart on Parent Market
Data Table on - Parent Market

3.2 Market characteristics

Chart on Market characteristics analysis

3.3 Value chain analysis

Chart on Value chain analysis

4. Market Sizing

4.1 Market definition

Data Table on Offerings of companies included in the market definition

4.2 Market segment analysis

Market segments

4.3 Market size 2025

4.4 Market outlook: Forecast for 2025-2030

Chart on Global - Market size and forecast 2025-2030 ($ million)
Data Table on Global - Market size and forecast 2025-2030 ($ million)
Chart on Global Market: Year-over-year growth 2025-2030 (%)
Data Table on Global Market: Year-over-year growth 2025-2030 (%)

5. Historic Market Size

5.1 Global Amlodipine Besylate Market 2020 - 2024

Historic Market Size - Data Table on Global Amlodipine Besylate Market 2020 - 2024 ($ million)

5.2 Application segment analysis 2020 - 2024

Historic Market Size - Application Segment 2020 - 2024 ($ million)

5.3 Type segment analysis 2020 - 2024

Historic Market Size - Type Segment 2020 - 2024 ($ million)

5.4 End-user segment analysis 2020 - 2024

Historic Market Size - End-user Segment 2020 - 2024 ($ million)

5.5 Geography segment analysis 2020 - 2024

Historic Market Size - Geography Segment 2020 - 2024 ($ million)

5.6 Country segment analysis 2020 - 2024

Historic Market Size - Country Segment 2020 - 2024 ($ million)

6. Qualitative Analysis

6.1 Impact of AI in global amlodipine besylate market

6.2 Impact of geopolitical conflict for global amlodipine besylate market

7. Five Forces Analysis

7.1 Five forces summary

Five forces analysis - Comparison between 2025 and 2030

7.2 Bargaining power of buyers

Bargaining power of buyers - Impact of key factors 2025 and 2030

7.3 Bargaining power of suppliers

Bargaining power of suppliers - Impact of key factors in 2025 and 2030

7.4 Threat of new entrants

Threat of new entrants - Impact of key factors in 2025 and 2030

7.5 Threat of substitutes

Threat of substitutes - Impact of key factors in 2025 and 2030

7.6 Threat of rivalry

Threat of rivalry - Impact of key factors in 2025 and 2030

7.7 Market condition

Chart on Market condition - Five forces 2025 and 2030

8. Market Segmentation by Application

8.1 Market segments

Chart on Application - Market share 2025-2030 (%)
Data Table on Application - Market share 2025-2030 (%)

8.2 Comparison by Application

Chart on Comparison by Application
Data Table on Comparison by Application

8.3 High blood pressure - Market size and forecast 2025-2030

Chart on High blood pressure - Market size and forecast 2025-2030 ($ million)
Data Table on High blood pressure - Market size and forecast 2025-2030 ($ million)
Chart on High blood pressure - Year-over-year growth 2025-2030 (%)
Data Table on High blood pressure - Year-over-year growth 2025-2030 (%)

8.4 Heart diseases - Market size and forecast 2025-2030

Chart on Heart diseases - Market size and forecast 2025-2030 ($ million)
Data Table on Heart diseases - Market size and forecast 2025-2030 ($ million)
Chart on Heart diseases - Year-over-year growth 2025-2030 (%)
Data Table on Heart diseases - Year-over-year growth 2025-2030 (%)

8.5 Market opportunity by Application

Market opportunity by Application ($ million)
Data Table on Market opportunity by Application ($ million)

9. Market Segmentation by Type

9.1 Market segments

Chart on Type - Market share 2025-2030 (%)
Data Table on Type - Market share 2025-2030 (%)

9.2 Comparison by Type

Chart on Comparison by Type
Data Table on Comparison by Type

9.3 Five mg tablets - Market size and forecast 2025-2030

Chart on Five mg tablets - Market size and forecast 2025-2030 ($ million)
Data Table on Five mg tablets - Market size and forecast 2025-2030 ($ million)
Chart on Five mg tablets - Year-over-year growth 2025-2030 (%)
Data Table on Five mg tablets - Year-over-year growth 2025-2030 (%)

9.4 Ten mg tablets - Market size and forecast 2025-2030

Chart on Ten mg tablets - Market size and forecast 2025-2030 ($ million)
Data Table on Ten mg tablets - Market size and forecast 2025-2030 ($ million)
Chart on Ten mg tablets - Year-over-year growth 2025-2030 (%)
Data Table on Ten mg tablets - Year-over-year growth 2025-2030 (%)

9.5 Two and half mg tablets - Market size and forecast 2025-2030

Chart on Two and half mg tablets - Market size and forecast 2025-2030 ($ million)
Data Table on Two and half mg tablets - Market size and forecast 2025-2030 ($ million)
Chart on Two and half mg tablets - Year-over-year growth 2025-2030 (%)
Data Table on Two and half mg tablets - Year-over-year growth 2025-2030 (%)

9.6 Market opportunity by Type

Market opportunity by Type ($ million)
Data Table on Market opportunity by Type ($ million)

10. Market Segmentation by End-user

10.1 Market segments

Chart on End-user - Market share 2025-2030 (%)
Data Table on End-user - Market share 2025-2030 (%)

10.2 Comparison by End-user

Chart on Comparison by End-user
Data Table on Comparison by End-user

10.3 Hospitals and clinics - Market size and forecast 2025-2030

Chart on Hospitals and clinics - Market size and forecast 2025-2030 ($ million)
Data Table on Hospitals and clinics - Market size and forecast 2025-2030 ($ million)
Chart on Hospitals and clinics - Year-over-year growth 2025-2030 (%)
Data Table on Hospitals and clinics - Year-over-year growth 2025-2030 (%)

10.4 Homecare - Market size and forecast 2025-2030

Chart on Homecare - Market size and forecast 2025-2030 ($ million)
Data Table on Homecare - Market size and forecast 2025-2030 ($ million)
Chart on Homecare - Year-over-year growth 2025-2030 (%)
Data Table on Homecare - Year-over-year growth 2025-2030 (%)

10.5 Public healthcare programs - Market size and forecast 2025-2030

Chart on Public healthcare programs - Market size and forecast 2025-2030 ($ million)
Data Table on Public healthcare programs - Market size and forecast 2025-2030 ($ million)
Chart on Public healthcare programs - Year-over-year growth 2025-2030 (%)
Data Table on Public healthcare programs - Year-over-year growth 2025-2030 (%)

10.6 Market opportunity by End-user

Market opportunity by End-user ($ million)
Data Table on Market opportunity by End-user ($ million)

11. Customer Landscape

11.1 Customer landscape overview

Analysis of price sensitivity, lifecycle, customer purchase basket, adoption rates, and purchase criteria

12. Geographic Landscape

12.1 Geographic segmentation

Chart on Market share by geography 2025-2030 (%)
Data Table on Market share by geography 2025-2030 (%)

12.2 Geographic comparison

Chart on Geographic comparison
Data Table on Geographic comparison

12.3 North America - Market size and forecast 2025-2030

Chart on North America - Market size and forecast 2025-2030 ($ million)
Data Table on North America - Market size and forecast 2025-2030 ($ million)
Chart on North America - Year-over-year growth 2025-2030 (%)
Data Table on North America - Year-over-year growth 2025-2030 (%)
Chart on Regional Comparison - North America
Data Table on Regional Comparison - North America

12.3.1 US - Market size and forecast 2025-2030

Chart on US - Market size and forecast 2025-2030 ($ million)
Data Table on US - Market size and forecast 2025-2030 ($ million)
Chart on US - Year-over-year growth 2025-2030 (%)
Data Table on US - Year-over-year growth 2025-2030 (%)

12.3.2 Canada - Market size and forecast 2025-2030

Chart on Canada - Market size and forecast 2025-2030 ($ million)
Data Table on Canada - Market size and forecast 2025-2030 ($ million)
Chart on Canada - Year-over-year growth 2025-2030 (%)
Data Table on Canada - Year-over-year growth 2025-2030 (%)

12.3.3 Mexico - Market size and forecast 2025-2030

Chart on Mexico - Market size and forecast 2025-2030 ($ million)
Data Table on Mexico - Market size and forecast 2025-2030 ($ million)
Chart on Mexico - Year-over-year growth 2025-2030 (%)
Data Table on Mexico - Year-over-year growth 2025-2030 (%)

12.4 Europe - Market size and forecast 2025-2030

Chart on Europe - Market size and forecast 2025-2030 ($ million)
Data Table on Europe - Market size and forecast 2025-2030 ($ million)
Chart on Europe - Year-over-year growth 2025-2030 (%)
Data Table on Europe - Year-over-year growth 2025-2030 (%)
Chart on Regional Comparison - Europe
Data Table on Regional Comparison - Europe

12.4.1 Germany - Market size and forecast 2025-2030

Chart on Germany - Market size and forecast 2025-2030 ($ million)
Data Table on Germany - Market size and forecast 2025-2030 ($ million)
Chart on Germany - Year-over-year growth 2025-2030 (%)
Data Table on Germany - Year-over-year growth 2025-2030 (%)

12.4.2 UK - Market size and forecast 2025-2030

Chart on UK - Market size and forecast 2025-2030 ($ million)
Data Table on UK - Market size and forecast 2025-2030 ($ million)
Chart on UK - Year-over-year growth 2025-2030 (%)
Data Table on UK - Year-over-year growth 2025-2030 (%)

12.4.3 France - Market size and forecast 2025-2030

Chart on France - Market size and forecast 2025-2030 ($ million)
Data Table on France - Market size and forecast 2025-2030 ($ million)
Chart on France - Year-over-year growth 2025-2030 (%)
Data Table on France - Year-over-year growth 2025-2030 (%)

12.4.4 Italy - Market size and forecast 2025-2030

Chart on Italy - Market size and forecast 2025-2030 ($ million)
Data Table on Italy - Market size and forecast 2025-2030 ($ million)
Chart on Italy - Year-over-year growth 2025-2030 (%)
Data Table on Italy - Year-over-year growth 2025-2030 (%)

12.4.5 Spain - Market size and forecast 2025-2030

Chart on Spain - Market size and forecast 2025-2030 ($ million)
Data Table on Spain - Market size and forecast 2025-2030 ($ million)
Chart on Spain - Year-over-year growth 2025-2030 (%)
Data Table on Spain - Year-over-year growth 2025-2030 (%)

12.4.6 The Netherlands - Market size and forecast 2025-2030

Chart on The Netherlands - Market size and forecast 2025-2030 ($ million)
Data Table on The Netherlands - Market size and forecast 2025-2030 ($ million)
Chart on The Netherlands - Year-over-year growth 2025-2030 (%)
Data Table on The Netherlands - Year-over-year growth 2025-2030 (%)

12.5 Asia - Market size and forecast 2025-2030

Chart on Asia - Market size and forecast 2025-2030 ($ million)
Data Table on Asia - Market size and forecast 2025-2030 ($ million)
Chart on Asia - Year-over-year growth 2025-2030 (%)
Data Table on Asia - Year-over-year growth 2025-2030 (%)
Chart on Regional Comparison - Asia
Data Table on Regional Comparison - Asia

12.5.1 China - Market size and forecast 2025-2030

Chart on China - Market size and forecast 2025-2030 ($ million)
Data Table on China - Market size and forecast 2025-2030 ($ million)
Chart on China - Year-over-year growth 2025-2030 (%)
Data Table on China - Year-over-year growth 2025-2030 (%)

12.5.2 India - Market size and forecast 2025-2030

Chart on India - Market size and forecast 2025-2030 ($ million)
Data Table on India - Market size and forecast 2025-2030 ($ million)
Chart on India - Year-over-year growth 2025-2030 (%)
Data Table on India - Year-over-year growth 2025-2030 (%)

12.5.3 Japan - Market size and forecast 2025-2030

Chart on Japan - Market size and forecast 2025-2030 ($ million)
Data Table on Japan - Market size and forecast 2025-2030 ($ million)
Chart on Japan - Year-over-year growth 2025-2030 (%)
Data Table on Japan - Year-over-year growth 2025-2030 (%)

12.5.4 South Korea - Market size and forecast 2025-2030

Chart on South Korea - Market size and forecast 2025-2030 ($ million)
Data Table on South Korea - Market size and forecast 2025-2030 ($ million)
Chart on South Korea - Year-over-year growth 2025-2030 (%)
Data Table on South Korea - Year-over-year growth 2025-2030 (%)

12.5.5 Indonesia - Market size and forecast 2025-2030

Chart on Indonesia - Market size and forecast 2025-2030 ($ million)
Data Table on Indonesia - Market size and forecast 2025-2030 ($ million)
Chart on Indonesia - Year-over-year growth 2025-2030 (%)
Data Table on Indonesia - Year-over-year growth 2025-2030 (%)

12.5.6 Thailand - Market size and forecast 2025-2030

Chart on Thailand - Market size and forecast 2025-2030 ($ million)
Data Table on Thailand - Market size and forecast 2025-2030 ($ million)
Chart on Thailand - Year-over-year growth 2025-2030 (%)
Data Table on Thailand - Year-over-year growth 2025-2030 (%)

12.6 Rest of World (ROW) - Market size and forecast 2025-2030

Chart on Rest of World (ROW) - Market size and forecast 2025-2030 ($ million)
Data Table on Rest of World (ROW) - Market size and forecast 2025-2030 ($ million)
Chart on Rest of World (ROW) - Year-over-year growth 2025-2030 (%)
Data Table on Rest of World (ROW) - Year-over-year growth 2025-2030 (%)
Chart on Regional Comparison - Rest of World (ROW)
Data Table on Regional Comparison - Rest of World (ROW)

12.6.1 Brazil - Market size and forecast 2025-2030

Chart on Brazil - Market size and forecast 2025-2030 ($ million)
Data Table on Brazil - Market size and forecast 2025-2030 ($ million)
Chart on Brazil - Year-over-year growth 2025-2030 (%)
Data Table on Brazil - Year-over-year growth 2025-2030 (%)

12.6.2 Saudi Arabia - Market size and forecast 2025-2030

Chart on Saudi Arabia - Market size and forecast 2025-2030 ($ million)
Data Table on Saudi Arabia - Market size and forecast 2025-2030 ($ million)
Chart on Saudi Arabia - Year-over-year growth 2025-2030 (%)
Data Table on Saudi Arabia - Year-over-year growth 2025-2030 (%)

12.6.3 UAE - Market size and forecast 2025-2030

Chart on UAE - Market size and forecast 2025-2030 ($ million)
Data Table on UAE - Market size and forecast 2025-2030 ($ million)
Chart on UAE - Year-over-year growth 2025-2030 (%)
Data Table on UAE - Year-over-year growth 2025-2030 (%)

12.6.4 Turkey - Market size and forecast 2025-2030

Chart on Turkey - Market size and forecast 2025-2030 ($ million)
Data Table on Turkey - Market size and forecast 2025-2030 ($ million)
Chart on Turkey - Year-over-year growth 2025-2030 (%)
Data Table on Turkey - Year-over-year growth 2025-2030 (%)

12.6.5 Argentina - Market size and forecast 2025-2030

Chart on Argentina - Market size and forecast 2025-2030 ($ million)
Data Table on Argentina - Market size and forecast 2025-2030 ($ million)
Chart on Argentina - Year-over-year growth 2025-2030 (%)
Data Table on Argentina - Year-over-year growth 2025-2030 (%)

12.6.6 Colombia - Market size and forecast 2025-2030

Chart on Colombia - Market size and forecast 2025-2030 ($ million)
Data Table on Colombia - Market size and forecast 2025-2030 ($ million)
Chart on Colombia - Year-over-year growth 2025-2030 (%)
Data Table on Colombia - Year-over-year growth 2025-2030 (%)

12.6.7 South Africa - Market size and forecast 2025-2030

Chart on South Africa - Market size and forecast 2025-2030 ($ million)
Data Table on South Africa - Market size and forecast 2025-2030 ($ million)
Chart on South Africa - Year-over-year growth 2025-2030 (%)
Data Table on South Africa - Year-over-year growth 2025-2030 (%)

12.6.8 Israel - Market size and forecast 2025-2030

Chart on Israel - Market size and forecast 2025-2030 ($ million)
Data Table on Israel - Market size and forecast 2025-2030 ($ million)
Chart on Israel - Year-over-year growth 2025-2030 (%)
Data Table on Israel - Year-over-year growth 2025-2030 (%)

12.7 Market opportunity by geography

Market opportunity by geography ($ million)
Data Tables on Market opportunity by geography ($ million)

13. Drivers, Challenges, and Opportunity

13.1 Market drivers

Prevalence of hypertension and chronic cardiovascular conditions
Demographic shift toward aging global population
Increasing adoption of fixed dose combination therapies

13.2 Market challenges

Intensifying price erosion and commodity driven market competition
Stringent regulatory compliance and quality assurance hurdles
Disruption of global raw material volatility

13.3 Impact of drivers and challenges

Impact of drivers and challenges in 2025 and 2030

13.4 Market opportunities

Integration of digital health and remote patient monitoring
Strategic emphasis on supply chain resilience and sustainable manufacturing
Regulatory frameworks and price control policies impacting market dynamics

14. Competitive Landscape

14.1 Overview

14.2

Overview on criticality of inputs and factors of differentiation

14.3 Landscape disruption

Overview on factors of disruption

14.4 Industry risks

Impact of key risks on business

15. Competitive Analysis

15.1 Companies profiled

Companies covered

15.2 Company ranking index

15.3 Market positioning of companies

Matrix on companies position and classification

15.4 Apotex Inc.

Apotex Inc. - Overview
Apotex Inc. - Product / Service
Apotex Inc. - Key offerings
SWOT

15.5 Aurobindo Pharma Ltd.

Aurobindo Pharma Ltd. - Overview
Aurobindo Pharma Ltd. - Business segments
Aurobindo Pharma Ltd. - Key news
Aurobindo Pharma Ltd. - Key offerings
Aurobindo Pharma Ltd. - Segment focus
SWOT

15.6 Cadila Pharmaceuticals Ltd.

Cadila Pharmaceuticals Ltd. - Overview
Cadila Pharmaceuticals Ltd. - Product / Service
Cadila Pharmaceuticals Ltd. - Key offerings
SWOT

15.7 Cipla Inc.

Cipla Inc. - Overview
Cipla Inc. - Business segments
Cipla Inc. - Key news
Cipla Inc. - Key offerings
Cipla Inc. - Segment focus
SWOT

15.8 Daiichi Sankyo Co. Ltd.

Daiichi Sankyo Co. Ltd. - Overview
Daiichi Sankyo Co. Ltd. - Business segments
Daiichi Sankyo Co. Ltd. - Key news
Daiichi Sankyo Co. Ltd. - Key offerings
Daiichi Sankyo Co. Ltd. - Segment focus
SWOT

15.9 Dr. Reddys Laboratories Ltd.

Dr. Reddys Laboratories Ltd. - Overview
Dr. Reddys Laboratories Ltd. - Business segments
Dr. Reddys Laboratories Ltd. - Key news
Dr. Reddys Laboratories Ltd. - Key offerings
Dr. Reddys Laboratories Ltd. - Segment focus
SWOT

15.10 Glenmark Pharmaceuticals Ltd.

Glenmark Pharmaceuticals Ltd. - Overview
Glenmark Pharmaceuticals Ltd. - Product / Service
Glenmark Pharmaceuticals Ltd. - Key news
Glenmark Pharmaceuticals Ltd. - Key offerings
SWOT

15.11 Intas Pharmaceuticals Ltd.

Intas Pharmaceuticals Ltd. - Overview
Intas Pharmaceuticals Ltd. - Product / Service
Intas Pharmaceuticals Ltd. - Key offerings
SWOT

15.12 Lupin Ltd.

Lupin Ltd. - Overview
Lupin Ltd. - Business segments
Lupin Ltd. - Key news
Lupin Ltd. - Key offerings
Lupin Ltd. - Segment focus
SWOT

15.13 Orbion Pharmaceuticals Pvt. Ltd.

Orbion Pharmaceuticals Pvt. Ltd. - Overview
Orbion Pharmaceuticals Pvt. Ltd. - Product / Service
Orbion Pharmaceuticals Pvt. Ltd. - Key offerings
SWOT

15.14 Pfizer Inc.

Pfizer Inc. - Overview
Pfizer Inc. - Business segments
Pfizer Inc. - Key news
Pfizer Inc. - Key offerings
Pfizer Inc. - Segment focus
SWOT

15.15 Sandoz Group AG

Sandoz Group AG - Overview
Sandoz Group AG - Business segments
Sandoz Group AG - Key news
Sandoz Group AG - Key offerings
Sandoz Group AG - Segment focus
SWOT

15.16 Teva Pharmaceutical Ltd.

Teva Pharmaceutical Ltd. - Overview
Teva Pharmaceutical Ltd. - Business segments
Teva Pharmaceutical Ltd. - Key news
Teva Pharmaceutical Ltd. - Key offerings
Teva Pharmaceutical Ltd. - Segment focus
SWOT

15.17 Viatris Inc.

Viatris Inc. - Overview
Viatris Inc. - Business segments
Viatris Inc. - Key news
Viatris Inc. - Key offerings
Viatris Inc. - Segment focus
SWOT

15.18 Zydus Lifesciences Ltd.

Zydus Lifesciences Ltd. - Overview
Zydus Lifesciences Ltd. - Business segments
Zydus Lifesciences Ltd. - Key news
Zydus Lifesciences Ltd. - Key offerings
Zydus Lifesciences Ltd. - Segment focus
SWOT

16. Appendix

16.1 Scope of the report

Market definition
Objectives
Notes and caveats

16.2 Inclusions and exclusions checklist

Inclusions checklist
Exclusions checklist

16.3 Currency conversion rates for US$

16.4 Research methodology

16.5 Data procurement

Information sources

16.6 Data validation

16.7 Validation techniques employed for market sizing

16.8 Data synthesis

16.9 360 degree market analysis

16.10 List of abbreviations

Research Methodology

Technavio presents a detailed picture of the market by way of study, synthesis, and summation of data from multiple sources. The analysts have presented the various facets of the market with a particular focus on identifying the key industry influencers. The data thus presented is comprehensive, reliable, and the result of extensive research, both primary and secondary.

INFORMATION SOURCES

Primary sources

  • Manufacturers and suppliers
  • Channel partners
  • Industry experts
  • Strategic decision makers

Secondary sources

  • Industry journals and periodicals
  • Government data
  • Financial reports of key industry players
  • Historical data
  • Press releases

DATA ANALYSIS

Data Synthesis

  • Collation of data
  • Estimation of key figures
  • Analysis of derived insights

Data Validation

  • Triangulation with data models
  • Reference against proprietary databases
  • Corroboration with industry experts

REPORT WRITING

Qualitative

  • Market drivers
  • Market challenges
  • Market trends
  • Five forces analysis

Quantitative

  • Market size and forecast
  • Market segmentation
  • Geographical insights
  • Competitive landscape

Interested in this report?

Get your sample now to see our research methodology and insights!

Download Now

Frequently Asked Questions

Amlodipine Besylate market growth will increase by USD 210.5 million during 2026-2030.

The Amlodipine Besylate market is expected to grow at a CAGR of 3.3% during 2026-2030.

Amlodipine Besylate market is segmented by Application (High blood pressure, Heart diseases) Type (Five mg tablets, Ten mg tablets, Two and half mg tablets) End-user (Hospitals and clinics, Homecare, Public healthcare programs)

AdvaCare Pharma, Aetos Lifecare Pvt. Ltd., Apotex Inc., Aurobindo Pharma Ltd., Cadila Pharmaceuticals Ltd., Century Pharmaceuticals Ltd., Cipla Inc., Daiichi Sankyo Co. Ltd., Dr. Reddys Laboratories Ltd., Glenmark Pharmaceuticals Ltd., Intas Pharmaceuticals Ltd., Lupin Ltd., Orbion Pharmaceuticals Pvt. Ltd., Pfizer Inc., Sandoz Group AG, Taj Pharmaceutical Ltd., Teva Pharmaceutical Ltd., Viatris Inc., Wellona Pharma, Zydus Lifesciences Ltd. are a few of the key vendors in the Amlodipine Besylate market.

North America will register the highest growth rate of 38.9% among the other regions. Therefore, the Amlodipine Besylate market in North America is expected to garner significant business opportunities for the vendors during the forecast period.

US, Canada, Mexico, Germany, UK, France, Italy, Spain, The Netherlands, China, India, Japan, South Korea, Indonesia, Thailand, Brazil, Saudi Arabia, UAE, Turkey, Argentina, Colombia, South Africa, Israel

  • Prevalence of hypertension and chronic cardiovascular conditions is the driving factor this market.

The Amlodipine Besylate market vendors should focus on grabbing business opportunities from the Application segment as it accounted for the largest market share in the base year.
RIA - Research AI Assistant
Ask RIA