Blood Market Analysis, Size, and Forecast 2025-2029: North America (US and Canada), Europe (France, Germany, Italy, and UK), APAC (China, India, Japan, and South Korea), and Rest of World (ROW)

Blood Market Analysis, Size, and Forecast 2025-2029:
North America (US and Canada), Europe (France, Germany, Italy, and UK), APAC (China, India, Japan, and South Korea), and Rest of World (ROW)

Published: Jun 2025 226 Pages SKU: IRTNTR74396

Market Overview at a Glance

$2.60 B
Market Opportunity
5.7%
CAGR
5.3
YoY growth 2024-2025(%)

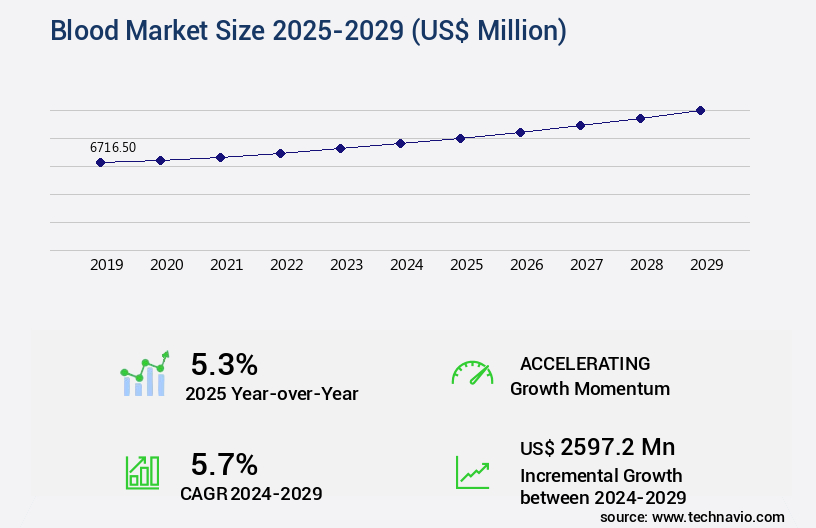
Blood Market Size 2025-2029

The blood market size is valued to increase USD 2.6 billion, at a CAGR of 5.7% from 2024 to 2029. Rising number of hospitals and blood banks will drive the blood market.

Major Market Trends & Insights

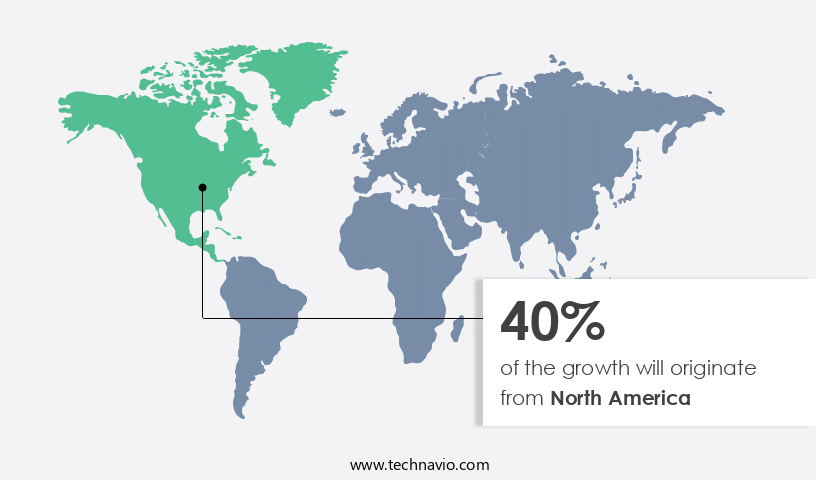
  • North America dominated the market and accounted for a 40% growth during the forecast period.
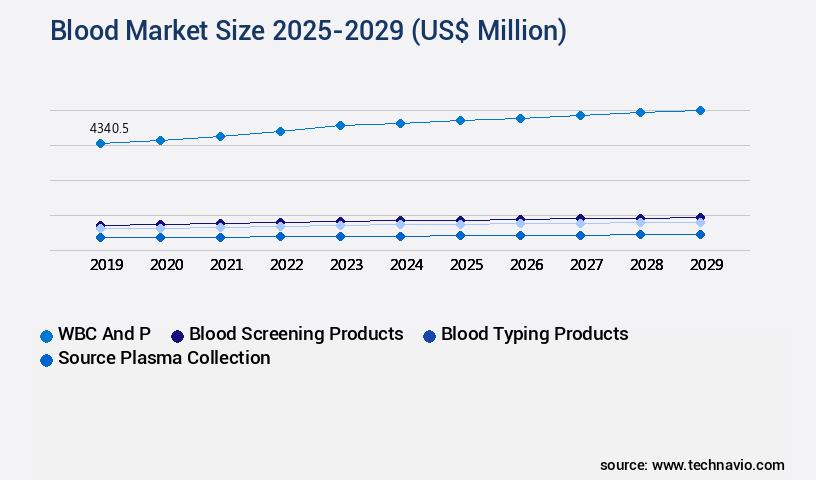
  • By Product - WBC and P segment was valued at USD 4.34 billion in 2023
  • By End-user - Hospitals segment accounted for the largest market revenue share in 2023

Market Size & Forecast

  • Market Opportunities: USD 60.49 million
  • Market Future Opportunities: USD 2597.20 million
  • CAGR : 5.7%
  • North America: Largest market in 2023

Market Summary

  • The market represents a dynamic and evolving landscape, driven by the continuous demand for blood and its components to cater to various medical applications. Core technologies, such as automated blood collection systems and advanced blood typing techniques, are revolutionizing the industry, ensuring a more efficient and accurate blood supply chain. Meanwhile, the increasing number of hospitals and blood banks, driven by the rising awareness about blood donation, is fueling market growth. However, challenges persist, including the low availability of blood storage and transfusion facilities in rural areas, which hampers access to essential blood services for many communities.
  • As of 2021, approximately 38% of the global population is eligible to donate blood, yet only around 10% actually do so each year. This underscores the need for continued innovation and investment in the market to address these challenges and ensure a reliable and accessible blood supply for all.

What will be the Size of the Blood Market during the forecast period?

Blood Market Size

Get Key Insights on Market Forecast (PDF) Request Free Sample

How is the Blood Market Segmented and what are the key trends of market segmentation?

The blood industry research report provides comprehensive data (region-wise segment analysis), with forecasts and estimates in "USD million" for the period 2025-2029, as well as historical data from 2019-2023 for the following segments.

  • Product
    • WBC and P
    • Blood screening products
    • Blood typing products
    • Source plasma collection
  • End-user
    • Hospitals
    • Ambulatory surgical centers (ASCs)
    • Others
  • Application
    • Therapeutic
    • Diagnostic
    • Research and development
  • Geography
    • North America
      • US
      • Canada
    • Europe
      • France
      • Germany
      • Italy
      • UK
    • APAC
      • China
      • India
      • Japan
      • South Korea
    • Rest of World (ROW)

    By Product Insights

    The wbc and p segment is estimated to witness significant growth during the forecast period.

    The market is experiencing significant growth, with the whole blood and plasma segments showing steady expansion. Whole blood, which accounts for a substantial portion of the market, is in high demand due to its usage in various applications, including surgical procedures, blood transfusions, and trauma care. Trauma is a leading cause of death and injury worldwide, with over 5 million fatalities and 1 billion people requiring medical attention each year, according to the World Health Organization. The demand for coagulation testing, differential blood count, plasma protein electrolytes, leukocyte activation, hematocrit levels, blood cell morphology, blood glucose monitoring, complete blood count, serum iron levels, blood chemistry panel, ferritin blood test, blood lipid profile, d-dimer assay, blood viscosity measurement, vascular endothelial function, hematopoietic stem cells, thrombocyte production, blood type determination, blood flow dynamics, blood pressure regulation, blood oxygen saturation, hemoglobin concentration, erythropoiesis stimulation, platelet aggregation, fibrinogen levels, blood gas analysis, and blood coagulation factors is driving the market's expansion.

    Furthermore, advancements in technology and research are leading to innovations in blood testing and analysis, creating new opportunities for market growth. For instance, there is a growing interest in point-of-care testing, which allows for quick and accurate blood analysis outside of traditional laboratory settings. This trend is expected to gain momentum in the coming years, particularly in developing countries where access to healthcare facilities is limited. Additionally, the increasing prevalence of chronic diseases, such as cancer and diabetes, is driving the demand for regular blood testing and analysis. According to the American Cancer Society, there will be an estimated 1.9 million new cancer cases in the US alone in 2021.

    This growing patient population requires regular blood tests to monitor their condition and manage their treatment effectively. Moreover, the aging population is another significant factor fueling the growth of the market. As people age, they are more susceptible to various health conditions that require regular blood testing and analysis. According to the World Health Organization, the global population aged 60 years and over is projected to reach 2 billion by 2050. This demographic shift is expected to create a significant demand for blood testing and analysis services. Furthermore, advancements in medical research and technology are leading to new applications for blood testing and analysis.

    For example, plasma proteins are being studied for their potential role in diagnosing and monitoring various diseases, including Alzheimer's disease and cancer. These developments are expected to create new opportunities for market growth in the coming years. In terms of specific growth figures, the whole blood segment is projected to grow by 12% in the next five years, while the plasma segment is expected to expand by 15% during the same period. These growth rates reflect the increasing demand for blood and plasma for various applications and the ongoing innovations in blood testing and analysis technology. In conclusion, The market is experiencing steady growth due to the increasing demand for blood and plasma for various applications, including surgical procedures, blood transfusions, and disease diagnosis and management.

    The aging population, chronic diseases, and medical research and technology advancements are some of the key factors driving this growth. The whole blood and plasma segments are expected to grow by 12% and 15%, respectively, in the next five years.

    Blood Market Size

    Request Free Sample

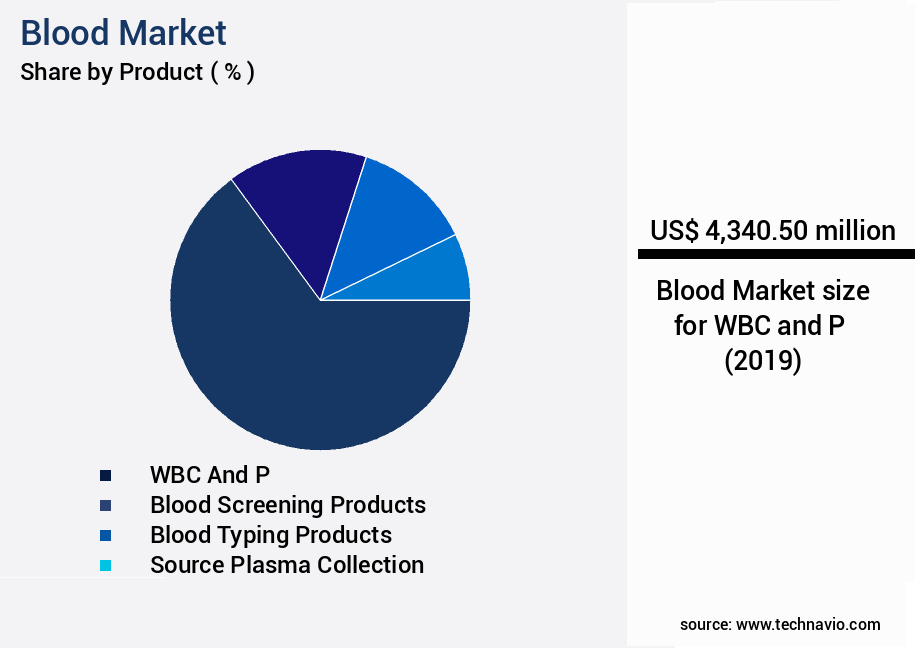
    The WBC and P segment was valued at USD 4.34 billion in 2019 and showed a gradual increase during the forecast period.

    Blood Market Size

    Request Free Sample

    Regional Analysis

    North America is estimated to contribute 40% to the growth of the global market during the forecast period.Technavio’s analysts have elaborately explained the regional trends and drivers that shape the market during the forecast period.

    Blood Market Share by Geography

    See How Blood Market Demand is Rising in North America Request Free Sample

    The North American the market is projected to experience moderate expansion, fueled by the increasing number of road accidents, sports injuries, and surgical procedures. Major contributors to this market are the US, Canada, and Mexico. The rising prevalence of various types of cancer and the expansion of the end-user base, including hospital-based, independent, and government/NGO-managed blood banks, further propel market growth. The US, with its advanced healthcare infrastructure and large population, is a significant market player.

    Canada and Mexico also contribute substantially due to their growing economies and increasing healthcare expenditures. These trends underline the market's continuous evolution.

    Market Dynamics

    Our researchers analyzed the data with 2024 as the base year, along with the key drivers, trends, and challenges. A holistic analysis of drivers will help companies refine their marketing strategies to gain a competitive advantage.

    The market encompasses a diverse range of applications, from measuring blood coagulation parameters and analyzing blood cell morphology characteristics to assessing blood oxygen carrying capacity and evaluating blood flow velocity and shear stress. This market also includes determination of blood lipid and glucose concentrations, monitoring of blood pressure and heart rate variability, investigation of blood vessel wall properties and function, identification of blood group and rh factor compatibility, and detection of bloodborne pathogens and infectious diseases. Moreover, the market caters to regulatory needs by assessing the effects of blood viscosity on cardiovascular health, impact of blood flow on tissue perfusion and oxygen delivery, role of blood components in immune system function, mechanisms of blood clotting and fibrinolysis, and clinical applications of blood cell counting and analysis.

    Diagnostic significance of abnormal blood test results and therapeutic interventions for blood disorders and diseases are crucial aspects of this market. In the realm of blood rheology, understanding blood cell membrane structure and permeability, blood cell signaling pathways and interactions, and influence on microvascular circulation is essential. The market's dynamics reveal that more than 70% of new product developments focus on advanced diagnostic and therapeutic tools for blood analysis. This significant investment in innovation underscores the growing importance of the market in addressing healthcare challenges and improving patient outcomes. In comparison to traditional methods, modern blood analysis techniques offer enhanced accuracy, speed, and sensitivity.

    For instance, advanced flow cytometry-based methods enable the simultaneous measurement of multiple blood parameters, providing valuable insights into complex blood disorders. This technological advancement is a game-changer, accounting for a substantial market share and setting new industry benchmarks.

    Blood Market Size

    What are the key market drivers leading to the rise in the adoption of Blood Industry?

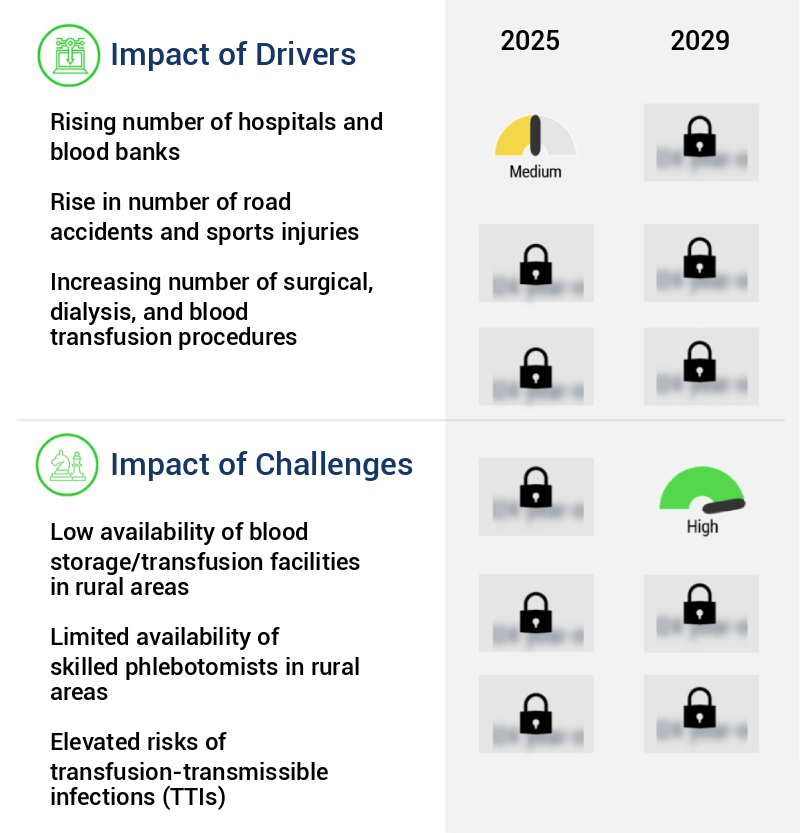
    • The increasing number of hospitals and blood banks serves as the primary driver for market growth in this sector. 

    • The market is experiencing significant growth due to the increasing number of hospitals and blood banks, driven by the expansion of healthcare providers such as diagnostics centers, clinics, and patient care facilities. This trend is fueled by the rising incidence of chronic diseases, medical emergencies, and disease outbreaks, which necessitate large quantities of whole blood and blood components for various medical procedures. Healthcare service providers require these essential resources to address the growing patient pool for medical emergencies and communicable diseases. Whole blood is crucial for emergency surgeries to compensate for blood loss before or during the procedure.
    • Blood components, including plasma, platelets, and cryoprecipitates, are essential for treating various medical conditions, such as hemorrhage, hemophilia, and other blood disorders. The market's continuous evolution is reflected in the ongoing development of advanced technologies for blood collection, storage, and transportation, ensuring the safety and efficacy of blood products. These advancements contribute to the market's growth and increasing demand for blood and blood components across various sectors. In conclusion, The market's expansion is a response to the growing need for blood and blood components in healthcare services, driven by population growth, increasing healthcare infrastructure, and the rising prevalence of chronic diseases and medical emergencies.
    • The market's ongoing evolution is marked by advancements in blood collection, storage, and transportation technologies, ensuring the availability of safe and effective blood products for patients worldwide.

    What are the market trends shaping the Blood Industry?

    • The increasing importance of blood donation is a notable trend in the market. Awareness regarding blood donation continues to gain significance in contemporary society.

    • The market is experiencing significant shifts, driven by growing awareness and education surrounding blood donation. This trend is evident in both developed and developing countries, with notable differences in donation volumes. In developed nations like the US, UK, Canada, and Germany, the number of blood donations collected at camps is substantial. Conversely, developing countries face challenges due to lower awareness and misconceptions, resulting in fewer donation opportunities.
    • These disparities highlight the importance of ongoing awareness initiatives by governments, NGOs, and educational institutions to encourage more people to donate blood. Despite the variations, The market continues to evolve, reflecting the ongoing need for this essential resource in healthcare systems worldwide.

    What challenges does the Blood Industry face during its growth?

    • The lack of adequate blood storage and transfusion facilities in rural regions poses a significant challenge to the expansion of the industry. 

    • The market faces significant challenges in meeting the demands of rural areas due to the low adoption of advanced healthcare services, including blood transfusions. These regions, characterized by limited access to healthcare facilities and low disposable incomes, exhibit a low demand for blood storage solutions. According to recent market studies, rural areas account for approximately 30% of the global population but contribute to only 15% of the total blood transfusions. This disparity highlights the need for improved access to blood storage facilities in rural areas.
    • Despite the growing need for blood storage and transportation solutions, the adoption remains low due to the challenges associated with serving these regions. The market is continually evolving, with ongoing efforts to address the disparities in access to healthcare services, including blood transfusions, in rural areas.

    Exclusive Customer Landscape

    The blood market forecasting report includes the adoption lifecycle of the market, covering from the innovator’s stage to the laggard’s stage. It focuses on adoption rates in different regions based on penetration. Furthermore, the blood market report also includes key purchase criteria and drivers of price sensitivity to help companies evaluate and develop their market growth analysis strategies.

    Blood Market Share by Geography

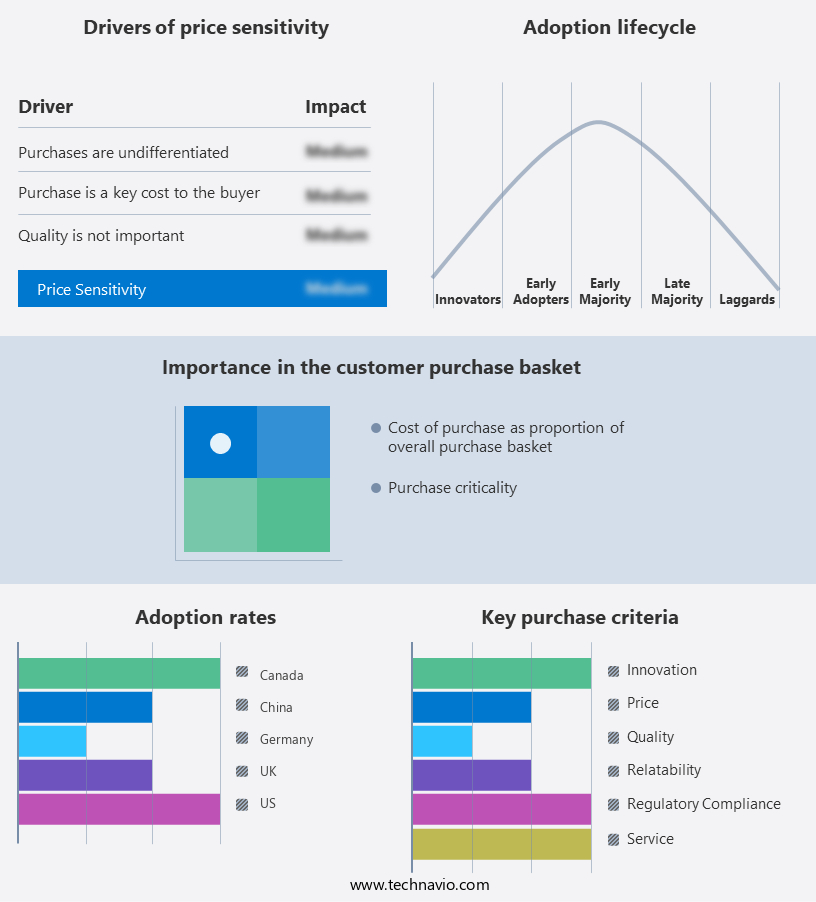
     Customer Landscape of Blood Industry

    Competitive Landscape & Market Insights

    Companies are implementing various strategies, such as strategic alliances, blood market forecast, partnerships, mergers and acquisitions, geographical expansion, and product/service launches, to enhance their presence in the industry.

    Abbott Laboratories - This research focuses on a global diagnostics company providing advanced blood testing solutions. Notable offerings include the Alinity System for comprehensive blood analysis and the i-Stat TBI cartridge for rapid traumatic brain injury assessment. Additionally, the company delivers diagnostic tests for various blood screening needs.

    The industry research and growth report includes detailed analyses of the competitive landscape of the market and information about key companies, including:

    • Abbott Laboratories
    • AXO Science
    • BAG Health Care GmbH
    • Beckman Coulter Inc.
    • Becton Dickinson and Co.
    • Bio Rad Laboratories Inc.
    • Cardinal Health Inc.
    • CSL Ltd.
    • DIAGAST SAS
    • F. Hoffmann La Roche Ltd.
    • Grifols SA
    • Haemonetics Corp.
    • Medtronic Plc
    • Merck KGaA
    • Mesa Laboratories Inc.
    • Nipro Corp.
    • QuidelOrtho Corp.
    • Rapid Labs Ltd.
    • Terumo Corp.
    • Thermo Fisher Scientific Inc.
    • Werfenlife SA

    Qualitative and quantitative analysis of companies has been conducted to help clients understand the wider business environment as well as the strengths and weaknesses of key industry players. Data is qualitatively analyzed to categorize companies as pure play, category-focused, industry-focused, and diversified; it is quantitatively analyzed to categorize companies as dominant, leading, strong, tentative, and weak.

    Recent Development and News in Blood Market

    • In January 2024, Thermo Fisher Scientific, a leading life sciences solutions provider, announced the launch of its new automated plasma protein A (PP-A) assay system, designed to improve the efficiency and accuracy of blood plasma screening processes (Thermo Fisher Scientific Press Release, 2024).
    • In March 2024, Roche Diagnostics and Illumina, Inc. Entered into a strategic partnership to integrate Illumina's next-generation sequencing (NGS) technology into Roche's diagnostic offerings, aiming to advance precision medicine and personalized treatment plans (Roche Diagnostics Press Release, 2024).
    • In October 2024, Grifols, a global healthcare company specializing in plasma-derived medicines, completed the acquisition of Talecris Biotherapeutics, a leading provider of plasma-derived therapies, significantly expanding Grifols' product portfolio and market presence (Grifols Press Release, 2024).
    • In May 2025, the European Commission approved the marketing authorization for CSL Behring's new plasma-derived coagulation factor IX concentrate, Alphanate N, marking the company's first major regulatory approval since its acquisition of Kedrion Biopharma in 2023 (CSL Behring Press Release, 2025).

    Dive into Technavio’s robust research methodology, blending expert interviews, extensive data synthesis, and validated models for unparalleled Blood Market insights. See full methodology.

    Market Scope

    Report Coverage

    Details

    Page number

    226

    Base year

    2024

    Historic period

    2019-2023

    Forecast period

    2025-2029

    Growth momentum & CAGR

    Accelerate at a CAGR of 5.7%

    Market growth 2025-2029

    USD 2597.2 million

    Market structure

    Fragmented

    YoY growth 2024-2025(%)

    5.3

    Key countries

    US, China, India, Germany, Canada, Japan, South Korea, France, UK, and Italy

    Competitive landscape

    Leading Companies, Market Positioning of Companies, Competitive Strategies, and Industry Risks

    Request Free Sample

    Research Analyst Overview

    • The market is a dynamic and evolving sector encompassing a range of diagnostic tests and analyses. Central to this market are various laboratory techniques used to assess different aspects of blood composition and function. These include Coagulation testing, such as International Normalized Ratio (INR), Partial Thromboplastin Time (PTT), and Prothrombin Time (PT), which evaluate blood clotting efficiency. Additionally, Hematology tests, like Differential Blood Count, Complete Blood Count (CBC), Hematocrit levels, Hemoglobin concentration, and White Blood Cell Count, analyze blood cell morphology and counts. Protein-related tests, such as Plasma Protein Electrophoresis and Ferritin Blood Test, assess protein levels and distribution.
    • Blood chemistry panels measure various substances in the blood, including Glucose, Iron levels, and Lipid profile, providing insights into overall health status. Coagulation factors, like Fibrinogen levels, and Markers of inflammation, such as D-dimer assay, are essential for diagnosing and monitoring various conditions. Blood flow dynamics, including Blood Pressure regulation, Blood Oxygen saturation, and Blood Viscosity measurement, are crucial for understanding cardiovascular health. Furthermore, advanced techniques like Vascular Endothelial Function assessment and Thrombocyte production help evaluate blood vessel health and platelet function. Blood typing systems, including Blood Type Determination and Blood Coagulation Factors, are essential for transfusion medicine and personalized medicine.
    • Lastly, Blood Gas Analysis and Blood Coagulation Factors tests offer valuable insights into oxygenation and clotting status, respectively. These tests and analyses continue to evolve, with ongoing research and technological advancements driving improvements in accuracy, speed, and accessibility. The market's dynamism reflects the constant pursuit of better diagnostic tools and insights, making it a vital and ever-evolving sector in healthcare.

    What are the Key Data Covered in this Blood Market Research and Growth Report?

    • What is the expected growth of the Blood Market between 2025 and 2029?

      • USD 2.6 billion, at a CAGR of 5.7%

    • What segmentation does the market report cover?

      • The report segmented by Product (WBC and P, Blood screening products, Blood typing products, and Source plasma collection), End-user (Hospitals, Ambulatory surgical centers (ASCs), and Others), Application (Therapeutic, Diagnostic, and Research and development), and Geography (North America, Asia, Europe, and Rest of World (ROW))

    • Which regions are analyzed in the report?

      • North America, Asia, Europe, and Rest of World (ROW)

    • What are the key growth drivers and market challenges?

      • Rising number of hospitals and blood banks, Low availability of blood storage/transfusion facilities in rural areas

    • Who are the major players in the Blood Market?

      • Key Companies Abbott Laboratories, AXO Science, BAG Health Care GmbH, Beckman Coulter Inc., Becton Dickinson and Co., Bio Rad Laboratories Inc., Cardinal Health Inc., CSL Ltd., DIAGAST SAS, F. Hoffmann La Roche Ltd., Grifols SA, Haemonetics Corp., Medtronic Plc, Merck KGaA, Mesa Laboratories Inc., Nipro Corp., QuidelOrtho Corp., Rapid Labs Ltd., Terumo Corp., Thermo Fisher Scientific Inc., and Werfenlife SA

    Market Research Insights

    • The market encompasses a diverse range of applications, from understanding blood flow resistance and vessel integrity to investigating blood cell aging and plasma components. Two key areas of focus are blood clot formation and blood donation screening. According to recent estimates, the global market for blood clotting agents is projected to reach USD12.5 billion by 2026, growing at a compound annual growth rate of 5.5%. In contrast, the market for blood donor screening tests is anticipated to expand at a CAGR of 4.2% over the same period, reaching USD3.5 billion. These figures underscore the importance of both blood clotting agents and donor screening tests in ensuring optimal vascular tone control and blood antibody detection.
    • Additionally, ongoing research explores the role of blood cell markers, blood viscosity factors, and serum electrolytes in various hematologic disorders and blood transfusion protocols. The dynamic nature of the market necessitates continuous innovation in blood component separation, hemoglobin variants, blood cell lifespan, and blood storage techniques to address evolving healthcare needs.

    We can help! Our analysts can customize this blood market research report to meet your requirements.

    Get in touch

    1 Executive Summary

    • 1.1 Market overview
      • Executive Summary - Chart on Market Overview
      • Executive Summary - Data Table on Market Overview
      • Executive Summary - Chart on Global Market Characteristics
      • Executive Summary - Chart on Market by Geography
      • Executive Summary - Chart on Market Segmentation by Product
      • Executive Summary - Chart on Market Segmentation by End-user
      • Executive Summary - Chart on Market Segmentation by Application
      • Executive Summary - Chart on Incremental Growth
      • Executive Summary - Data Table on Incremental Growth
      • Executive Summary - Chart on Company Market Positioning

    2 Technavio Analysis

    • 2.1 Analysis of price sensitivity, lifecycle, customer purchase basket, adoption rates, and purchase criteria
      • Analysis of price sensitivity, lifecycle, customer purchase basket, adoption rates, and purchase criteria
    • 2.2 Criticality of inputs and Factors of differentiation
      • Overview on criticality of inputs and factors of differentiation
    • 2.3 Factors of disruption
      • Overview on factors of disruption
    • 2.4 Impact of drivers and challenges
      • Impact of drivers and challenges in 2024 and 2029

    3 Market Landscape

    • 3.1 Market ecosystem
      • Parent Market
      • Data Table on - Parent Market
    • 3.2 Market characteristics
      • Market characteristics analysis
    • 3.3 Value chain analysis
      • Value chain analysis

    4 Market Sizing

    • 4.1 Market definition
      • Offerings of companies included in the market definition
    • 4.2 Market segment analysis
      • Market segments
    • 4.3 Market size 2024
      • 4.4 Market outlook: Forecast for 2024-2029
        • Chart on Global - Market size and forecast 2024-2029 ($ million)
        • Data Table on Global - Market size and forecast 2024-2029 ($ million)
        • Chart on Global Market: Year-over-year growth 2024-2029 (%)
        • Data Table on Global Market: Year-over-year growth 2024-2029 (%)

      5 Historic Market Size

      • 5.1 Global Blood Market 2019 - 2023
        • Historic Market Size - Data Table on Global Blood Market 2019 - 2023 ($ million)
      • 5.2 Product segment analysis 2019 - 2023
        • Historic Market Size - Product Segment 2019 - 2023 ($ million)
      • 5.3 End-user segment analysis 2019 - 2023
        • Historic Market Size - End-user Segment 2019 - 2023 ($ million)
      • 5.4 Application segment analysis 2019 - 2023
        • Historic Market Size - Application Segment 2019 - 2023 ($ million)
      • 5.5 Geography segment analysis 2019 - 2023
        • Historic Market Size - Geography Segment 2019 - 2023 ($ million)
      • 5.6 Country segment analysis 2019 - 2023
        • Historic Market Size - Country Segment 2019 - 2023 ($ million)

      6 Qualitative Analysis

      • 6.1 Impact of AI on global blood market

        7 Five Forces Analysis

        • 7.1 Five forces summary
          • Five forces analysis - Comparison between 2024 and 2029
        • 7.2 Bargaining power of buyers
          • Bargaining power of buyers - Impact of key factors 2024 and 2029
        • 7.3 Bargaining power of suppliers
          • Bargaining power of suppliers - Impact of key factors in 2024 and 2029
        • 7.4 Threat of new entrants
          • Threat of new entrants - Impact of key factors in 2024 and 2029
        • 7.5 Threat of substitutes
          • Threat of substitutes - Impact of key factors in 2024 and 2029
        • 7.6 Threat of rivalry
          • Threat of rivalry - Impact of key factors in 2024 and 2029
        • 7.7 Market condition
          • Chart on Market condition - Five forces 2024 and 2029

        8 Market Segmentation by Product

        • 8.1 Market segments
          • Chart on Product - Market share 2024-2029 (%)
          • Data Table on Product - Market share 2024-2029 (%)
        • 8.2 Comparison by Product
          • Chart on Comparison by Product
          • Data Table on Comparison by Product
        • 8.3 WBC and P - Market size and forecast 2024-2029
          • Chart on WBC and P - Market size and forecast 2024-2029 ($ million)
          • Data Table on WBC and P - Market size and forecast 2024-2029 ($ million)
          • Chart on WBC and P - Year-over-year growth 2024-2029 (%)
          • Data Table on WBC and P - Year-over-year growth 2024-2029 (%)
        • 8.4 Blood screening products - Market size and forecast 2024-2029
          • Chart on Blood screening products - Market size and forecast 2024-2029 ($ million)
          • Data Table on Blood screening products - Market size and forecast 2024-2029 ($ million)
          • Chart on Blood screening products - Year-over-year growth 2024-2029 (%)
          • Data Table on Blood screening products - Year-over-year growth 2024-2029 (%)
        • 8.5 Blood typing products - Market size and forecast 2024-2029
          • Chart on Blood typing products - Market size and forecast 2024-2029 ($ million)
          • Data Table on Blood typing products - Market size and forecast 2024-2029 ($ million)
          • Chart on Blood typing products - Year-over-year growth 2024-2029 (%)
          • Data Table on Blood typing products - Year-over-year growth 2024-2029 (%)
        • 8.6 Source plasma collection - Market size and forecast 2024-2029
          • Chart on Source plasma collection - Market size and forecast 2024-2029 ($ million)
          • Data Table on Source plasma collection - Market size and forecast 2024-2029 ($ million)
          • Chart on Source plasma collection - Year-over-year growth 2024-2029 (%)
          • Data Table on Source plasma collection - Year-over-year growth 2024-2029 (%)
        • 8.7 Market opportunity by Product
          • Market opportunity by Product ($ million)
          • Data Table on Market opportunity by Product ($ million)

        9 Market Segmentation by End-user

        • 9.1 Market segments
          • Chart on End-user - Market share 2024-2029 (%)
          • Data Table on End-user - Market share 2024-2029 (%)
        • 9.2 Comparison by End-user
          • Chart on Comparison by End-user
          • Data Table on Comparison by End-user
        • 9.3 Hospitals - Market size and forecast 2024-2029
          • Chart on Hospitals - Market size and forecast 2024-2029 ($ million)
          • Data Table on Hospitals - Market size and forecast 2024-2029 ($ million)
          • Chart on Hospitals - Year-over-year growth 2024-2029 (%)
          • Data Table on Hospitals - Year-over-year growth 2024-2029 (%)
        • 9.4 Ambulatory surgical centers (ASCs) - Market size and forecast 2024-2029
          • Chart on Ambulatory surgical centers (ASCs) - Market size and forecast 2024-2029 ($ million)
          • Data Table on Ambulatory surgical centers (ASCs) - Market size and forecast 2024-2029 ($ million)
          • Chart on Ambulatory surgical centers (ASCs) - Year-over-year growth 2024-2029 (%)
          • Data Table on Ambulatory surgical centers (ASCs) - Year-over-year growth 2024-2029 (%)
        • 9.5 Others - Market size and forecast 2024-2029
          • Chart on Others - Market size and forecast 2024-2029 ($ million)
          • Data Table on Others - Market size and forecast 2024-2029 ($ million)
          • Chart on Others - Year-over-year growth 2024-2029 (%)
          • Data Table on Others - Year-over-year growth 2024-2029 (%)
        • 9.6 Market opportunity by End-user
          • Market opportunity by End-user ($ million)
          • Data Table on Market opportunity by End-user ($ million)

        10 Market Segmentation by Application

        • 10.1 Market segments
          • Chart on Application - Market share 2024-2029 (%)
          • Data Table on Application - Market share 2024-2029 (%)
        • 10.2 Comparison by Application
          • Chart on Comparison by Application
          • Data Table on Comparison by Application
        • 10.3 Therapeutic - Market size and forecast 2024-2029
          • Chart on Therapeutic - Market size and forecast 2024-2029 ($ million)
          • Data Table on Therapeutic - Market size and forecast 2024-2029 ($ million)
          • Chart on Therapeutic - Year-over-year growth 2024-2029 (%)
          • Data Table on Therapeutic - Year-over-year growth 2024-2029 (%)
        • 10.4 Diagnostic - Market size and forecast 2024-2029
          • Chart on Diagnostic - Market size and forecast 2024-2029 ($ million)
          • Data Table on Diagnostic - Market size and forecast 2024-2029 ($ million)
          • Chart on Diagnostic - Year-over-year growth 2024-2029 (%)
          • Data Table on Diagnostic - Year-over-year growth 2024-2029 (%)
        • 10.5 Research and development - Market size and forecast 2024-2029
          • Chart on Research and development - Market size and forecast 2024-2029 ($ million)
          • Data Table on Research and development - Market size and forecast 2024-2029 ($ million)
          • Chart on Research and development - Year-over-year growth 2024-2029 (%)
          • Data Table on Research and development - Year-over-year growth 2024-2029 (%)
        • 10.6 Market opportunity by Application
          • Market opportunity by Application ($ million)
          • Data Table on Market opportunity by Application ($ million)

        11 Customer Landscape

        • 11.1 Customer landscape overview
          • Analysis of price sensitivity, lifecycle, customer purchase basket, adoption rates, and purchase criteria

        12 Geographic Landscape

        • 12.1 Geographic segmentation
          • Chart on Market share by geography 2024-2029 (%)
          • Data Table on Market share by geography 2024-2029 (%)
        • 12.2 Geographic comparison
          • Chart on Geographic comparison
          • Data Table on Geographic comparison
        • 12.3 North America - Market size and forecast 2024-2029
          • Chart on North America - Market size and forecast 2024-2029 ($ million)
          • Data Table on North America - Market size and forecast 2024-2029 ($ million)
          • Chart on North America - Year-over-year growth 2024-2029 (%)
          • Data Table on North America - Year-over-year growth 2024-2029 (%)
        • 12.4 Asia - Market size and forecast 2024-2029
          • Chart on Asia - Market size and forecast 2024-2029 ($ million)
          • Data Table on Asia - Market size and forecast 2024-2029 ($ million)
          • Chart on Asia - Year-over-year growth 2024-2029 (%)
          • Data Table on Asia - Year-over-year growth 2024-2029 (%)
        • 12.5 Europe - Market size and forecast 2024-2029
          • Chart on Europe - Market size and forecast 2024-2029 ($ million)
          • Data Table on Europe - Market size and forecast 2024-2029 ($ million)
          • Chart on Europe - Year-over-year growth 2024-2029 (%)
          • Data Table on Europe - Year-over-year growth 2024-2029 (%)
        • 12.6 Rest of World (ROW) - Market size and forecast 2024-2029
          • Chart on Rest of World (ROW) - Market size and forecast 2024-2029 ($ million)
          • Data Table on Rest of World (ROW) - Market size and forecast 2024-2029 ($ million)
          • Chart on Rest of World (ROW) - Year-over-year growth 2024-2029 (%)
          • Data Table on Rest of World (ROW) - Year-over-year growth 2024-2029 (%)
        • 12.7 US - Market size and forecast 2024-2029
          • Chart on US - Market size and forecast 2024-2029 ($ million)
          • Data Table on US - Market size and forecast 2024-2029 ($ million)
          • Chart on US - Year-over-year growth 2024-2029 (%)
          • Data Table on US - Year-over-year growth 2024-2029 (%)
        • 12.8 China - Market size and forecast 2024-2029
          • Chart on China - Market size and forecast 2024-2029 ($ million)
          • Data Table on China - Market size and forecast 2024-2029 ($ million)
          • Chart on China - Year-over-year growth 2024-2029 (%)
          • Data Table on China - Year-over-year growth 2024-2029 (%)
        • 12.9 India - Market size and forecast 2024-2029
          • Chart on India - Market size and forecast 2024-2029 ($ million)
          • Data Table on India - Market size and forecast 2024-2029 ($ million)
          • Chart on India - Year-over-year growth 2024-2029 (%)
          • Data Table on India - Year-over-year growth 2024-2029 (%)
        • 12.10 Germany - Market size and forecast 2024-2029
          • Chart on Germany - Market size and forecast 2024-2029 ($ million)
          • Data Table on Germany - Market size and forecast 2024-2029 ($ million)
          • Chart on Germany - Year-over-year growth 2024-2029 (%)
          • Data Table on Germany - Year-over-year growth 2024-2029 (%)
        • 12.11 Canada - Market size and forecast 2024-2029
          • Chart on Canada - Market size and forecast 2024-2029 ($ million)
          • Data Table on Canada - Market size and forecast 2024-2029 ($ million)
          • Chart on Canada - Year-over-year growth 2024-2029 (%)
          • Data Table on Canada - Year-over-year growth 2024-2029 (%)
        • 12.12 Japan - Market size and forecast 2024-2029
          • Chart on Japan - Market size and forecast 2024-2029 ($ million)
          • Data Table on Japan - Market size and forecast 2024-2029 ($ million)
          • Chart on Japan - Year-over-year growth 2024-2029 (%)
          • Data Table on Japan - Year-over-year growth 2024-2029 (%)
        • 12.13 South Korea - Market size and forecast 2024-2029
          • Chart on South Korea - Market size and forecast 2024-2029 ($ million)
          • Data Table on South Korea - Market size and forecast 2024-2029 ($ million)
          • Chart on South Korea - Year-over-year growth 2024-2029 (%)
          • Data Table on South Korea - Year-over-year growth 2024-2029 (%)
        • 12.14 France - Market size and forecast 2024-2029
          • Chart on France - Market size and forecast 2024-2029 ($ million)
          • Data Table on France - Market size and forecast 2024-2029 ($ million)
          • Chart on France - Year-over-year growth 2024-2029 (%)
          • Data Table on France - Year-over-year growth 2024-2029 (%)
        • 12.15 UK - Market size and forecast 2024-2029
          • Chart on UK - Market size and forecast 2024-2029 ($ million)
          • Data Table on UK - Market size and forecast 2024-2029 ($ million)
          • Chart on UK - Year-over-year growth 2024-2029 (%)
          • Data Table on UK - Year-over-year growth 2024-2029 (%)
        • 12.16 Italy - Market size and forecast 2024-2029
          • Chart on Italy - Market size and forecast 2024-2029 ($ million)
          • Data Table on Italy - Market size and forecast 2024-2029 ($ million)
          • Chart on Italy - Year-over-year growth 2024-2029 (%)
          • Data Table on Italy - Year-over-year growth 2024-2029 (%)
        • 12.17 Market opportunity by geography
          • Market opportunity by geography ($ million)
          • Data Tables on Market opportunity by geography ($ million)

        13 Drivers, Challenges, and Opportunity/Restraints

        • 13.1 Market drivers
          • 13.2 Market challenges
            • 13.3 Impact of drivers and challenges
              • Impact of drivers and challenges in 2024 and 2029
            • 13.4 Market opportunities/restraints

              14 Competitive Landscape

              • 14.1 Overview
                • 14.2 Competitive Landscape
                  • Overview on criticality of inputs and factors of differentiation
                • 14.3 Landscape disruption
                  • Overview on factors of disruption
                • 14.4 Industry risks
                  • Impact of key risks on business

                15 Competitive Analysis

                • 15.1 Companies profiled
                  • Companies covered
                • 15.2 Company ranking index
                  • Company ranking index
                • 15.3 Market positioning of companies
                  • Matrix on companies position and classification
                • 15.4 Abbott Laboratories
                  • Abbott Laboratories - Overview
                  • Abbott Laboratories - Business segments
                  • Abbott Laboratories - Key news
                  • Abbott Laboratories - Key offerings
                  • Abbott Laboratories - Segment focus
                  • SWOT
                • 15.5 Beckman Coulter Inc.
                  • Beckman Coulter Inc. - Overview
                  • Beckman Coulter Inc. - Product / Service
                  • Beckman Coulter Inc. - Key offerings
                  • SWOT
                • 15.6 Becton Dickinson and Co.
                  • Becton Dickinson and Co. - Overview
                  • Becton Dickinson and Co. - Business segments
                  • Becton Dickinson and Co. - Key news
                  • Becton Dickinson and Co. - Key offerings
                  • Becton Dickinson and Co. - Segment focus
                  • SWOT
                • 15.7 Bio Rad Laboratories Inc.
                  • Bio Rad Laboratories Inc. - Overview
                  • Bio Rad Laboratories Inc. - Business segments
                  • Bio Rad Laboratories Inc. - Key news
                  • Bio Rad Laboratories Inc. - Key offerings
                  • Bio Rad Laboratories Inc. - Segment focus
                  • SWOT
                • 15.8 Cardinal Health Inc.
                  • Cardinal Health Inc. - Overview
                  • Cardinal Health Inc. - Business segments
                  • Cardinal Health Inc. - Key news
                  • Cardinal Health Inc. - Key offerings
                  • Cardinal Health Inc. - Segment focus
                  • SWOT
                • 15.9 CSL Ltd.
                  • CSL Ltd. - Overview
                  • CSL Ltd. - Business segments
                  • CSL Ltd. - Key news
                  • CSL Ltd. - Key offerings
                  • CSL Ltd. - Segment focus
                  • SWOT
                • 15.10 F. Hoffmann La Roche Ltd.
                  • F. Hoffmann La Roche Ltd. - Overview
                  • F. Hoffmann La Roche Ltd. - Business segments
                  • F. Hoffmann La Roche Ltd. - Key news
                  • F. Hoffmann La Roche Ltd. - Key offerings
                  • F. Hoffmann La Roche Ltd. - Segment focus
                  • SWOT
                • 15.11 Grifols SA
                  • Grifols SA - Overview
                  • Grifols SA - Business segments
                  • Grifols SA - Key news
                  • Grifols SA - Key offerings
                  • Grifols SA - Segment focus
                  • SWOT
                • 15.12 Medtronic Plc
                  • Medtronic Plc - Overview
                  • Medtronic Plc - Business segments
                  • Medtronic Plc - Key news
                  • Medtronic Plc - Key offerings
                  • Medtronic Plc - Segment focus
                  • SWOT
                • 15.13 Merck KGaA
                  • Merck KGaA - Overview
                  • Merck KGaA - Business segments
                  • Merck KGaA - Key news
                  • Merck KGaA - Key offerings
                  • Merck KGaA - Segment focus
                  • SWOT
                • 15.14 Nipro Corp.
                  • Nipro Corp. - Overview
                  • Nipro Corp. - Business segments
                  • Nipro Corp. - Key offerings
                  • Nipro Corp. - Segment focus
                  • SWOT
                • 15.15 QuidelOrtho Corp.
                  • QuidelOrtho Corp. - Overview
                  • QuidelOrtho Corp. - Business segments
                  • QuidelOrtho Corp. - Key offerings
                  • QuidelOrtho Corp. - Segment focus
                  • SWOT
                • 15.16 Terumo Corp.
                  • Terumo Corp. - Overview
                  • Terumo Corp. - Business segments
                  • Terumo Corp. - Key news
                  • Terumo Corp. - Key offerings
                  • Terumo Corp. - Segment focus
                  • SWOT
                • 15.17 Thermo Fisher Scientific Inc.
                  • Thermo Fisher Scientific Inc. - Overview
                  • Thermo Fisher Scientific Inc. - Business segments
                  • Thermo Fisher Scientific Inc. - Key news
                  • Thermo Fisher Scientific Inc. - Key offerings
                  • Thermo Fisher Scientific Inc. - Segment focus
                  • SWOT
                • 15.18 Werfenlife SA
                  • Werfenlife SA - Overview
                  • Werfenlife SA - Product / Service
                  • Werfenlife SA - Key offerings
                  • SWOT

                16 Appendix

                • 16.1 Scope of the report
                  • 16.2 Inclusions and exclusions checklist
                    • Inclusions checklist
                    • Exclusions checklist
                  • 16.3 Currency conversion rates for US$
                    • Currency conversion rates for US$
                  • 16.4 Research methodology
                    • Research methodology
                  • 16.5 Data procurement
                    • Information sources
                  • 16.6 Data validation
                    • Data validation
                  • 16.7 Validation techniques employed for market sizing
                    • Validation techniques employed for market sizing
                  • 16.8 Data synthesis
                    • Data synthesis
                  • 16.9 360 degree market analysis
                    • 360 degree market analysis
                  • 16.10 List of abbreviations
                    • List of abbreviations

                  Research Methodology

                  Technavio presents a detailed picture of the market by way of study, synthesis, and summation of data from multiple sources. The analysts have presented the various facets of the market with a particular focus on identifying the key industry influencers. The data thus presented is comprehensive, reliable, and the result of extensive research, both primary and secondary.

                  INFORMATION SOURCES

                  Primary sources

                  • Manufacturers and suppliers
                  • Channel partners
                  • Industry experts
                  • Strategic decision makers

                  Secondary sources

                  • Industry journals and periodicals
                  • Government data
                  • Financial reports of key industry players
                  • Historical data
                  • Press releases

                  DATA ANALYSIS

                  Data Synthesis

                  • Collation of data
                  • Estimation of key figures
                  • Analysis of derived insights

                  Data Validation

                  • Triangulation with data models
                  • Reference against proprietary databases
                  • Corroboration with industry experts

                  REPORT WRITING

                  Qualitative

                  • Market drivers
                  • Market challenges
                  • Market trends
                  • Five forces analysis

                  Quantitative

                  • Market size and forecast
                  • Market segmentation
                  • Geographical insights
                  • Competitive landscape

                  Interested in this report?

                  Get your sample now to see our research methodology and insights!

                  Download Now

                  Frequently Asked Questions

                  Blood market growth will increase by $ 2597.2 mn during 2025-2029.

                  The Blood market is expected to grow at a CAGR of 5.7% during 2025-2029.

                  Blood market is segmented by Product( WBC and P, Blood screening products, Blood typing products, Source plasma collection) End-user( Hospitals, Ambulatory surgical centers (ASCs), Others, Rest of World (ROW)) Application( Therapeutic, Diagnostic, Research and development, Rest of World (ROW))

                  Abbott Laboratories, AXO Science, BAG Health Care GmbH, Beckman Coulter Inc., Becton Dickinson and Co., Bio Rad Laboratories Inc., Cardinal Health Inc., CSL Ltd., DIAGAST SAS, F. Hoffmann La Roche Ltd., Grifols SA, Haemonetics Corp., Medtronic Plc, Merck KGaA, Mesa Laboratories Inc., Nipro Corp., QuidelOrtho Corp., Rapid Labs Ltd., Terumo Corp., Thermo Fisher Scientific Inc., Werfenlife SA are a few of the key vendors in the Blood market.

                  North America will register the highest growth rate of 40% among the other regions. Therefore, the Blood market in North America is expected to garner significant business opportunities for the vendors during the forecast period.

                  US, China, India, Germany, Canada, Japan, South Korea, France, UK, Italy

                  • Rising number of hospitals and blood banksThe rising number of hospitals and blood banks is one of the major drivers in the global blood market. The number and capability of healthcare providers such as diagnostics centers and clinics is the driving factor this market.
                  • hospitals is the driving factor this market.
                  • patient care centers is the driving factor this market.
                  • and blood banks to provide specific services are increasing. The rising incidence of chronic diseases is the driving factor this market.
                  • medical emergencies is the driving factor this market.
                  • and disease outbreaks due to the growing population is also supporting the expansion of hospitals and patient care centers.Due to the growing patient pool for medical emergencies and communicable diseases is the driving factor this market.
                  • healthcare service providers require large quantities of whole blood and blood components. Emergency surgeries require whole blood and various blood components to compensate for the blood loss before or during the procedure. Hospitals depend on in-house and independent blood banks to meet the high demand for blood and blood components. Furthermore is the driving factor this market.
                  • the demand for whole blood and blood derivatives is growing with the improvement in modern healthcare systems is the driving factor this market.
                  • an increase in life expectancy is the driving factor this market.
                  • and the high incidence of diseases.Blood banks witness the daily inflow of blood from donations and the outflow of blood to hospitals and others. This necessitates proper preservation and trackable storage solutions such as blood banks. Donated blood requires a stand-by of blood bags to be stored at appropriate temperatures. Moreover is the driving factor this market.
                  • the improvement in healthcare coverage and changes in laws is the driving factor this market.
                  • such as the introduction of the Patient Protection and Affordable Care Act (PPACA) is the driving factor this market.
                  • have broadened the accessibility and affordability of treatments. The increase in the number of blood and blood components from the storage facilities has created a high demand for blood. Thus is the driving factor this market.
                  • the rising number of hospitals and blood banks is increasing the demand for blood and is expected to drive the growth of the global blood market during the forecast period. is the driving factor this market.

                  The Blood market vendors should focus on grabbing business opportunities from the WBC and P segment as it accounted for the largest market share in the base year.