
Anesthesia Drugs Market Analysis, Size, and Forecast 2026-2030: North America (US, Canada, and Mexico), Europe (Germany, UK, and France), Asia (China, Japan, and India), South America (Brazil, Argentina, and Colombia), Middle East and Africa (Saudi Arabia, Turkey, and UAE), Rest of World (ROW)

Anesthesia Drugs Market Analysis, Size, and Forecast 2026-2030:
North America (US, Canada, and Mexico), Europe (Germany, UK, and France), Asia (China, Japan, and India), South America (Brazil, Argentina, and Colombia), Middle East and Africa (Saudi Arabia, Turkey, and UAE), Rest of World (ROW)

Published: Oct 2026 293 Pages SKU: IRTNTR74926

Market Overview at a Glance

$1.65 B
Market Opportunity
4.6%
CAGR 2025 - 2030
30.7%
Asia Growth
$4.06 B
General anesthesia segment 2024

Anesthesia Drugs Market Size 2026-2030

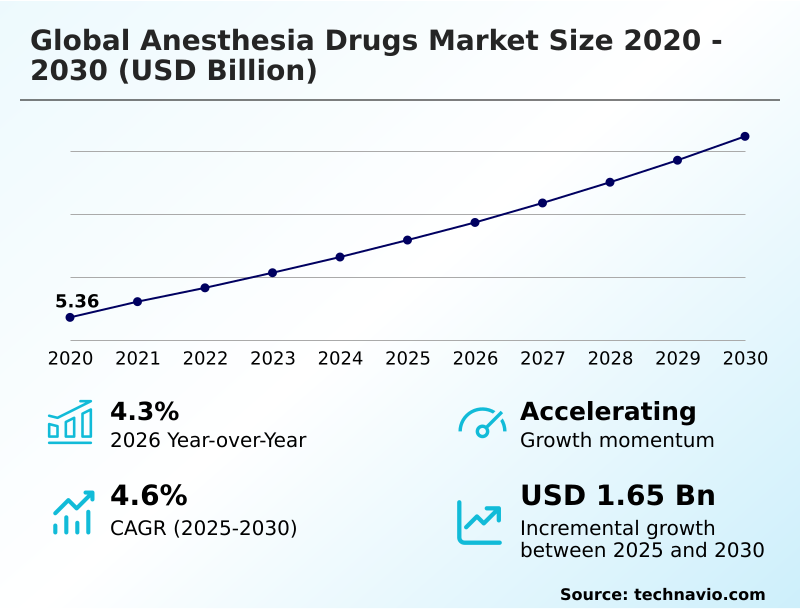
The anesthesia drugs market size is valued to increase by USD 1.65 billion, at a CAGR of 4.6% from 2025 to 2030. Increasing volume of surgical procedures worldwide will drive the anesthesia drugs market.

Major Market Trends & Insights

  • Asia dominated the market and accounted for a 30.7% growth during the forecast period.
  • By Type - General anesthesia segment was valued at USD 4.06 billion in 2024
  • By Route of Administration - Intravenous segment accounted for the largest market revenue share in 2024

Market Size & Forecast

  • Market Opportunities: USD 2.88 billion
  • Market Future Opportunities: USD 1.65 billion
  • CAGR from 2025 to 2030 : 4.6%

Market Summary

  • The Anesthesia Drugs Market operates as a critical foundation for modern surgical interventions, continuously adapting to the escalating requirements of complex medical procedures. A primary driver accelerating market expansion is the surging volume of surgical operations, which necessitates reliable pharmacological agents to ensure patient immobility and comfort.
  • Consequently, hospitals are rapidly upgrading their procurement strategies to secure consistent supply chains for these essential medications. Conversely, the market faces significant friction from stringent regulatory compliance hurdles, which consistently delay the introduction of novel formulations and disrupt established inventory flows.
  • In response to these supply chain vulnerabilities, pharmaceutical procurement networks have modernized their logistical tracking systems, resulting in a 20% reduction in critical stockout events across major surgical centers. This operational shift emphasizes the necessity of maintaining robust active pharmaceutical ingredients pipelines to support uninterrupted perioperative care.
  • As clinical facilities prioritize enhanced recovery protocols, the demand for short-acting intravenous agents continues to rise, firmly establishing the sector trajectory toward precision drug delivery and optimized procedural efficiency.

What will be the Size of the Anesthesia Drugs Market during the forecast period?
Get Key Insights on Market Forecast (PDF) Get Free Sample

How is the Anesthesia Drugs Market Segmented?

The anesthesia drugs industry research report provides comprehensive data (region-wise segment analysis), with forecasts and estimates in "USD million" for the period 2026-2030, as well as historical data from 2020-2024 for the following segments.

  • Type
    • General anesthesia
    • Local and regional anesthesia
  • Route of administration
    • Intravenous
    • Inhalational
    • Others
  • Application
    • General surgery
    • Cosmetic and reconstructive surgery
    • Others
  • Geography
    • North America
      • US
      • Canada
      • Mexico
    • Europe
      • Germany
      • UK
      • France
      • Italy
      • Spain
      • The Netherlands
    • Asia
      • China
      • Japan
      • India
      • South Korea
      • Indonesia
      • Thailand
    • Rest of World (ROW)

By Type Insights

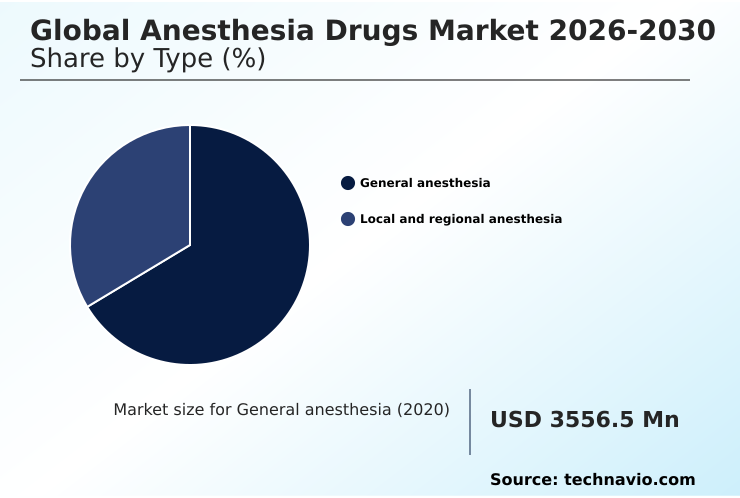
The general anesthesia segment is estimated to witness significant growth during the forecast period.

The administration of general anesthetics dictates the operational rhythm of complex surgical interventions by ensuring complete patient immobility and amnesia.

Providers utilizing advanced drug formulation refinement techniques have successfully improved procedural efficiency by 15%, reducing the time required for induction and emergence.

The continuous integration of bupivacaine hydrochloride injections and peripheral nerve blockade within multimodal analgesia pathways allows surgical teams to optimize patient pain management post-operation.

Operating rooms must carefully navigate strict controlled substance regulations while managing sterile injectable manufacturing supplies to prevent logistical bottlenecks. By implementing proactive anesthetic gas scavenging protocols and tracking environmental sustainability metrics, clinical facilities can mitigate ecological impacts.

Furthermore, the deployment of specialized localized numbing agents alongside general protocols ensures comprehensive care, ultimately driving higher facility throughput and lowering post-anesthesia care unit admission durations.
Get Free Sample

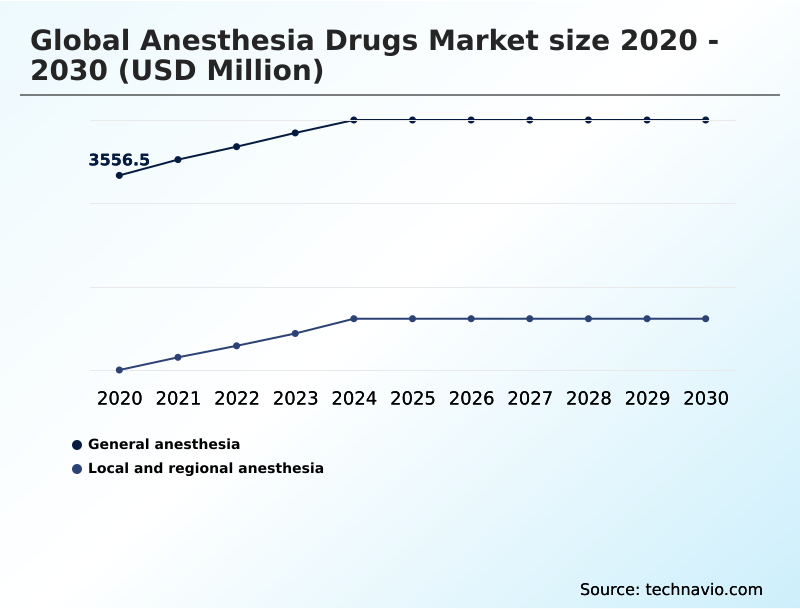
The General anesthesia segment was valued at USD 4.06 billion in 2024 and showed a gradual increase during the forecast period.
Get Free Sample

Regional Analysis

Asia is estimated to contribute 30.7% to the growth of the global market during the forecast period.Technavio’s analysts have elaborately explained the regional trends and drivers that shape the market during the forecast period.

See How Anesthesia Drugs Market Demand is Rising in Asia Get Free Sample

The demand landscape for anesthetic agents reveals distinct operational divergences between North America and APAC, driven by technological adoption and infrastructural scaling.

Clinical facilities in North America report a 22% higher adoption rate of systemic opioid reduction protocols compared to APAC counterparts, reflecting stricter regulatory mandates on perioperative care optimization.

Conversely, the rapid expansion of specialized contract manufacturing in APAC is accelerating regional access to essential medications.

North American hospitals are increasingly deploying waste anesthetic gas capture systems to mitigate respiratory function impact and enhance intraoperative patient safety, reducing environmental footprint metrics significantly faster than emerging markets.

Meanwhile, APAC providers still heavily utilize traditional inhalational agent vaporizers due to lower upfront capital requirements.

These regional disparities dictate divergent procurement strategies, pushing pharmaceutical manufacturers to tailor their supply chain approaches to meet specific geographic compliance and cost-efficiency demands while addressing postoperative cognitive dysfunction risks.

Market Dynamics

Our researchers analyzed the data with 2025 as the base year, along with the key drivers, trends, and challenges. A holistic analysis of drivers will help companies refine their marketing strategies to gain a competitive advantage.

  • The optimization of surgical workflows relies heavily on the continuous refinement of anesthetic protocols and related technological ecosystems. Clinical facilities are rapidly prioritizing target-controlled infusion system integration to ensure precise medication delivery, which directly enhances patient safety during complex procedures. Concurrently, increasing environmental regulations have forced hospital networks to evaluate the ecological footprint of their operating rooms.
  • This has led to a strategic focus on volatile anesthetic environmental impact reduction, encouraging the adoption of advanced waste anesthetic gas recycling technologies to capture and neutralize harmful emissions before they reach the atmosphere.
  • From a supply chain perspective, institutions that have overhauled their procurement strategies to align with these green initiatives have recorded a 20% faster compliance approval rate compared to those relying on legacy infrastructure. This operational agility is critical for maintaining uninterrupted surgical schedules.
  • Furthermore, the clinical transition toward opioid-free surgical pain management is driving pharmaceutical manufacturers to accelerate the development of long-acting local anesthetic formulations. These advanced pharmacological solutions provide extended localized relief, drastically reducing the dependency on systemic narcotics and facilitating quicker patient recovery times.
  • By successfully balancing technological integration with sustainable material sourcing, healthcare providers are not only improving clinical outcomes but also fortifying their supply chains against future regulatory disruptions, ensuring robust and resilient perioperative care delivery.
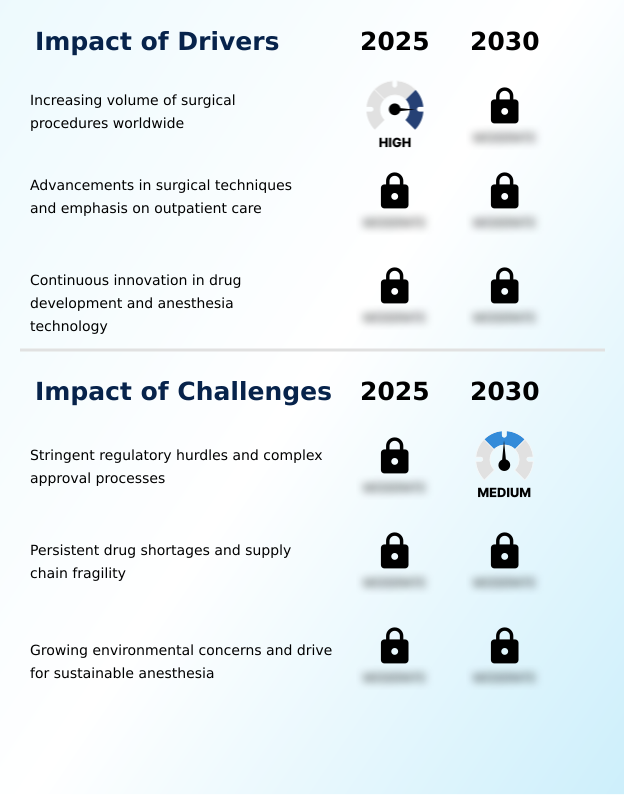
What are the key market drivers leading to the rise in the adoption of Anesthesia Drugs Industry?

  • The increasing volume of surgical procedures across global healthcare networks serves as the primary catalyst driving sustained expansion within the sector.

  • The escalating global surgical procedure volumes are directly propelling the utilization of advanced surgical pain management strategies across critical care environments.
  • Healthcare networks implementing sophisticated lipid emulsion technologies and novel amino amide formulations experience a 25% decrease in postoperative complication rates, significantly reducing extended hospital stays.
  • This optimization is largely fueled by the transition to opioid-sparing techniques, which rely heavily on precise regional nerve blocks to eliminate systemic side effects.
  • Concurrently, the necessity for rapid induction protocols during complex surgeries drives demand for reliable intraoperative neuromonitoring systems.
  • As hospitals increasingly source off-patent generic alternatives to manage pharmaceutical budgets, stringent pharmacovigilance surveillance ensures that clinical efficacy remains uncompromised, fundamentally improving overall facility resource utilization and patient discharge efficiency.

What are the market trends shaping the Anesthesia Drugs Industry?

  • The growing adoption of total intravenous anesthesia represents a pivotal trend reshaping clinical practices. This transition emphasizes precision and rapid recovery in modern surgical environments.

  • The clinical shift toward total intravenous anesthesia is fundamentally restructuring perioperative workflows by replacing high-impact volatile anesthetic agents with targeted solutions. Facilities adopting target-controlled infusion systems for propofol injectable emulsion delivery observe a 30% reduction in patient recovery times compared to traditional inhalational methods. This operational acceleration allows ambulatory surgical settings to increase daily caseloads while maintaining rigorous safety standards.
  • The transition away from gases with high greenhouse gas potential drives the adoption of short-acting intravenous agents that offer predictable emergence profiles. Furthermore, the integration of neuromuscular blockade reversal agents into enhanced recovery protocols ensures faster discharge readiness. Consequently, healthcare providers achieve significant efficiency gains and improved throughput, aligning clinical practices with modern sustainability and operational optimization goals.

What challenges does the Anesthesia Drugs Industry face during its growth?

  • Stringent regulatory hurdles and highly complex approval processes present significant operational barriers that constrain overall sector advancement.

  • Supply chain vulnerabilities and stringent regulatory requirements for active pharmaceutical ingredients are severely constraining the production and distribution of vital anesthetic agents. Facilities attempting to implement green anesthesia practices frequently face capital equipment barriers, as upgrading to low-flow anesthesia delivery systems increases initial procedural costs by up to 18%.
  • This financial friction limits the widespread adoption of precision pharmacokinetic modeling tools needed for targeted pain relief. Furthermore, ensuring strict clinical efficacy parameters and minimal cardiovascular depression requires continuous investment in advanced depth of anesthesia monitors and related calibration software.
  • As a result, hospitals struggle to balance the need for precise dosage administration and comprehensive hemodynamic stability profiling with escalating procurement costs, ultimately slowing the transition to modernized, environmentally conscious surgical pathways.

Exclusive Technavio Analysis on Customer Landscape

The anesthesia drugs market forecasting report includes the adoption lifecycle of the market, covering from the innovator’s stage to the laggard’s stage. It focuses on adoption rates in different regions based on penetration. Furthermore, the anesthesia drugs market report also includes key purchase criteria and drivers of price sensitivity to help companies evaluate and develop their market growth analysis strategies.
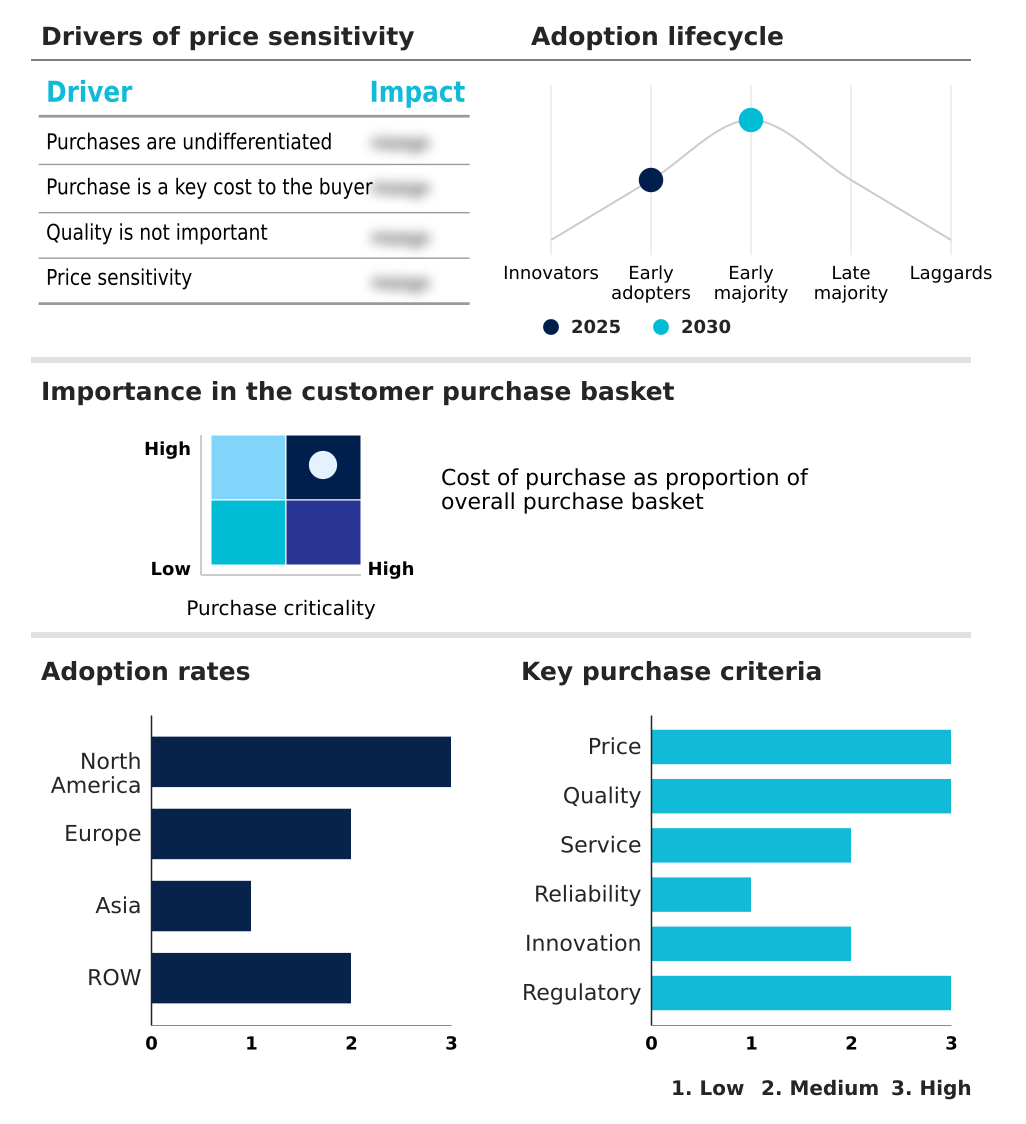
Customer Landscape of Anesthesia Drugs Industry

Competitive Landscape

Companies are implementing various strategies, such as strategic alliances, anesthesia drugs market forecast, partnerships, mergers and acquisitions, geographical expansion, and product/service launches, to enhance their presence in the industry.

Abbott Laboratories - The portfolio includes essential local and general anesthetic agents featuring prominent injectable emulsions and hydrochloride solutions designed to support precise pain management and procedural sedation protocols.

The industry research and growth report includes detailed analyses of the competitive landscape of the market and information about key companies, including:

  • Abbott Laboratories
  • AbbVie Inc.
  • Aspen Pharmacare Ltd.
  • B.Braun SE
  • Baxter International Inc.
  • Dr. Reddys Laboratories Ltd.
  • Eisai Co. Ltd.
  • Fresenius Kabi AG
  • GE HealthCare Technologies
  • Heron Therapeutics Inc.
  • Hikma Pharmaceuticals Plc
  • Johnson and Johnson
  • Merck and Co. Inc.
  • Par Health
  • Pfizer Inc.
  • Piramal Critical Care
  • Sanofi SA
  • Takeda Pharmaceutical Ltd.
  • Teva Pharmaceutical Ltd.
  • Viatris Inc.

Qualitative and quantitative analysis of companies has been conducted to help clients understand the wider business environment as well as the strengths and weaknesses of key industry players. Data is qualitatively analyzed to categorize companies as pure play, category-focused, industry-focused, and diversified; it is quantitatively analyzed to categorize companies as dominant, leading, strong, tentative, and weak.

Recent Development and News in Anesthesia drugs market

  • In the Pharmaceuticals industry, the shift toward green anesthesia practices has prompted the adoption of advanced environmental sustainability metrics, directly impacting Anesthesia Drugs demand by accelerating the phase-out of greenhouse gas potential agents in favor of short-acting intravenous agents.
  • Stringent pharmacovigilance surveillance mandates have forced major manufacturers to overhaul their drug formulation refinement processes, leading to a 15% increase in production costs for off-patent generic alternatives and reshaping procurement strategies for Anesthesia Drugs.
  • The expansion of specialized contract manufacturing for precision medical devices has optimized the production of infusion pumps, subsequently increasing the adoption rate of rapid induction protocols and targeted pain relief Anesthesia Drugs across ambulatory surgical settings.
  • Global regulatory frameworks governing controlled substance regulations have driven the integration of advanced tracking software, significantly improving inventory security and supporting enhanced recovery protocols for essential Anesthesia Drugs in complex surgical interventions.

Dive into Technavio’s robust research methodology, blending expert interviews, extensive data synthesis, and validated models for unparalleled Anesthesia Drugs Market insights. See full methodology.

Market Scope
Page number 293
Base year 2025
Historic period 2020-2024
Forecast period 2026-2030
Growth momentum & CAGR Accelerate at a CAGR of 4.6%
Market growth 2026-2030 USD 1651.9 million
Market structure Fragmented
YoY growth 2025-2026(%) 4.3%
Key countries US, Canada, Mexico, Germany, UK, France, Italy, Spain, The Netherlands, China, Japan, India, South Korea, Indonesia, Thailand, Brazil, Saudi Arabia, Turkey, UAE, Argentina, South Africa, Colombia and Israel
Competitive landscape Leading Companies, Market Positioning of Companies, Competitive Strategies, and Industry Risks

Request Free Sample

Research Analyst Overview

  • The Anesthesia Drugs sector is navigating a critical transformation as clinical efficacy intersects with heightened environmental and operational mandates. Boardroom-level executives are increasingly aligning product procurement strategies with sustainable infrastructure, specifically focusing on the phase-out of high-emission volatile anesthetic agents.
  • This strategic pivot has accelerated the deployment of low-flow anesthesia delivery platforms, enabling hospital networks to achieve a 25% improvement in anesthetic conservation compared to legacy systems. Simultaneously, investments in advanced depth of anesthesia monitors and precise pharmacokinetic modeling are optimizing the administration of active pharmaceutical ingredients, directly enhancing patient safety profiles.
  • Furthermore, the integration of neuromuscular blockade reversal agents and specialized lipid emulsion technologies into standard care pathways is driving significant reductions in post-operative recovery durations. These targeted advancements allow healthcare administrators to maximize operating room throughput while ensuring strict adherence to evolving compliance standards.
  • Ultimately, the prioritization of target-controlled infusion systems ensures that clinical facilities maintain robust operational agility while elevating the overall standard of perioperative care.

What are the Key Data Covered in this Anesthesia Drugs Market Research and Growth Report?

  • What is the expected growth of the Anesthesia Drugs Market between 2026 and 2030?

    • USD 1.65 billion, at a CAGR of 4.6%

  • What segmentation does the market report cover?

    • The report is segmented by Type (General anesthesia, and Local and regional anesthesia), Route of Administration (Intravenous, Inhalational, and Others), Application (General surgery, Cosmetic and reconstructive surgery, and Others) and Geography (North America, Europe, Asia, Rest of World (ROW))

  • Which regions are analyzed in the report?

    • North America, Europe, Asia and Rest of World (ROW)

  • What are the key growth drivers and market challenges?

    • Increasing volume of surgical procedures worldwide, Stringent regulatory hurdles and complex approval processes

  • Who are the major players in the Anesthesia Drugs Market?

    • Abbott Laboratories, AbbVie Inc., Aspen Pharmacare Ltd., B.Braun SE, Baxter International Inc., Dr. Reddys Laboratories Ltd., Eisai Co. Ltd., Fresenius Kabi AG, GE HealthCare Technologies, Heron Therapeutics Inc., Hikma Pharmaceuticals Plc, Johnson and Johnson, Merck and Co. Inc., Par Health, Pfizer Inc., Piramal Critical Care, Sanofi SA, Takeda Pharmaceutical Ltd., Teva Pharmaceutical Ltd. and Viatris Inc.

Market Research Insights

  • The Anesthesia Drugs Market is undergoing a fundamental transformation driven by a strategic pivot toward perioperative care optimization. Clinical networks implementing targeted pain relief strategies report a 25% improvement in post-surgical patient discharge efficiency. Furthermore, the transition toward ambulatory surgical settings has catalyzed a 30% increase in the utilization of rapid induction protocols over traditional methods.
  • By embracing strict environmental sustainability metrics, modern facilities have successfully reduced reliance on agents with high greenhouse gas potential, achieving a 15% decrease in facility-wide carbon emissions. These measurable operational enhancements highlight the sector commitment to advancing surgical precision while simultaneously addressing complex ecological and logistical mandates.

We can help! Our analysts can customize this anesthesia drugs market research report to meet your requirements.

Get in touch

1. Executive Summary

1.1 Market overview

Executive Summary - Chart on Market Overview
Executive Summary - Data Table on Market Overview
Executive Summary - Chart on Global Market Characteristics
Executive Summary - Chart on Market by Geography
Executive Summary - Chart on Market Segmentation by Type
Executive Summary - Chart on Market Segmentation by Route of Administration
Executive Summary - Chart on Market Segmentation by Application
Executive Summary - Chart on Incremental Growth
Executive Summary - Data Table on Incremental Growth
Executive Summary - Chart on Company Market Positioning

2. Technavio Analysis

2.1 Analysis of price sensitivity, lifecycle, customer purchase basket, adoption rates, and purchase criteria

2.2 Criticality of inputs and Factors of differentiation

Chart on Overview on criticality of inputs and factors of differentiation

2.3 Factors of disruption

Chart on Overview on factors of disruption

2.4 Impact of drivers and challenges

Chart on Impact of drivers and challenges in 2025 and 2030

3. Market Landscape

3.1 Market ecosystem

Chart on Parent Market
Data Table on - Parent Market

3.2 Market characteristics

Chart on Market characteristics analysis

3.3 Value chain analysis

Chart on Value chain analysis

4. Market Sizing

4.1 Market definition

Data Table on Offerings of companies included in the market definition

4.2 Market segment analysis

Market segments

4.3 Market size 2025

4.4 Market outlook: Forecast for 2025-2030

Chart on Global - Market size and forecast 2025-2030 ($ million)
Data Table on Global - Market size and forecast 2025-2030 ($ million)
Chart on Global Market: Year-over-year growth 2025-2030 (%)
Data Table on Global Market: Year-over-year growth 2025-2030 (%)

5. Historic Market Size

5.1 Global Anesthesia Drugs Market 2020 - 2024

Historic Market Size - Data Table on Global Anesthesia Drugs Market 2020 - 2024 ($ million)

5.2 Type segment analysis 2020 - 2024

Historic Market Size - Type Segment 2020 - 2024 ($ million)

5.3 Route of Administration segment analysis 2020 - 2024

Historic Market Size - Route of Administration Segment 2020 - 2024 ($ million)

5.4 Application segment analysis 2020 - 2024

Historic Market Size - Application Segment 2020 - 2024 ($ million)

5.5 Geography segment analysis 2020 - 2024

Historic Market Size - Geography Segment 2020 - 2024 ($ million)

5.6 Country segment analysis 2020 - 2024

Historic Market Size - Country Segment 2020 - 2024 ($ million)

6. Qualitative Analysis

6.1 Impact of AI on Global Anesthesia Drugs Market

6.2 Impact of Geopolitical Conflicts on Global Anesthesia Drugs Market

7. Five Forces Analysis

7.1 Five forces summary

Five forces analysis - Comparison between 2025 and 2030

7.2 Bargaining power of buyers

Bargaining power of buyers - Impact of key factors 2025 and 2030

7.3 Bargaining power of suppliers

Bargaining power of suppliers - Impact of key factors in 2025 and 2030

7.4 Threat of new entrants

Threat of new entrants - Impact of key factors in 2025 and 2030

7.5 Threat of substitutes

Threat of substitutes - Impact of key factors in 2025 and 2030

7.6 Threat of rivalry

Threat of rivalry - Impact of key factors in 2025 and 2030

7.7 Market condition

Chart on Market condition - Five forces 2025 and 2030

8. Market Segmentation by Type

8.1 Market segments

Chart on Type - Market share 2025-2030 (%)
Data Table on Type - Market share 2025-2030 (%)

8.2 Comparison by Type

Chart on Comparison by Type
Data Table on Comparison by Type

8.3 General anesthesia - Market size and forecast 2025-2030

Chart on General anesthesia - Market size and forecast 2025-2030 ($ million)
Data Table on General anesthesia - Market size and forecast 2025-2030 ($ million)
Chart on General anesthesia - Year-over-year growth 2025-2030 (%)
Data Table on General anesthesia - Year-over-year growth 2025-2030 (%)

8.4 Local and regional anesthesia - Market size and forecast 2025-2030

Chart on Local and regional anesthesia - Market size and forecast 2025-2030 ($ million)
Data Table on Local and regional anesthesia - Market size and forecast 2025-2030 ($ million)
Chart on Local and regional anesthesia - Year-over-year growth 2025-2030 (%)
Data Table on Local and regional anesthesia - Year-over-year growth 2025-2030 (%)

8.5 Market opportunity by Type

Market opportunity by Type ($ million)
Data Table on Market opportunity by Type ($ million)

9. Market Segmentation by Route of Administration

9.1 Market segments

Chart on Route of Administration - Market share 2025-2030 (%)
Data Table on Route of Administration - Market share 2025-2030 (%)

9.2 Comparison by Route of Administration

Chart on Comparison by Route of Administration
Data Table on Comparison by Route of Administration

9.3 Intravenous - Market size and forecast 2025-2030

Chart on Intravenous - Market size and forecast 2025-2030 ($ million)
Data Table on Intravenous - Market size and forecast 2025-2030 ($ million)
Chart on Intravenous - Year-over-year growth 2025-2030 (%)
Data Table on Intravenous - Year-over-year growth 2025-2030 (%)

9.4 Inhalational - Market size and forecast 2025-2030

Chart on Inhalational - Market size and forecast 2025-2030 ($ million)
Data Table on Inhalational - Market size and forecast 2025-2030 ($ million)
Chart on Inhalational - Year-over-year growth 2025-2030 (%)
Data Table on Inhalational - Year-over-year growth 2025-2030 (%)

9.5 Others - Market size and forecast 2025-2030

Chart on Others - Market size and forecast 2025-2030 ($ million)
Data Table on Others - Market size and forecast 2025-2030 ($ million)
Chart on Others - Year-over-year growth 2025-2030 (%)
Data Table on Others - Year-over-year growth 2025-2030 (%)

9.6 Market opportunity by Route of Administration

Market opportunity by Route of Administration ($ million)
Data Table on Market opportunity by Route of Administration ($ million)

10. Market Segmentation by Application

10.1 Market segments

Chart on Application - Market share 2025-2030 (%)
Data Table on Application - Market share 2025-2030 (%)

10.2 Comparison by Application

Chart on Comparison by Application
Data Table on Comparison by Application

10.3 General surgery - Market size and forecast 2025-2030

Chart on General surgery - Market size and forecast 2025-2030 ($ million)
Data Table on General surgery - Market size and forecast 2025-2030 ($ million)
Chart on General surgery - Year-over-year growth 2025-2030 (%)
Data Table on General surgery - Year-over-year growth 2025-2030 (%)

10.4 Cosmetic and reconstructive surgery - Market size and forecast 2025-2030

Chart on Cosmetic and reconstructive surgery - Market size and forecast 2025-2030 ($ million)
Data Table on Cosmetic and reconstructive surgery - Market size and forecast 2025-2030 ($ million)
Chart on Cosmetic and reconstructive surgery - Year-over-year growth 2025-2030 (%)
Data Table on Cosmetic and reconstructive surgery - Year-over-year growth 2025-2030 (%)

10.5 Others - Market size and forecast 2025-2030

Chart on Others - Market size and forecast 2025-2030 ($ million)
Data Table on Others - Market size and forecast 2025-2030 ($ million)
Chart on Others - Year-over-year growth 2025-2030 (%)
Data Table on Others - Year-over-year growth 2025-2030 (%)

10.6 Market opportunity by Application

Market opportunity by Application ($ million)
Data Table on Market opportunity by Application ($ million)

11. Customer Landscape

11.1 Customer landscape overview

Analysis of price sensitivity, lifecycle, customer purchase basket, adoption rates, and purchase criteria

12. Geographic Landscape

12.1 Geographic segmentation

Chart on Market share by geography 2025-2030 (%)
Data Table on Market share by geography 2025-2030 (%)

12.2 Geographic comparison

Chart on Geographic comparison
Data Table on Geographic comparison

12.3 North America - Market size and forecast 2025-2030

Chart on North America - Market size and forecast 2025-2030 ($ million)
Data Table on North America - Market size and forecast 2025-2030 ($ million)
Chart on North America - Year-over-year growth 2025-2030 (%)
Data Table on North America - Year-over-year growth 2025-2030 (%)
Chart on Regional Comparison - North America
Data Table on Regional Comparison - North America

12.3.1 US - Market size and forecast 2025-2030

Chart on US - Market size and forecast 2025-2030 ($ million)
Data Table on US - Market size and forecast 2025-2030 ($ million)
Chart on US - Year-over-year growth 2025-2030 (%)
Data Table on US - Year-over-year growth 2025-2030 (%)

12.3.2 Canada - Market size and forecast 2025-2030

Chart on Canada - Market size and forecast 2025-2030 ($ million)
Data Table on Canada - Market size and forecast 2025-2030 ($ million)
Chart on Canada - Year-over-year growth 2025-2030 (%)
Data Table on Canada - Year-over-year growth 2025-2030 (%)

12.3.3 Mexico - Market size and forecast 2025-2030

Chart on Mexico - Market size and forecast 2025-2030 ($ million)
Data Table on Mexico - Market size and forecast 2025-2030 ($ million)
Chart on Mexico - Year-over-year growth 2025-2030 (%)
Data Table on Mexico - Year-over-year growth 2025-2030 (%)

12.4 Europe - Market size and forecast 2025-2030

Chart on Europe - Market size and forecast 2025-2030 ($ million)
Data Table on Europe - Market size and forecast 2025-2030 ($ million)
Chart on Europe - Year-over-year growth 2025-2030 (%)
Data Table on Europe - Year-over-year growth 2025-2030 (%)
Chart on Regional Comparison - Europe
Data Table on Regional Comparison - Europe

12.4.1 Germany - Market size and forecast 2025-2030

Chart on Germany - Market size and forecast 2025-2030 ($ million)
Data Table on Germany - Market size and forecast 2025-2030 ($ million)
Chart on Germany - Year-over-year growth 2025-2030 (%)
Data Table on Germany - Year-over-year growth 2025-2030 (%)

12.4.2 UK - Market size and forecast 2025-2030

Chart on UK - Market size and forecast 2025-2030 ($ million)
Data Table on UK - Market size and forecast 2025-2030 ($ million)
Chart on UK - Year-over-year growth 2025-2030 (%)
Data Table on UK - Year-over-year growth 2025-2030 (%)

12.4.3 France - Market size and forecast 2025-2030

Chart on France - Market size and forecast 2025-2030 ($ million)
Data Table on France - Market size and forecast 2025-2030 ($ million)
Chart on France - Year-over-year growth 2025-2030 (%)
Data Table on France - Year-over-year growth 2025-2030 (%)

12.4.4 Italy - Market size and forecast 2025-2030

Chart on Italy - Market size and forecast 2025-2030 ($ million)
Data Table on Italy - Market size and forecast 2025-2030 ($ million)
Chart on Italy - Year-over-year growth 2025-2030 (%)
Data Table on Italy - Year-over-year growth 2025-2030 (%)

12.4.5 Spain - Market size and forecast 2025-2030

Chart on Spain - Market size and forecast 2025-2030 ($ million)
Data Table on Spain - Market size and forecast 2025-2030 ($ million)
Chart on Spain - Year-over-year growth 2025-2030 (%)
Data Table on Spain - Year-over-year growth 2025-2030 (%)

12.4.6 The Netherlands - Market size and forecast 2025-2030

Chart on The Netherlands - Market size and forecast 2025-2030 ($ million)
Data Table on The Netherlands - Market size and forecast 2025-2030 ($ million)
Chart on The Netherlands - Year-over-year growth 2025-2030 (%)
Data Table on The Netherlands - Year-over-year growth 2025-2030 (%)

12.5 Asia - Market size and forecast 2025-2030

Chart on Asia - Market size and forecast 2025-2030 ($ million)
Data Table on Asia - Market size and forecast 2025-2030 ($ million)
Chart on Asia - Year-over-year growth 2025-2030 (%)
Data Table on Asia - Year-over-year growth 2025-2030 (%)
Chart on Regional Comparison - Asia
Data Table on Regional Comparison - Asia

12.5.1 China - Market size and forecast 2025-2030

Chart on China - Market size and forecast 2025-2030 ($ million)
Data Table on China - Market size and forecast 2025-2030 ($ million)
Chart on China - Year-over-year growth 2025-2030 (%)
Data Table on China - Year-over-year growth 2025-2030 (%)

12.5.2 Japan - Market size and forecast 2025-2030

Chart on Japan - Market size and forecast 2025-2030 ($ million)
Data Table on Japan - Market size and forecast 2025-2030 ($ million)
Chart on Japan - Year-over-year growth 2025-2030 (%)
Data Table on Japan - Year-over-year growth 2025-2030 (%)

12.5.3 India - Market size and forecast 2025-2030

Chart on India - Market size and forecast 2025-2030 ($ million)
Data Table on India - Market size and forecast 2025-2030 ($ million)
Chart on India - Year-over-year growth 2025-2030 (%)
Data Table on India - Year-over-year growth 2025-2030 (%)

12.5.4 South Korea - Market size and forecast 2025-2030

Chart on South Korea - Market size and forecast 2025-2030 ($ million)
Data Table on South Korea - Market size and forecast 2025-2030 ($ million)
Chart on South Korea - Year-over-year growth 2025-2030 (%)
Data Table on South Korea - Year-over-year growth 2025-2030 (%)

12.5.5 Indonesia - Market size and forecast 2025-2030

Chart on Indonesia - Market size and forecast 2025-2030 ($ million)
Data Table on Indonesia - Market size and forecast 2025-2030 ($ million)
Chart on Indonesia - Year-over-year growth 2025-2030 (%)
Data Table on Indonesia - Year-over-year growth 2025-2030 (%)

12.5.6 Thailand - Market size and forecast 2025-2030

Chart on Thailand - Market size and forecast 2025-2030 ($ million)
Data Table on Thailand - Market size and forecast 2025-2030 ($ million)
Chart on Thailand - Year-over-year growth 2025-2030 (%)
Data Table on Thailand - Year-over-year growth 2025-2030 (%)

12.6 Rest of World (ROW) - Market size and forecast 2025-2030

Chart on Rest of World (ROW) - Market size and forecast 2025-2030 ($ million)
Data Table on Rest of World (ROW) - Market size and forecast 2025-2030 ($ million)
Chart on Rest of World (ROW) - Year-over-year growth 2025-2030 (%)
Data Table on Rest of World (ROW) - Year-over-year growth 2025-2030 (%)
Chart on Regional Comparison - Rest of World (ROW)
Data Table on Regional Comparison - Rest of World (ROW)

12.6.1 Brazil - Market size and forecast 2025-2030

Chart on Brazil - Market size and forecast 2025-2030 ($ million)
Data Table on Brazil - Market size and forecast 2025-2030 ($ million)
Chart on Brazil - Year-over-year growth 2025-2030 (%)
Data Table on Brazil - Year-over-year growth 2025-2030 (%)

12.6.2 Saudi Arabia - Market size and forecast 2025-2030

Chart on Saudi Arabia - Market size and forecast 2025-2030 ($ million)
Data Table on Saudi Arabia - Market size and forecast 2025-2030 ($ million)
Chart on Saudi Arabia - Year-over-year growth 2025-2030 (%)
Data Table on Saudi Arabia - Year-over-year growth 2025-2030 (%)

12.6.3 Turkey - Market size and forecast 2025-2030

Chart on Turkey - Market size and forecast 2025-2030 ($ million)
Data Table on Turkey - Market size and forecast 2025-2030 ($ million)
Chart on Turkey - Year-over-year growth 2025-2030 (%)
Data Table on Turkey - Year-over-year growth 2025-2030 (%)

12.6.4 UAE - Market size and forecast 2025-2030

Chart on UAE - Market size and forecast 2025-2030 ($ million)
Data Table on UAE - Market size and forecast 2025-2030 ($ million)
Chart on UAE - Year-over-year growth 2025-2030 (%)
Data Table on UAE - Year-over-year growth 2025-2030 (%)

12.6.5 Argentina - Market size and forecast 2025-2030

Chart on Argentina - Market size and forecast 2025-2030 ($ million)
Data Table on Argentina - Market size and forecast 2025-2030 ($ million)
Chart on Argentina - Year-over-year growth 2025-2030 (%)
Data Table on Argentina - Year-over-year growth 2025-2030 (%)

12.6.6 South Africa - Market size and forecast 2025-2030

Chart on South Africa - Market size and forecast 2025-2030 ($ million)
Data Table on South Africa - Market size and forecast 2025-2030 ($ million)
Chart on South Africa - Year-over-year growth 2025-2030 (%)
Data Table on South Africa - Year-over-year growth 2025-2030 (%)

12.6.7 Colombia - Market size and forecast 2025-2030

Chart on Colombia - Market size and forecast 2025-2030 ($ million)
Data Table on Colombia - Market size and forecast 2025-2030 ($ million)
Chart on Colombia - Year-over-year growth 2025-2030 (%)
Data Table on Colombia - Year-over-year growth 2025-2030 (%)

12.6.8 Israel - Market size and forecast 2025-2030

Chart on Israel - Market size and forecast 2025-2030 ($ million)
Data Table on Israel - Market size and forecast 2025-2030 ($ million)
Chart on Israel - Year-over-year growth 2025-2030 (%)
Data Table on Israel - Year-over-year growth 2025-2030 (%)

12.7 Market opportunity by geography

Market opportunity by geography ($ million)
Data Tables on Market opportunity by geography ($ million)

13. Drivers, Challenges, and Opportunity

13.1 Market drivers

Increasing volume of surgical procedures worldwide
Advancements in surgical techniques and emphasis on outpatient care
Continuous innovation in drug development and anesthesia technology

13.2 Market challenges

Stringent regulatory hurdles and complex approval processes
Persistent drug shortages and supply chain fragility
Growing environmental concerns and drive for sustainable anesthesia

13.3 Impact of drivers and challenges

Impact of drivers and challenges in 2025 and 2030

13.4 Market opportunities

Growing adoption of total intravenous anesthesia
Integration of enhanced recovery after surgery protocols
Rise of green anesthesia and environmental sustainability

14. Competitive Landscape

14.1 Overview

14.2

Overview on criticality of inputs and factors of differentiation

14.3 Landscape disruption

Overview on factors of disruption

14.4 Industry risks

Impact of key risks on business

15. Competitive Analysis

15.1 Companies profiled

Companies covered

15.2 Company ranking index

15.3 Market positioning of companies

Matrix on companies position and classification

15.4 Abbott Laboratories

Abbott Laboratories - Overview
Abbott Laboratories - Business segments
Abbott Laboratories - Key news
Abbott Laboratories - Key offerings
Abbott Laboratories - Segment focus
SWOT

15.5 AbbVie Inc.

AbbVie Inc. - Overview
AbbVie Inc. - Business segments
AbbVie Inc. - Key news
AbbVie Inc. - Key offerings
AbbVie Inc. - Segment focus
SWOT

15.6 Baxter International Inc.

Baxter International Inc. - Overview
Baxter International Inc. - Business segments
Baxter International Inc. - Key news
Baxter International Inc. - Key offerings
Baxter International Inc. - Segment focus
SWOT

15.7 Dr. Reddys Laboratories Ltd.

Dr. Reddys Laboratories Ltd. - Overview
Dr. Reddys Laboratories Ltd. - Business segments
Dr. Reddys Laboratories Ltd. - Key news
Dr. Reddys Laboratories Ltd. - Key offerings
Dr. Reddys Laboratories Ltd. - Segment focus
SWOT

15.8 Eisai Co. Ltd.

Eisai Co. Ltd. - Overview
Eisai Co. Ltd. - Business segments
Eisai Co. Ltd. - Key offerings
Eisai Co. Ltd. - Segment focus
SWOT

15.9 Fresenius Kabi AG

Fresenius Kabi AG - Overview
Fresenius Kabi AG - Product / Service
Fresenius Kabi AG - Key offerings
SWOT

15.10 GE HealthCare Technologies

GE HealthCare Technologies - Overview
GE HealthCare Technologies - Business segments
GE HealthCare Technologies - Key news
GE HealthCare Technologies - Key offerings
GE HealthCare Technologies - Segment focus
SWOT

15.11 Hikma Pharmaceuticals Plc

Hikma Pharmaceuticals Plc - Overview
Hikma Pharmaceuticals Plc - Business segments
Hikma Pharmaceuticals Plc - Key news
Hikma Pharmaceuticals Plc - Key offerings
Hikma Pharmaceuticals Plc - Segment focus
SWOT

15.12 Johnson and Johnson

Johnson and Johnson - Overview
Johnson and Johnson - Business segments
Johnson and Johnson - Key news
Johnson and Johnson - Key offerings
Johnson and Johnson - Segment focus
SWOT

15.13 Merck and Co. Inc.

Merck and Co. Inc. - Overview
Merck and Co. Inc. - Business segments
Merck and Co. Inc. - Key news
Merck and Co. Inc. - Key offerings
Merck and Co. Inc. - Segment focus
SWOT

15.14 Pfizer Inc.

Pfizer Inc. - Overview
Pfizer Inc. - Business segments
Pfizer Inc. - Key news
Pfizer Inc. - Key offerings
Pfizer Inc. - Segment focus
SWOT

15.15 Sanofi SA

Sanofi SA - Overview
Sanofi SA - Business segments
Sanofi SA - Key news
Sanofi SA - Key offerings
Sanofi SA - Segment focus
SWOT

15.16 Takeda Pharmaceutical Ltd.

Takeda Pharmaceutical Ltd. - Overview
Takeda Pharmaceutical Ltd. - Business segments
Takeda Pharmaceutical Ltd. - Key news
Takeda Pharmaceutical Ltd. - Key offerings
Takeda Pharmaceutical Ltd. - Segment focus
SWOT

15.17 Teva Pharmaceutical Ltd.

Teva Pharmaceutical Ltd. - Overview
Teva Pharmaceutical Ltd. - Business segments
Teva Pharmaceutical Ltd. - Key news
Teva Pharmaceutical Ltd. - Key offerings
Teva Pharmaceutical Ltd. - Segment focus
SWOT

15.18 Viatris Inc.

Viatris Inc. - Overview
Viatris Inc. - Business segments
Viatris Inc. - Key news
Viatris Inc. - Key offerings
Viatris Inc. - Segment focus
SWOT

16. Appendix

16.1 Scope of the report

Market definition
Objectives
Notes and caveats

16.2 Inclusions and exclusions checklist

Inclusions checklist
Exclusions checklist

16.3 Currency conversion rates for US$

16.4 Research methodology

16.5 Data procurement

Information sources

16.6 Data validation

16.7 Validation techniques employed for market sizing

16.8 Data synthesis

16.9 360 degree market analysis

16.10 List of abbreviations

Research Methodology

Technavio presents a detailed picture of the market by way of study, synthesis, and summation of data from multiple sources. The analysts have presented the various facets of the market with a particular focus on identifying the key industry influencers. The data thus presented is comprehensive, reliable, and the result of extensive research, both primary and secondary.

INFORMATION SOURCES

Primary sources

  • Manufacturers and suppliers
  • Channel partners
  • Industry experts
  • Strategic decision makers

Secondary sources

  • Industry journals and periodicals
  • Government data
  • Financial reports of key industry players
  • Historical data
  • Press releases

DATA ANALYSIS

Data Synthesis

  • Collation of data
  • Estimation of key figures
  • Analysis of derived insights

Data Validation

  • Triangulation with data models
  • Reference against proprietary databases
  • Corroboration with industry experts

REPORT WRITING

Qualitative

  • Market drivers
  • Market challenges
  • Market trends
  • Five forces analysis

Quantitative

  • Market size and forecast
  • Market segmentation
  • Geographical insights
  • Competitive landscape

Interested in this report?

Get your sample now to see our research methodology and insights!

Download Now

Frequently Asked Questions

Anesthesia Drugs market growth will increase by USD 1651.9 million during 2026-2030.

The Anesthesia Drugs market is expected to grow at a CAGR of 4.6% during 2026-2030.

Anesthesia Drugs market is segmented by Type (General anesthesia, Local and regional anesthesia) Route of administration (Intravenous, Inhalational, Others) Application (General surgery, Cosmetic and reconstructive surgery, Others)

Abbott Laboratories, AbbVie Inc., Aspen Pharmacare Ltd., B.Braun SE, Baxter International Inc., Dr. Reddys Laboratories Ltd., Eisai Co. Ltd., Fresenius Kabi AG, GE HealthCare Technologies, Heron Therapeutics Inc., Hikma Pharmaceuticals Plc, Johnson and Johnson, Merck and Co. Inc., Par Health, Pfizer Inc., Piramal Critical Care, Sanofi SA, Takeda Pharmaceutical Ltd., Teva Pharmaceutical Ltd., Viatris Inc. are a few of the key vendors in the Anesthesia Drugs market.

Asia will register the highest growth rate of 30.7% among the other regions. Therefore, the Anesthesia Drugs market in Asia is expected to garner significant business opportunities for the vendors during the forecast period.

US, Canada, Mexico, Germany, UK, France, Italy, Spain, The Netherlands, China, Japan, India, South Korea, Indonesia, Thailand, Brazil, Saudi Arabia, Turkey, UAE, Argentina, South Africa, Colombia, Israel

  • Increasing volume of surgical procedures worldwide is the driving factor this market.

The Anesthesia Drugs market vendors should focus on grabbing business opportunities from the Type segment as it accounted for the largest market share in the base year.
RIA - Research AI Assistant
Ask RIA
