
Anterior Uveitis Treatment Market Size 2024-2028
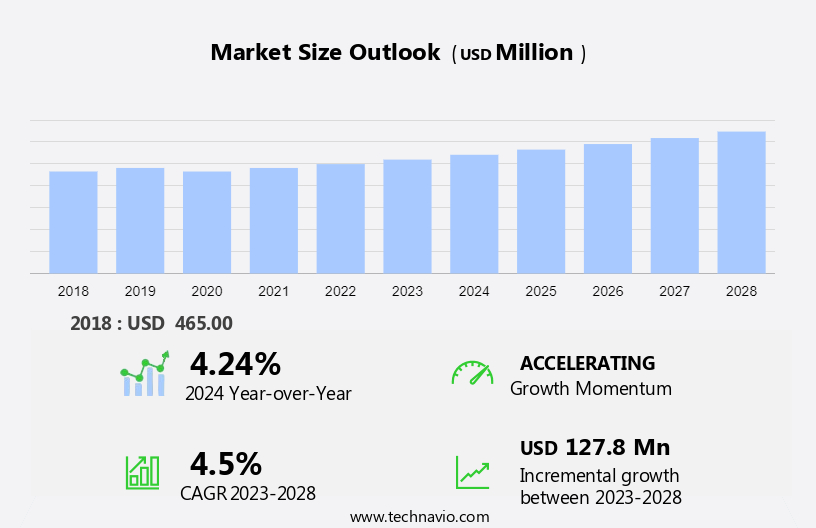
The anterior uveitis treatment market size is forecast to increase by USD 127.8 million at a CAGR of 4.5% between 2023 and 2028.
- Anterior uveitis, an inflammatory condition affecting the front part of the eye, is a significant ophthalmic concern worldwide. Diseases like ankylosing spondylitis, rheumatoid arthritis, inflammatory bowel disease, and lupus can trigger uveitis. Antibiotics, antivirals, antifungals, analgesics, monoclonal antibodies, biologics, and ocular implants are also utilized in specific cases. The market for its treatment is witnessing notable growth due to several key factors. The increasing healthcare spending globally is a major driver, as more resources are being allocated towards the diagnosis and treatment of various eye disorders. Moreover, the geriatric population is expanding, making the elderly more susceptible to uveitis due to age-related health issues. Additionally, the high cost of healthcare, particularly in developed countries, is fueling the demand for cost-effective treatment options. These factors collectively contribute to the growth of the market.
What will be the Size of the Anterior Uveitis Treatment Market During the Forecast Period?
- The market encompasses a range of therapeutic options for addressing inflammation In the anterior chamber of the eye, primarily affecting the uveal layer. Key treatment modalities include corticosteroids, cycloplegic agents, anti-TNF agents, and immunosuppressants. These medications are distributed through various channels, including hospitals, pharmacies (retail and outpatient), and vaccination programs. Anterior uveitis is often associated with noninfectious uveitis, autoimmune disorders, and inflammatory illnesses such as ankylosing spondylitis.
- Treatment goals are centered around reducing inflammation, preventing blindness and vision loss, and managing associated pain. Healthcare reimbursements significantly impact market dynamics, with ongoing efforts to optimize cost-effective treatments for various patient populations. The market is expected to grow, driven by the increasing prevalence of autoimmune diseases, rheumatoid arthritis, and sensitivity to conventional therapies.
How is this Anterior Uveitis Treatment Industry segmented and which is the largest segment?
The anterior uveitis treatment industry research report provides comprehensive data (region-wise segment analysis), with forecasts and estimates in "USD million" for the period 2024-2028, as well as historical data from 2018-2022 for the following segments.
- Type
- Medications
- Surgery
- Geography
- North America
- Canada
- US
- Asia
- China
- India
- Europe
- Germany
- Rest of World (ROW)
- North America
By Type Insights
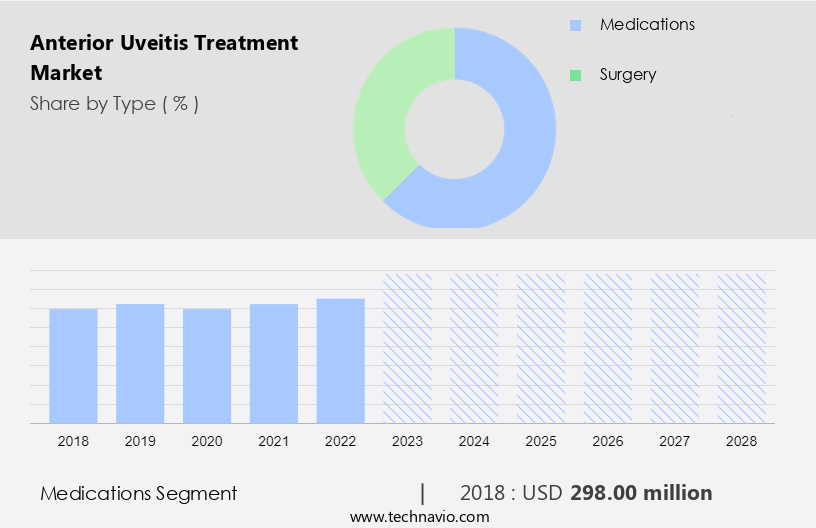
- The medications segment is estimated to witness significant growth during the forecast period.
Anterior uveitis, an inflammatory condition affecting the uveal layer of the eye, requires careful diagnosis and appropriate treatment to prevent vision loss and blindness. Optometrists determine the treatment based on disease severity and causation. Corticosteroids, available as drugs, eye drops, injections, tablets, or capsules, are commonly prescribed. Topical corticosteroids like prednisolone acetate, dexamethasone sodium phosphate, and betamethasone are frequently used. Cycloplegic agents, immunosuppressants, and biologics may also be employed for noninfectious uveitis. Hospitals, pharmacies (retail and online), and healthcare reimbursements play significant roles In the treatment process.
Immunosuppressive treatments, antibiotics, antivirals, antifungals, analgesics, and anti-inflammatory drugs may be used as needed. The geriatric population is particularly susceptible to uveitis, which can present with symptoms like redness of the eyes, blurring of vision, and sensitivity to light. Disease screening services are crucial for early detection and effective intervention. Intraocular pressure issues, cataract, sarcoidosis, glaucoma, and cystoid macular edema are potential complications.
Get a glance at the market report of share of various segments Request Free Sample
The medications segment was valued at USD 298.00 million in 2018 and showed a gradual increase during the forecast period.
Regional Analysis
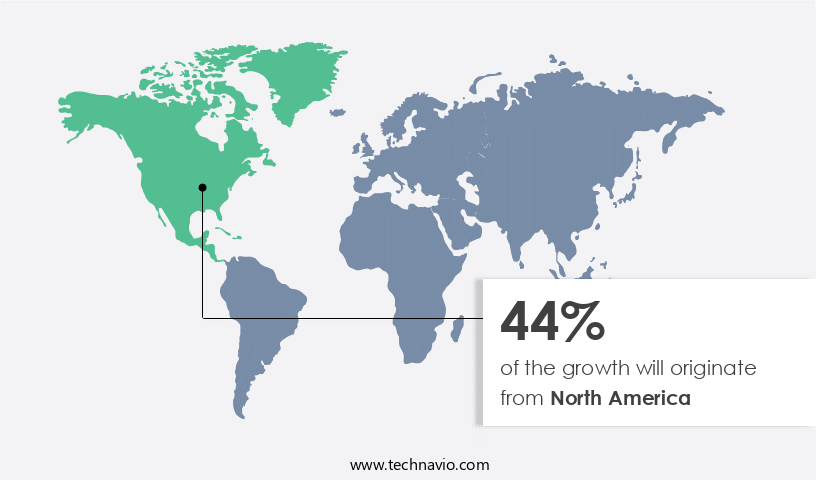
- North America is estimated to contribute 44% to the growth of the global market during the forecast period.
Technavio's analysts have elaborately explained the regional trends and drivers that shape the market during the forecast period.
For more insights on the market size of various regions, Request Free Sample
Anterior uveitis, an inflammatory condition affecting the uveal layer of the eye, is primarily treated with a combination of medications and outpatient care. The most common treatments include corticosteroids for reducing inflammation, cycloplegic agents for relaxing the ciliary muscle, and immunosuppressants for managing autoimmune disorders associated with uveitis. These medications are available through hospitals, pharmacies (retail and online), and healthcare providers. Disease progression and complications, such as blindness and vision loss, necessitate more invasive treatments like biologics, monoclonal antibodies, and ocular implants. Noninfectious uveitis, which is often linked to autoimmune disorders like ankylosing spondylitis, rheumatoid arthritis, inflammatory bowel disease, and lupus, requires long-term immunosuppressive treatments.
Healthcare reimbursements and disease screening services play a crucial role in ensuring access to these treatments. In the US, Humira, a popular immunosuppressive biologic, costs around USD30,000 per year without insurance coverage. The geriatric population, with a higher prevalence of uveitis, poses a significant challenge due to the small size, sensitivity, and potential optical infections of the eye. Intraocular pressure, cataract, sarcoidosis, glaucoma, and cystoid macular edema are common complications that may require additional treatments like antibiotics, antivirals, antifungals, analgesics, and antiinflammatory drugs. The healthcare industry continues to invest in research and development to improve treatment options and outcomes for uveitis patients.
Market Dynamics
Our researchers analyzed the data with 2023 as the base year, along with the key drivers, trends, and challenges. A holistic analysis of drivers will help companies refine their marketing strategies to gain a competitive advantage.
What are the key market drivers leading to the rise In the adoption of Anterior Uveitis Treatment Industry?
The increasing healthcare spending worldwide is the key driver of the market.
- Anterior uveitis, an inflammatory condition affecting the uveal layer of the eye, requires effective treatment to prevent disease progression and potential vision loss. The treatment regimen typically includes corticosteroids for reducing inflammation, cycloplegic agents for relaxing the ciliary muscle, and immunosuppressants for managing autoimmune disorders associated with uveitis. These medications can be administered through hospitals, pharmacies, or outpatient clinics. In developed nations like the US, Germany, France, Sweden, and others, increased healthcare expenditures have enabled the provision of various treatment options for uveitis. The global healthcare spending reached USD 8.3 trillion in 2018, accounting for approximately 10% of the global GDP. In the US, healthcare expenditure amounted to 19.7% of the GDP in 2020. Besides medications, vaccination programs, disease screening services, and various other interventions play a crucial role in managing uveitis and its complications, such as blindness, cataract, glaucoma, cystoid macular edema, and sarcoidosis. Immunosuppressive treatments, including biologics, monoclonal antibodies, and ocular implants, are also employed in severe cases. Immunosuppressive agents, such as Humira, are often used to treat noninfectious uveitis, particularly in patients with autoimmune disorders like ankylosing spondylitis, rheumatoid arthritis, inflammatory bowel disease, and lupus. These conditions are often associated with uveitis.
- Healthcare reimbursements and insurance coverage for uveitis treatments vary across different countries and healthcare systems, including the National Health Service In the UK. Patients may also access medications through retail pharmacies, online pharmacies, or hospital pharmacies. Anti-inflammatory drugs, antibiotics, antivirals, antifungals, analgesics, and other medications may be prescribed to manage symptoms and complications, such as redness of the eyes, blurring of vision, intraocular pressure, and optical infections. The geriatric population is particularly susceptible to uveitis due to age-related factors and underlying health conditions. Thus, the global healthcare infrastructure and the availability of various treatment options, including medications, vaccination programs, and disease screening services, have significantly improved the management of uveitis and its complications. The ongoing research and development efforts In the field of ophthalmology continue to expand the therapeutic options for patients, ensuring better outcomes and improved quality of life.
What are the market trends shaping the Anterior Uveitis Treatment Industry?
The increasing geriatric population is the upcoming market trend.
- Anterior uveitis, an inflammatory condition affecting the uveal layer of the eye, is a significant concern due to its association with various autoimmune disorders and inflammatory illnesses, such as ankylosing spondylitis, rheumatoid arthritis, inflammatory bowel disease, and lupus. The increasing prevalence of these conditions, particularly among the geriatric population, fuels the demand for effective treatments. Corticosteroids, cycloplegic agents, immunosuppressants, and biologics are commonly used for anterior uveitis treatment. These medications help reduce inflammation, prevent disease progression, and alleviate symptoms like redness of eyes and blurring of vision. Hospital pharmacies and retail pharmacies are key distribution channels for these treatments.
- Immunosuppressive agents, such as Humira, are increasingly being used for severe cases of noninfectious uveitis. Vaccination programs and disease screening services are essential for early detection and prevention of vision loss. In addition, healthcare reimbursements play a crucial role In the affordability and accessibility of these treatments. Anti-inflammatory drugs, antibiotics, antivirals, antifungals, analgesics, and immunosuppressive agents are some of the essential medications used In the treatment of anterior uveitis. Conditions like sarcoidosis, glaucoma, cystoid macular edema, and cataract may also require additional treatments, such as ocular implants. Intraocular pressure management is essential In the treatment of anterior uveitis, as high pressure can lead to complications like optic nerve damage and blindness. Regular check-ups and monitoring are crucial for effective management of the condition.
What challenges does the Anterior Uveitis Treatment Industry face during its growth?
The high cost of healthcare is a key challenge affecting the industry growth.
- Anterior uveitis, an inflammatory condition affecting the uveal layer of the eye, requires effective treatment to prevent disease progression and potential vision loss. The market for anterior uveitis treatment encompasses various therapeutic options, including corticosteroids, cycloplegic agents, immunosuppressants, and biologics. These treatments are available through hospitals' pharmacies, retail pharmacies, and online pharmacies. Noninfectious uveitis, such as those associated with autoimmune disorders like ankylosing spondylitis, rheumatoid arthritis, inflammatory bowel disease, and lupus, are common indications for these treatments. Outpatient treatment is preferred due to the small size and sensitivity of the eyes. The high cost of healthcare, especially in developed nations, poses a significant challenge to the market. For instance, in the US, the per capita healthcare expenditure was USD 10,948 in 2019. Immunosuppressive treatments, including immunosuppressive agents like Humira, can be costly. Additionally, the use of antibiotics, antivirals, antifungals, analgesics, and other medications for associated complications adds to the overall cost. Disease screening services and vaccination programs can help prevent and manage anterior uveitis.
- However, the high cost of these services and medications can limit their accessibility, especially for the geriatric population. Redness of the eyes, blurring of vision, and other symptoms can significantly impact quality of life. Intraocular pressure issues, such as glaucoma, cystoid macular edema, and cataract, can also complicate treatment. Sarcoidosis, another condition associated with anterior uveitis, requires careful monitoring and management. Thus, the market faces challenges due to the high cost of healthcare and associated treatments. Effective disease management and prevention strategies, such as vaccination programs and disease screening services, are essential to mitigate the impact of anterior uveitis on vision and quality of life. Collaborative efforts between healthcare providers, pharmacies, and insurers can help make these treatments more accessible and affordable for patients.
Exclusive Customer Landscape
The anterior uveitis treatment market forecasting report includes the adoption lifecycle of the market, market growth and forecasting, covering from the innovator's stage to the laggard's stage. It focuses on adoption rates in different regions based on penetration. Furthermore, the anterior uveitis treatment market report also includes key purchase criteria and drivers of price sensitivity to help companies evaluate and develop their market growth analysis strategies.
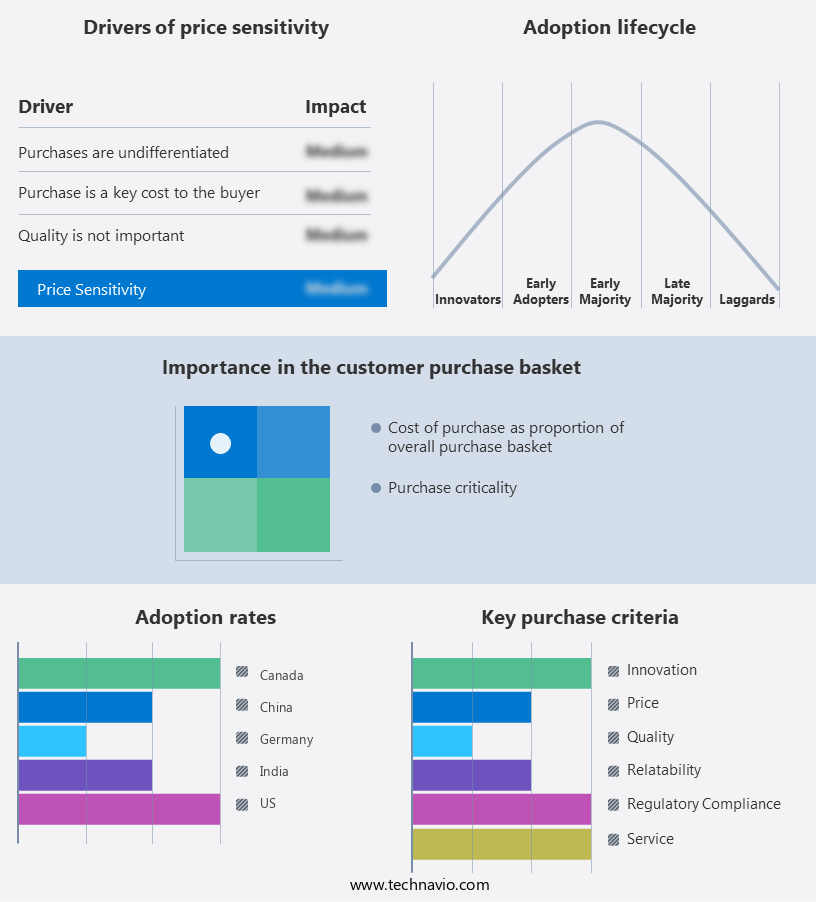
Customer Landscape
Key Companies & Market Insights
Companies are implementing various strategies, such as strategic alliances, anterior uveitis treatment market forecast, partnerships, mergers and acquisitions, geographical expansion, and product/service launches, to enhance their presence In the industry.
The industry research and growth report includes detailed analyses of the competitive landscape of the market and information about key companies, including:
- AbbVie Inc.
- Aldeyra Therapeutics Inc
- Alimera Sciences Inc.
- Allergan
- American Academy of Ophthalmology
- Bausch Lomb Corp.
- Cadila Pharmaceuticals Ltd.
- Enzo Biochem Inc.
- EyePoint Pharmaceuticals Inc
- Kiora Pharmaceuticals, Inc.
- L V PRASAD EYE INSTITUTE
- Melinta Therapeutics LLC
- Novartis AG
- Pfizer Inc.
- Prometheus Laboratories
- Regeneron Pharmaceuticals Inc.
- Santen Pharmaceutical Co. Ltd.
- Viatris Inc.
Qualitative and quantitative analysis of companies has been conducted to help clients understand the wider business environment as well as the strengths and weaknesses of key industry players. Data is qualitatively analyzed to categorize companies as pure play, category-focused, industry-focused, and diversified; it is quantitatively analyzed to categorize companies as dominant, leading, strong, tentative, and weak.
Research Analyst Overview
Anterior uveitis, an inflammatory condition affecting the uveal layer of the eye, can lead to vision loss and blindness if left untreated. This noninfectious inflammation of the uvea, the middle layer of the eye, can be caused by various autoimmune disorders and inflammatory illnesses such as ankylosing spondylitis, rheumatoid arthritis, inflammatory bowel disease, lupus, and sarcoidosis. The treatment market for anterior uveitis is diverse and multifaceted, encompassing various therapeutic modalities. Corticosteroids, cycloplegic agents, and immunosuppressants are commonly used to reduce inflammation and prevent disease progression. These medications can be administered in hospitals or through retail and online pharmacies. Corticosteroids, which are anti-inflammatory drugs, can be given in various forms, including topical, oral, or intravenous administration. They work by suppressing the immune system's response, thereby reducing inflammation. Cycloplegic agents, another type of medication, are used to paralyze the ciliary muscle of the eye, preventing spasms and reducing pain and inflammation. Immunosuppressive treatments, such as biologics and monoclonal antibodies, are used in severe cases of anterior uveitis. These agents work by suppressing the immune system's response, reducing inflammation, and preventing the recurrence of the disease. Ocular implants are another therapeutic option for patients with refractory cases of anterior uveitis. Vaccination programs and disease screening services are essential components of the market. These initiatives aim to prevent the onset of the disease by identifying and treating underlying conditions that may contribute to its development.
The healthcare reimbursement landscape plays a significant role In the market. Healthcare providers and payers must navigate complex reimbursement systems to ensure patients receive appropriate care while managing costs. The geriatric population is disproportionately affected by anterior uveitis due to the increased prevalence of autoimmune disorders and inflammatory illnesses in this demographic. As such, there is a growing need for effective and accessible treatments for this population. Despite advancements in anterior uveitis treatment, challenges remain. The small size and sensitivity of the eye make it challenging to administer some medications effectively. Optical infections, intraocular pressure fluctuations, and the risk of cataract development are also significant concerns. Thus, the market is complex and multifaceted, encompassing various therapeutic modalities and healthcare delivery channels. The market is driven by the need to reduce inflammation, prevent disease progression, and mitigate the risks associated with this condition. Ongoing research and innovation are essential to address the challenges faced by patients and healthcare providers in managing anterior uveitis.
|
Market Scope |
|
|
Report Coverage |
Details |
|
Page number |
133 |
|
Base year |
2023 |
|
Historic period |
2018-2022 |
|
Forecast period |
2024-2028 |
|
Growth momentum & CAGR |
Accelerate at a CAGR of 4.5% |
|
Market growth 2024-2028 |
USD 127.8 million |
|
Market structure |
Fragmented |
|
YoY growth 2023-2024(%) |
4.24 |
|
Key countries |
US, Canada, China, India, and Germany |
|
Competitive landscape |
Leading Companies, Market Positioning of Companies, Competitive Strategies, and Industry Risks |
What are the Key Data Covered in this Anterior Uveitis Treatment Market Research and Growth Report?
- CAGR of the Anterior Uveitis Treatment industry during the forecast period
- Detailed information on factors that will drive the growth and forecasting between 2024 and 2028
- Precise estimation of the size of the market and its contribution of the industry in focus to the parent market
- Accurate predictions about upcoming growth and trends and changes in consumer behaviour
- Growth of the market across North America, Asia, Europe, and Rest of World (ROW)
- Thorough analysis of the market's competitive landscape and detailed information about companies
- Comprehensive analysis of factors that will challenge the anterior uveitis treatment market growth of industry companies
We can help! Our analysts can customize this anterior uveitis treatment market research report to meet your requirements.
 RIA -
RIA - 
