Anti-aging Products Market Analysis, Size, and Forecast 2026-2030: North America (US, Canada, and Mexico), Europe (Germany, UK, and France), APAC (China, Japan, and India), South America (Brazil and Argentina), Middle East and Africa (Saudi Arabia, UAE, and South Africa), and Rest of World (ROW)

Anti-aging Products Market Analysis, Size, and Forecast 2026-2030:
North America (US, Canada, and Mexico), Europe (Germany, UK, and France), APAC (China, Japan, and India), South America (Brazil and Argentina), Middle East and Africa (Saudi Arabia, UAE, and South Africa), and Rest of World (ROW)

Published: Apr 2026 309 Pages SKU: IRTNTR43981

Market Overview at a Glance

$25.82 B
Market Opportunity
7.3%
CAGR 2025 - 2030
36.8%
North America Growth
$21.81 B
Facial cream and lotions segment 2024

Anti-aging Products Market Size 2026-2030

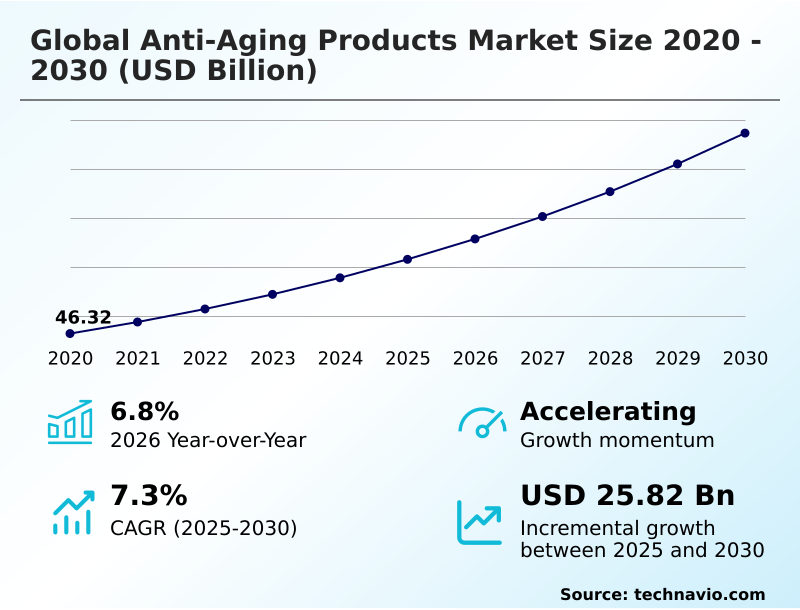
The anti-aging products market size is valued to increase by USD 25.82 billion, at a CAGR of 7.3% from 2025 to 2030. Increasing older population is increasing market demand will drive the anti-aging products market.

Major Market Trends & Insights

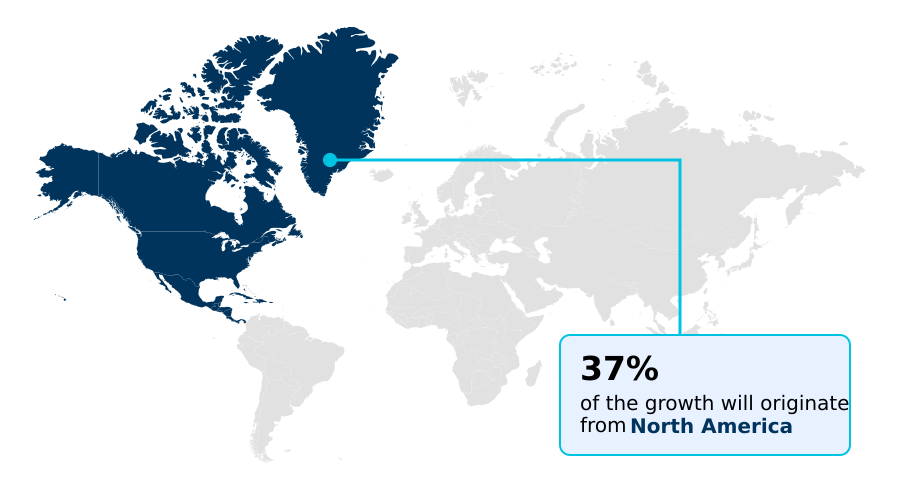
  • North America dominated the market and accounted for a 36.8% growth during the forecast period.
  • By Product Type - Facial cream and lotions segment was valued at USD 21.81 billion in 2024
  • By Distribution Channel - Supermarkets and hypermarkets segment accounted for the largest market revenue share in 2024

Market Size & Forecast

  • Market Opportunities: USD 41.00 billion
  • Market Future Opportunities: USD 25.82 billion
  • CAGR from 2025 to 2030 : 7.3%

Market Summary

  • The anti-aging products market is shaped by a consumer base that is increasingly educated on skincare science and ingredient efficacy. Demand is driven by a focus on maintaining skin health and appearance, with a significant shift toward preventative care among younger demographics. Key formulations leverage active components like peptides and hyaluronic acid to target signs of aging.
  • The market is also seeing a rise in dermo-cosmetics, which blur the line between beauty and pharmaceutical-grade treatments. Innovation is constant, with an emphasis on creating multi-functional products that simplify complex routines. For instance, managing the supply chain for temperature-sensitive bio-identical ingredients presents a significant operational challenge, requiring advanced logistics to ensure product stability and effectiveness from manufacturing to retail.
  • This focus on scientific validation and high-performance ingredients, balanced against challenges of cost and regulatory compliance, defines the competitive landscape. As consumers demand greater transparency, brands are compelled to invest in clinical testing and sustainable sourcing to build trust and market share.

What will be the Size of the Anti-aging Products Market during the forecast period?

Get Key Insights on Market Forecast (PDF) Request Free Sample

How is the Anti-aging Products Market Segmented?

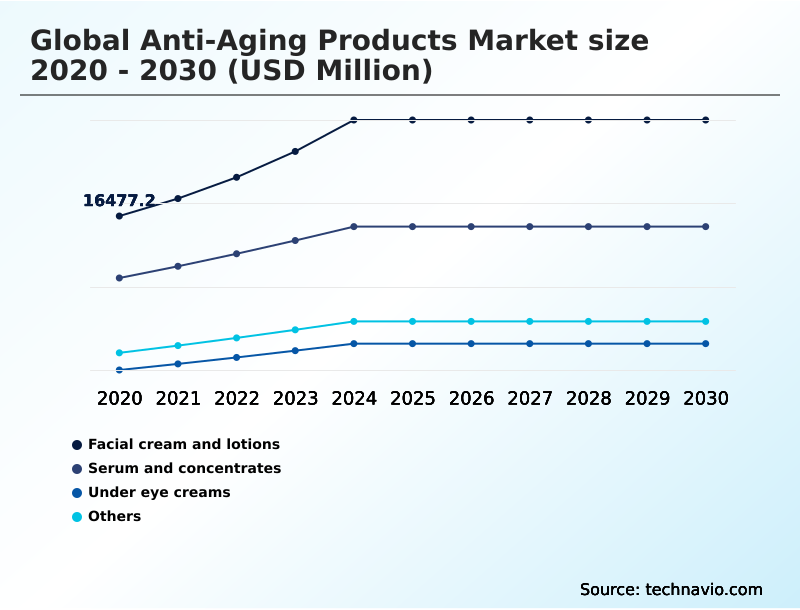
The anti-aging products industry research report provides comprehensive data (region-wise segment analysis), with forecasts and estimates in "USD million" for the period 2026-2030, as well as historical data from 2020-2024 for the following segments.

  • Product type
    • Facial cream and lotions
    • Serum and concentrates
    • Under eye creams
    • Others
  • Distribution channel
    • Supermarkets and hypermarkets
    • Online
    • Pharmacy and drug stores
    • Specialty stores
  • End-user
    • Skin care
    • Hair care
    • Others
  • Geography
    • North America
      • US
      • Canada
      • Mexico
    • Europe
      • Germany
      • UK
      • France
    • APAC
      • China
      • Japan
      • India
    • South America
      • Brazil
      • Argentina
    • Middle East and Africa
      • Saudi Arabia
      • UAE
      • South Africa
    • Rest of World (ROW)

By Product Type Insights

The facial cream and lotions segment is estimated to witness significant growth during the forecast period.

The facial creams and lotions segment is foundational to the market, driven by daily-use preventative measures. These products are evolving beyond simple hydration to include active ingredients and bio-based ingredients that offer targeted benefits.

The emphasis on clean label products and dermo cosmetics is reshaping formulations, with consumers seeking both efficacy and safety. A high-touch shopping experience in specialty stores and robust omnichannel strategies in mass retail support this segment’s growth.

Key innovations include the use of advanced vitamin c and botanical extracts.

Formulations using advanced delivery systems that require rigorous dermatological testing show a 40% improvement in the bioavailability of active ingredients like pro-retinol complex and nad+ boosters, making this a pivotal area for development.

Request Free Sample

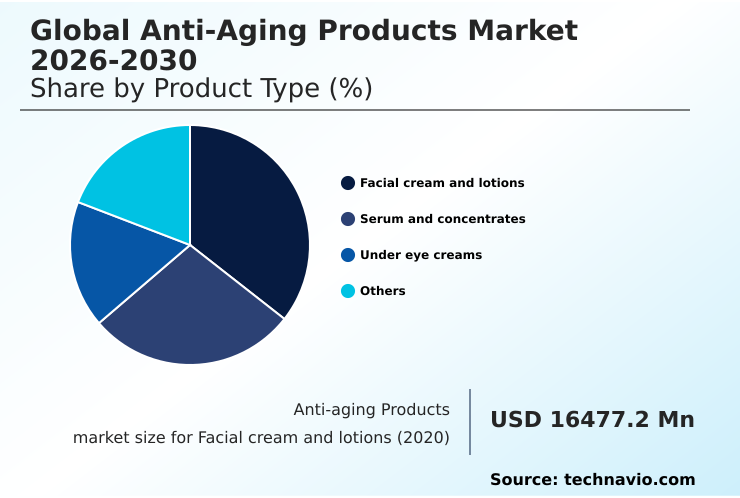
The Facial cream and lotions segment was valued at USD 21.81 billion in 2024 and showed a gradual increase during the forecast period.

Request Free Sample

Regional Analysis

North America is estimated to contribute 36.8% to the growth of the global market during the forecast period.Technavio’s analysts have elaborately explained the regional trends and drivers that shape the market during the forecast period.

See How Anti-aging Products Market Demand is Rising in North America Request Free Sample

The geographic landscape of the market reveals distinct regional priorities and growth trajectories, with North America leading in incremental growth contribution at 36.8%.

In Europe, a strong pro-aging philosophy and stringent regulations promote ingredient transparency and ethical sourcing, driving demand for products with thermal spring water and refillable packaging. The region's market is projected to expand at a CAGR of 7.4%.

APAC is a hub for innovation, with a focus on bio-based materials and upcycled botanical waste, alongside a rising interest in ingestible beauty supplements and halal certified ingredients. This region has also seen the proliferation of automated beauty lounges.

In the Middle East, formulations are adapted for extreme climates, while South America sees growing demand for solutions addressing photoaging.

Market Dynamics

Our researchers analyzed the data with 2025 as the base year, along with the key drivers, trends, and challenges. A holistic analysis of drivers will help companies refine their marketing strategies to gain a competitive advantage.

  • Strategic decision-making in the anti-aging products market is increasingly shaped by nuanced consumer demands reflected in long-tail search queries. Understanding the drivers behind searches for anti-aging products for sensitive skin and retinol alternatives for wrinkle reduction allows firms to refine their R&D focus and mitigate risks associated with ingredient sensitivity.
  • Comparing bakuchiol and retinol efficacy is crucial for marketing and product positioning, especially within the clean beauty anti-aging solutions space. The demand for hyaluronic acid serum for deep hydration and peptides for improving skin elasticity remains a cornerstone of the market, guiding core product development.
  • Moreover, the effectiveness of ingestible beauty products, such as collagen supplements for skin firmness, is expanding the market's boundaries beyond topical applications. This trend, combined with the growth of anti-aging hair care for thinning hair, signals a shift toward holistic wellness.
  • Innovations in formulation, including serums with liposomal delivery systems and products featuring plant stem cell anti-aging benefits, are key differentiators. The future lies in hyper-personalization, with personalized skincare for genetic markers representing a significant growth frontier.
  • Brands offering anti-aging products with sustainable packaging see a consumer preference score that is twice as high as those with conventional packaging, impacting supply chain and brand strategy. Even niche concerns like eye creams for dark circles and puffiness and the role of skin microbiome in aging are becoming central to a comprehensive product portfolio.

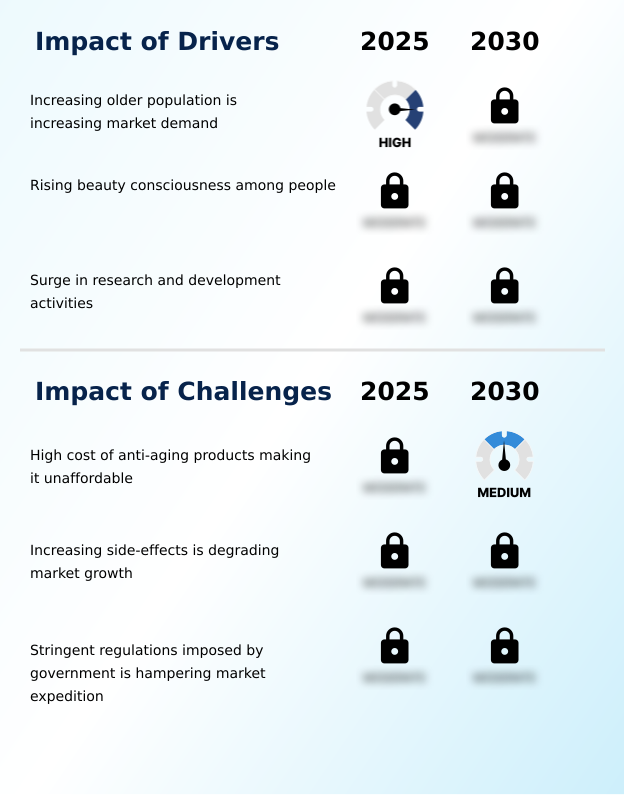
What are the key market drivers leading to the rise in the adoption of Anti-aging Products Industry?

  • The growing global older population is a primary driver increasing the demand for anti-aging products and preventative skincare solutions.

  • Market expansion is significantly propelled by technological integration and a demand for scientifically validated solutions.
  • The rise of social commerce and personalized digital consultations has made advanced products like dermo-cosmetics and formulations with bio-identical ingredients more accessible, with some platforms reporting a 40% increase in conversion rates after implementing a virtual skin diagnostic tool.
  • Innovations in formulation science, including liposomal encapsulation and research into the skin microbiome and plant stem cells, are enabling the creation of potent multi-functional products.
  • The demand for chemical-free products and sustainable packaging is also a major driver, pushing the industry toward more ethical and transparent practices, including the development of epigenetic skin serum. Effective photoprotection remains a cornerstone of preventative care.

What are the market trends shaping the Anti-aging Products Industry?

  • The expansion of online retail channels is a significant market trend. This digital transformation provides consumers with unprecedented access to a global inventory of specialized treatments.

  • Key trends are reshaping consumer expectations and product development, driven by a cultural shift toward skinimalism and the clean beauty movement. This has amplified the demand for targeted, high-efficacy formulations featuring proven ingredients such as peptides and hyaluronic acid to boost collagen production and protect the epidermal barrier.
  • The focus on holistic wellness is expanding the market's scope, creating opportunities in the male grooming sector and fostering a mindset of graceful aging. Preventative skincare routines are now starting at a younger age, with consumers seeking powerful antioxidants to combat cellular senescence.
  • The market shows that brands aligning with these trends see a 25% higher customer engagement rate compared to those with traditional offerings.

What challenges does the Anti-aging Products Industry face during its growth?

  • The high cost of advanced anti-aging products remains a significant challenge, limiting affordability for a substantial portion of the mass-market population.

  • The market faces the complex challenge of balancing the demand for potent clinical-grade actives with consumer concerns about safety and side effects. Ingredients such as alpha hydroxy acids and synthetic growth factors, while effective, require careful formulation to avoid irritation. The high cost of R&D for advanced components like dna repair enzymes, bakuchiol, and sirtuin activators also poses a barrier.
  • Adhering to circular economy principles can increase manufacturing costs by up to 15% initially, impacting final product pricing. Furthermore, the need for dermatologically tested products adds to the financial burden. The proliferation of at-home treatments and smart beauty devices creates a new competitive landscape, while the promise of teledermatology introduces new regulatory hurdles.

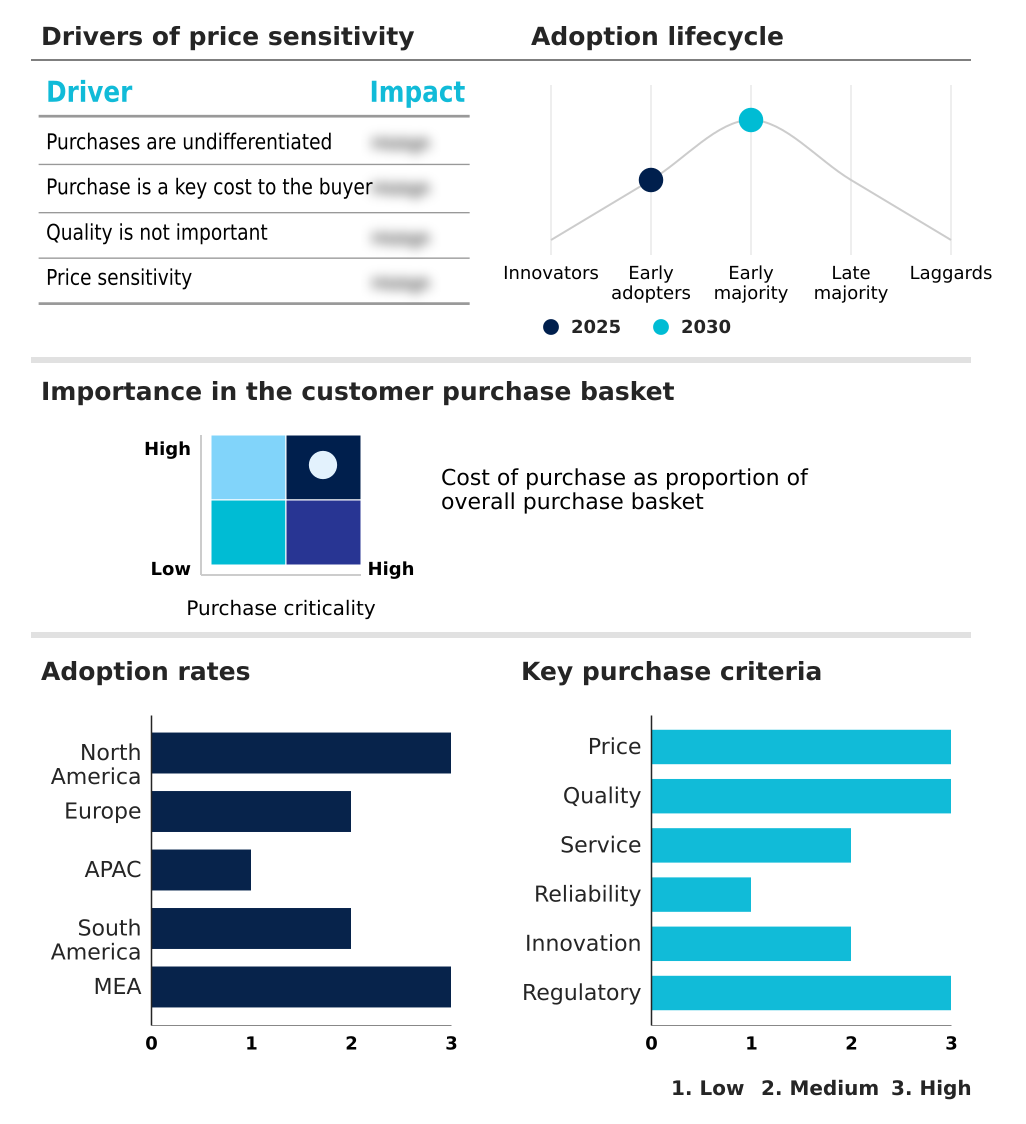
Exclusive Technavio Analysis on Customer Landscape

The anti-aging products market forecasting report includes the adoption lifecycle of the market, covering from the innovator’s stage to the laggard’s stage. It focuses on adoption rates in different regions based on penetration. Furthermore, the anti-aging products market report also includes key purchase criteria and drivers of price sensitivity to help companies evaluate and develop their market growth analysis strategies.

Customer Landscape of Anti-aging Products Industry

Competitive Landscape

Companies are implementing various strategies, such as strategic alliances, anti-aging products market forecast, partnerships, mergers and acquisitions, geographical expansion, and product/service launches, to enhance their presence in the industry.

Allergan Aesthetics - Operations center on the development and commercialization of aesthetic medicine, including facial injectables, body contouring, and advanced skincare solutions.

The industry research and growth report includes detailed analyses of the competitive landscape of the market and information about key companies, including:

  • Allergan Aesthetics
  • Amorepacific Corp.
  • Colgate Palmolive Co.
  • Coty Inc.
  • Galderma Group AG
  • Kao Corp.
  • Kenvue Inc.
  • Loreal SA
  • Mary Kay Inc.
  • Nu Skin Enterprises Inc.
  • Oriflame Cosmetics SA
  • Pierre Fabre SA
  • Procter and Gamble Co.
  • Revlon Inc.
  • RoC Skincare
  • Shiseido Co. Ltd.
  • SISLEY
  • The Avon Co.
  • The Estee Lauder Co. Inc.
  • Unilever PLC

Qualitative and quantitative analysis of companies has been conducted to help clients understand the wider business environment as well as the strengths and weaknesses of key industry players. Data is qualitatively analyzed to categorize companies as pure play, category-focused, industry-focused, and diversified; it is quantitatively analyzed to categorize companies as dominant, leading, strong, tentative, and weak.

Recent Development and News in Anti-aging products market

  • In June 2025, Galderma entered into a major collaboration with a leading genomic research institute to introduce a new line of personalized creams formulated based on individual skin DNA markers.
  • In August 2025, The Estee Lauder Companies Inc. launched a new all-in-one recovery essence that combines a toner, serum, and barrier repair cream into a single formulation to simplify skincare routines.
  • In September 2025, Loreal SA introduced its first fully circular product line, which is manufactured entirely from upcycled botanical waste and utilizes a closed-loop manufacturing process.
  • In February 2025, Johnson & Johnson updated the safety labeling for its leading retinol-based product portfolio following clinical reports that highlighted an increase in skin barrier disruption among users.

Dive into Technavio’s robust research methodology, blending expert interviews, extensive data synthesis, and validated models for unparalleled Anti-aging Products Market insights. See full methodology.

Market Scope
Page number 309
Base year 2025
Historic period 2020-2024
Forecast period 2026-2030
Growth momentum & CAGR Accelerate at a CAGR of 7.3%
Market growth 2026-2030 USD 25823.0 million
Market structure Fragmented
YoY growth 2025-2026(%) 6.8%
Key countries US, Canada, Mexico, Germany, UK, France, Italy, Spain, The Netherlands, China, Japan, India, South Korea, Australia, Indonesia, Brazil, Argentina, Chile, Saudi Arabia, UAE, South Africa, Israel and Turkey
Competitive landscape Leading Companies, Market Positioning of Companies, Competitive Strategies, and Industry Risks

Request Free Sample

Research Analyst Overview

  • The anti-aging products market is defined by a relentless pace of scientific innovation that directly impacts corporate strategy and investment. The evolution from basic moisturizers to sophisticated formulations containing bio-identical ingredients, dna repair enzymes, and epigenetic skin serum requires significant capital allocation in R&D and advanced dermatological testing, shaping long-term financial planning at the boardroom level.
  • The push for higher efficacy and safety is driving the adoption of advanced delivery systems and pro-retinol complex. Firms leveraging advanced liposomal encapsulation have reported a reduction in raw material wastage by over 15%, directly impacting cost of goods sold.
  • The market's trajectory is toward hyper-personalized solutions, leveraging nad+ boosters, botanical extracts, vitamin c, and a deeper understanding of the skin microbiome. Formulations with non-invasive treatments for fine lines and bio-based ingredients are becoming standard, pressuring companies to continuously innovate to maintain a competitive edge.

What are the Key Data Covered in this Anti-aging Products Market Research and Growth Report?

  • What is the expected growth of the Anti-aging Products Market between 2026 and 2030?

    • USD 25.82 billion, at a CAGR of 7.3%

  • What segmentation does the market report cover?

    • The report is segmented by Product Type (Facial cream and lotions, Serum and concentrates, Under eye creams, and Others), Distribution Channel (Supermarkets and hypermarkets, Online, Pharmacy and drug stores, and Specialty stores), End-user (Skin care, Hair care, and Others) and Geography (North America, Europe, APAC, South America, Middle East and Africa)

  • Which regions are analyzed in the report?

    • North America, Europe, APAC, South America and Middle East and Africa

  • What are the key growth drivers and market challenges?

    • Increasing older population is increasing market demand, High cost of anti-aging products making it unaffordable

  • Who are the major players in the Anti-aging Products Market?

    • Allergan Aesthetics, Amorepacific Corp., Colgate Palmolive Co., Coty Inc., Galderma Group AG, Kao Corp., Kenvue Inc., Loreal SA, Mary Kay Inc., Nu Skin Enterprises Inc., Oriflame Cosmetics SA, Pierre Fabre SA, Procter and Gamble Co., Revlon Inc., RoC Skincare, Shiseido Co. Ltd., SISLEY, The Avon Co., The Estee Lauder Co. Inc. and Unilever PLC

Market Research Insights

  • The market's momentum is influenced by a convergence of consumer behaviors and technological advancements. The clean beauty movement has increased formulation costs by up to 15% for some brands but has concurrently improved customer retention by over 20% due to heightened consumer trust.
  • The adoption of smart beauty devices for at-home treatments complements the use of clinical-grade actives, bridging the gap between professional services and daily routines. Furthermore, firms with effective omnichannel strategies report a customer lifetime value that is 30% higher than that of single-channel retailers, underscoring the importance of a seamless high-touch shopping experience both online and in-store.
  • This dynamic pushes companies to innovate continually in product development and distribution.

We can help! Our analysts can customize this anti-aging products market research report to meet your requirements.

Get in touch

1. Executive Summary

1.1 Market overview

Executive Summary - Chart on Market Overview
Executive Summary - Data Table on Market Overview
Executive Summary - Chart on Global Market Characteristics
Executive Summary - Chart on Market by Geography
Executive Summary - Chart on Market Segmentation by Product Type
Executive Summary - Chart on Market Segmentation by Distribution Channel
Executive Summary - Chart on Market Segmentation by End-user
Executive Summary - Chart on Incremental Growth
Executive Summary - Data Table on Incremental Growth
Executive Summary - Chart on Company Market Positioning

2. Technavio Analysis

2.1 Analysis of price sensitivity, lifecycle, customer purchase basket, adoption rates, and purchase criteria

2.2 Criticality of inputs and Factors of differentiation

Chart on Overview on criticality of inputs and factors of differentiation

2.3 Factors of disruption

Chart on Overview on factors of disruption

2.4 Impact of drivers and challenges

Chart on Impact of drivers and challenges in 2025 and 2030

3. Market Landscape

3.1 Market ecosystem

Chart on Parent Market
Data Table on - Parent Market

3.2 Market characteristics

Chart on Market characteristics analysis

3.3 Value chain analysis

Chart on Value chain analysis

4. Market Sizing

4.1 Market definition

Data Table on Offerings of companies included in the market definition

4.2 Market segment analysis

Market segments

4.3 Market size 2025

4.4 Market outlook: Forecast for 2025-2030

Chart on Global - Market size and forecast 2025-2030 ($ million)
Data Table on Global - Market size and forecast 2025-2030 ($ million)
Chart on Global Market: Year-over-year growth 2025-2030 (%)
Data Table on Global Market: Year-over-year growth 2025-2030 (%)

5. Historic Market Size

5.1 Global Anti-Aging Products Market 2020 - 2024

Historic Market Size - Data Table on Global Anti-Aging Products Market 2020 - 2024 ($ million)

5.2 Product Type segment analysis 2020 - 2024

Historic Market Size - Product Type Segment 2020 - 2024 ($ million)

5.3 Distribution Channel segment analysis 2020 - 2024

Historic Market Size - Distribution Channel Segment 2020 - 2024 ($ million)

5.4 End-user segment analysis 2020 - 2024

Historic Market Size - End-user Segment 2020 - 2024 ($ million)

5.5 Geography segment analysis 2020 - 2024

Historic Market Size - Geography Segment 2020 - 2024 ($ million)

5.6 Country segment analysis 2020 - 2024

Historic Market Size - Country Segment 2020 - 2024 ($ million)

6. Qualitative Analysis

6.1 Impact of AI on Global Anti-Aging Products Market

6.2 Impact of Geopolitical Conflicts on Global Anti-Aging Products Market

7. Five Forces Analysis

7.1 Five forces summary

Five forces analysis - Comparison between 2025 and 2030

7.2 Bargaining power of buyers

Bargaining power of buyers - Impact of key factors 2025 and 2030

7.3 Bargaining power of suppliers

Bargaining power of suppliers - Impact of key factors in 2025 and 2030

7.4 Threat of new entrants

Threat of new entrants - Impact of key factors in 2025 and 2030

7.5 Threat of substitutes

Threat of substitutes - Impact of key factors in 2025 and 2030

7.6 Threat of rivalry

Threat of rivalry - Impact of key factors in 2025 and 2030

7.7 Market condition

Chart on Market condition - Five forces 2025 and 2030

8. Market Segmentation by Product Type

8.1 Market segments

Chart on Product Type - Market share 2025-2030 (%)
Data Table on Product Type - Market share 2025-2030 (%)

8.2 Comparison by Product Type

Chart on Comparison by Product Type
Data Table on Comparison by Product Type

8.3 Facial cream and lotions - Market size and forecast 2025-2030

Chart on Facial cream and lotions - Market size and forecast 2025-2030 ($ million)
Data Table on Facial cream and lotions - Market size and forecast 2025-2030 ($ million)
Chart on Facial cream and lotions - Year-over-year growth 2025-2030 (%)
Data Table on Facial cream and lotions - Year-over-year growth 2025-2030 (%)

8.4 Serum and concentrates - Market size and forecast 2025-2030

Chart on Serum and concentrates - Market size and forecast 2025-2030 ($ million)
Data Table on Serum and concentrates - Market size and forecast 2025-2030 ($ million)
Chart on Serum and concentrates - Year-over-year growth 2025-2030 (%)
Data Table on Serum and concentrates - Year-over-year growth 2025-2030 (%)

8.5 Under eye creams - Market size and forecast 2025-2030

Chart on Under eye creams - Market size and forecast 2025-2030 ($ million)
Data Table on Under eye creams - Market size and forecast 2025-2030 ($ million)
Chart on Under eye creams - Year-over-year growth 2025-2030 (%)
Data Table on Under eye creams - Year-over-year growth 2025-2030 (%)

8.6 Others - Market size and forecast 2025-2030

Chart on Others - Market size and forecast 2025-2030 ($ million)
Data Table on Others - Market size and forecast 2025-2030 ($ million)
Chart on Others - Year-over-year growth 2025-2030 (%)
Data Table on Others - Year-over-year growth 2025-2030 (%)

8.7 Market opportunity by Product Type

Market opportunity by Product Type ($ million)
Data Table on Market opportunity by Product Type ($ million)

9. Market Segmentation by Distribution Channel

9.1 Market segments

Chart on Distribution Channel - Market share 2025-2030 (%)
Data Table on Distribution Channel - Market share 2025-2030 (%)

9.2 Comparison by Distribution Channel

Chart on Comparison by Distribution Channel
Data Table on Comparison by Distribution Channel

9.3 Supermarkets and hypermarkets - Market size and forecast 2025-2030

Chart on Supermarkets and hypermarkets - Market size and forecast 2025-2030 ($ million)
Data Table on Supermarkets and hypermarkets - Market size and forecast 2025-2030 ($ million)
Chart on Supermarkets and hypermarkets - Year-over-year growth 2025-2030 (%)
Data Table on Supermarkets and hypermarkets - Year-over-year growth 2025-2030 (%)

9.4 Online - Market size and forecast 2025-2030

Chart on Online - Market size and forecast 2025-2030 ($ million)
Data Table on Online - Market size and forecast 2025-2030 ($ million)
Chart on Online - Year-over-year growth 2025-2030 (%)
Data Table on Online - Year-over-year growth 2025-2030 (%)

9.5 Pharmacy and drug stores - Market size and forecast 2025-2030

Chart on Pharmacy and drug stores - Market size and forecast 2025-2030 ($ million)
Data Table on Pharmacy and drug stores - Market size and forecast 2025-2030 ($ million)
Chart on Pharmacy and drug stores - Year-over-year growth 2025-2030 (%)
Data Table on Pharmacy and drug stores - Year-over-year growth 2025-2030 (%)

9.6 Specialty stores - Market size and forecast 2025-2030

Chart on Specialty stores - Market size and forecast 2025-2030 ($ million)
Data Table on Specialty stores - Market size and forecast 2025-2030 ($ million)
Chart on Specialty stores - Year-over-year growth 2025-2030 (%)
Data Table on Specialty stores - Year-over-year growth 2025-2030 (%)

9.7 Market opportunity by Distribution Channel

Market opportunity by Distribution Channel ($ million)
Data Table on Market opportunity by Distribution Channel ($ million)

10. Market Segmentation by End-user

10.1 Market segments

Chart on End-user - Market share 2025-2030 (%)
Data Table on End-user - Market share 2025-2030 (%)

10.2 Comparison by End-user

Chart on Comparison by End-user
Data Table on Comparison by End-user

10.3 Skin care - Market size and forecast 2025-2030

Chart on Skin care - Market size and forecast 2025-2030 ($ million)
Data Table on Skin care - Market size and forecast 2025-2030 ($ million)
Chart on Skin care - Year-over-year growth 2025-2030 (%)
Data Table on Skin care - Year-over-year growth 2025-2030 (%)

10.4 Hair care - Market size and forecast 2025-2030

Chart on Hair care - Market size and forecast 2025-2030 ($ million)
Data Table on Hair care - Market size and forecast 2025-2030 ($ million)
Chart on Hair care - Year-over-year growth 2025-2030 (%)
Data Table on Hair care - Year-over-year growth 2025-2030 (%)

10.5 Others - Market size and forecast 2025-2030

Chart on Others - Market size and forecast 2025-2030 ($ million)
Data Table on Others - Market size and forecast 2025-2030 ($ million)
Chart on Others - Year-over-year growth 2025-2030 (%)
Data Table on Others - Year-over-year growth 2025-2030 (%)

10.6 Market opportunity by End-user

Market opportunity by End-user ($ million)
Data Table on Market opportunity by End-user ($ million)

11. Customer Landscape

11.1 Customer landscape overview

Analysis of price sensitivity, lifecycle, customer purchase basket, adoption rates, and purchase criteria

12. Geographic Landscape

12.1 Geographic segmentation

Chart on Market share by geography 2025-2030 (%)
Data Table on Market share by geography 2025-2030 (%)

12.2 Geographic comparison

Chart on Geographic comparison
Data Table on Geographic comparison

12.3 North America - Market size and forecast 2025-2030

Chart on North America - Market size and forecast 2025-2030 ($ million)
Data Table on North America - Market size and forecast 2025-2030 ($ million)
Chart on North America - Year-over-year growth 2025-2030 (%)
Data Table on North America - Year-over-year growth 2025-2030 (%)
Chart on Regional Comparison - North America
Data Table on Regional Comparison - North America

12.3.1 US - Market size and forecast 2025-2030

Chart on US - Market size and forecast 2025-2030 ($ million)
Data Table on US - Market size and forecast 2025-2030 ($ million)
Chart on US - Year-over-year growth 2025-2030 (%)
Data Table on US - Year-over-year growth 2025-2030 (%)

12.3.2 Canada - Market size and forecast 2025-2030

Chart on Canada - Market size and forecast 2025-2030 ($ million)
Data Table on Canada - Market size and forecast 2025-2030 ($ million)
Chart on Canada - Year-over-year growth 2025-2030 (%)
Data Table on Canada - Year-over-year growth 2025-2030 (%)

12.3.3 Mexico - Market size and forecast 2025-2030

Chart on Mexico - Market size and forecast 2025-2030 ($ million)
Data Table on Mexico - Market size and forecast 2025-2030 ($ million)
Chart on Mexico - Year-over-year growth 2025-2030 (%)
Data Table on Mexico - Year-over-year growth 2025-2030 (%)

12.4 Europe - Market size and forecast 2025-2030

Chart on Europe - Market size and forecast 2025-2030 ($ million)
Data Table on Europe - Market size and forecast 2025-2030 ($ million)
Chart on Europe - Year-over-year growth 2025-2030 (%)
Data Table on Europe - Year-over-year growth 2025-2030 (%)
Chart on Regional Comparison - Europe
Data Table on Regional Comparison - Europe

12.4.1 Germany - Market size and forecast 2025-2030

Chart on Germany - Market size and forecast 2025-2030 ($ million)
Data Table on Germany - Market size and forecast 2025-2030 ($ million)
Chart on Germany - Year-over-year growth 2025-2030 (%)
Data Table on Germany - Year-over-year growth 2025-2030 (%)

12.4.2 UK - Market size and forecast 2025-2030

Chart on UK - Market size and forecast 2025-2030 ($ million)
Data Table on UK - Market size and forecast 2025-2030 ($ million)
Chart on UK - Year-over-year growth 2025-2030 (%)
Data Table on UK - Year-over-year growth 2025-2030 (%)

12.4.3 France - Market size and forecast 2025-2030

Chart on France - Market size and forecast 2025-2030 ($ million)
Data Table on France - Market size and forecast 2025-2030 ($ million)
Chart on France - Year-over-year growth 2025-2030 (%)
Data Table on France - Year-over-year growth 2025-2030 (%)

12.4.4 Italy - Market size and forecast 2025-2030

Chart on Italy - Market size and forecast 2025-2030 ($ million)
Data Table on Italy - Market size and forecast 2025-2030 ($ million)
Chart on Italy - Year-over-year growth 2025-2030 (%)
Data Table on Italy - Year-over-year growth 2025-2030 (%)

12.4.5 Spain - Market size and forecast 2025-2030

Chart on Spain - Market size and forecast 2025-2030 ($ million)
Data Table on Spain - Market size and forecast 2025-2030 ($ million)
Chart on Spain - Year-over-year growth 2025-2030 (%)
Data Table on Spain - Year-over-year growth 2025-2030 (%)

12.4.6 The Netherlands - Market size and forecast 2025-2030

Chart on The Netherlands - Market size and forecast 2025-2030 ($ million)
Data Table on The Netherlands - Market size and forecast 2025-2030 ($ million)
Chart on The Netherlands - Year-over-year growth 2025-2030 (%)
Data Table on The Netherlands - Year-over-year growth 2025-2030 (%)

12.5 APAC - Market size and forecast 2025-2030

Chart on APAC - Market size and forecast 2025-2030 ($ million)
Data Table on APAC - Market size and forecast 2025-2030 ($ million)
Chart on APAC - Year-over-year growth 2025-2030 (%)
Data Table on APAC - Year-over-year growth 2025-2030 (%)
Chart on Regional Comparison - APAC
Data Table on Regional Comparison - APAC

12.5.1 China - Market size and forecast 2025-2030

Chart on China - Market size and forecast 2025-2030 ($ million)
Data Table on China - Market size and forecast 2025-2030 ($ million)
Chart on China - Year-over-year growth 2025-2030 (%)
Data Table on China - Year-over-year growth 2025-2030 (%)

12.5.2 Japan - Market size and forecast 2025-2030

Chart on Japan - Market size and forecast 2025-2030 ($ million)
Data Table on Japan - Market size and forecast 2025-2030 ($ million)
Chart on Japan - Year-over-year growth 2025-2030 (%)
Data Table on Japan - Year-over-year growth 2025-2030 (%)

12.5.3 India - Market size and forecast 2025-2030

Chart on India - Market size and forecast 2025-2030 ($ million)
Data Table on India - Market size and forecast 2025-2030 ($ million)
Chart on India - Year-over-year growth 2025-2030 (%)
Data Table on India - Year-over-year growth 2025-2030 (%)

12.5.4 South Korea - Market size and forecast 2025-2030

Chart on South Korea - Market size and forecast 2025-2030 ($ million)
Data Table on South Korea - Market size and forecast 2025-2030 ($ million)
Chart on South Korea - Year-over-year growth 2025-2030 (%)
Data Table on South Korea - Year-over-year growth 2025-2030 (%)

12.5.5 Australia - Market size and forecast 2025-2030

Chart on Australia - Market size and forecast 2025-2030 ($ million)
Data Table on Australia - Market size and forecast 2025-2030 ($ million)
Chart on Australia - Year-over-year growth 2025-2030 (%)
Data Table on Australia - Year-over-year growth 2025-2030 (%)

12.5.6 Indonesia - Market size and forecast 2025-2030

Chart on Indonesia - Market size and forecast 2025-2030 ($ million)
Data Table on Indonesia - Market size and forecast 2025-2030 ($ million)
Chart on Indonesia - Year-over-year growth 2025-2030 (%)
Data Table on Indonesia - Year-over-year growth 2025-2030 (%)

12.6 South America - Market size and forecast 2025-2030

Chart on South America - Market size and forecast 2025-2030 ($ million)
Data Table on South America - Market size and forecast 2025-2030 ($ million)
Chart on South America - Year-over-year growth 2025-2030 (%)
Data Table on South America - Year-over-year growth 2025-2030 (%)
Chart on Regional Comparison - South America
Data Table on Regional Comparison - South America

12.6.1 Brazil - Market size and forecast 2025-2030

Chart on Brazil - Market size and forecast 2025-2030 ($ million)
Data Table on Brazil - Market size and forecast 2025-2030 ($ million)
Chart on Brazil - Year-over-year growth 2025-2030 (%)
Data Table on Brazil - Year-over-year growth 2025-2030 (%)

12.6.2 Argentina - Market size and forecast 2025-2030

Chart on Argentina - Market size and forecast 2025-2030 ($ million)
Data Table on Argentina - Market size and forecast 2025-2030 ($ million)
Chart on Argentina - Year-over-year growth 2025-2030 (%)
Data Table on Argentina - Year-over-year growth 2025-2030 (%)

12.6.3 Chile - Market size and forecast 2025-2030

Chart on Chile - Market size and forecast 2025-2030 ($ million)
Data Table on Chile - Market size and forecast 2025-2030 ($ million)
Chart on Chile - Year-over-year growth 2025-2030 (%)
Data Table on Chile - Year-over-year growth 2025-2030 (%)

12.7 Middle East and Africa - Market size and forecast 2025-2030

Chart on Middle East and Africa - Market size and forecast 2025-2030 ($ million)
Data Table on Middle East and Africa - Market size and forecast 2025-2030 ($ million)
Chart on Middle East and Africa - Year-over-year growth 2025-2030 (%)
Data Table on Middle East and Africa - Year-over-year growth 2025-2030 (%)
Chart on Regional Comparison - Middle East and Africa
Data Table on Regional Comparison - Middle East and Africa

12.7.1 Saudi Arabia - Market size and forecast 2025-2030

Chart on Saudi Arabia - Market size and forecast 2025-2030 ($ million)
Data Table on Saudi Arabia - Market size and forecast 2025-2030 ($ million)
Chart on Saudi Arabia - Year-over-year growth 2025-2030 (%)
Data Table on Saudi Arabia - Year-over-year growth 2025-2030 (%)

12.7.2 UAE - Market size and forecast 2025-2030

Chart on UAE - Market size and forecast 2025-2030 ($ million)
Data Table on UAE - Market size and forecast 2025-2030 ($ million)
Chart on UAE - Year-over-year growth 2025-2030 (%)
Data Table on UAE - Year-over-year growth 2025-2030 (%)

12.7.3 South Africa - Market size and forecast 2025-2030

Chart on South Africa - Market size and forecast 2025-2030 ($ million)
Data Table on South Africa - Market size and forecast 2025-2030 ($ million)
Chart on South Africa - Year-over-year growth 2025-2030 (%)
Data Table on South Africa - Year-over-year growth 2025-2030 (%)

12.7.4 Israel - Market size and forecast 2025-2030

Chart on Israel - Market size and forecast 2025-2030 ($ million)
Data Table on Israel - Market size and forecast 2025-2030 ($ million)
Chart on Israel - Year-over-year growth 2025-2030 (%)
Data Table on Israel - Year-over-year growth 2025-2030 (%)

12.7.5 Turkey - Market size and forecast 2025-2030

Chart on Turkey - Market size and forecast 2025-2030 ($ million)
Data Table on Turkey - Market size and forecast 2025-2030 ($ million)
Chart on Turkey - Year-over-year growth 2025-2030 (%)
Data Table on Turkey - Year-over-year growth 2025-2030 (%)

12.8 Market opportunity by geography

Market opportunity by geography ($ million)
Data Tables on Market opportunity by geography ($ million)

13. Drivers, Challenges, and Opportunity

13.1 Market drivers

Increasing older population is increasing market demand
Rising beauty consciousness among people
Surge in research and development activities

13.2 Market challenges

High cost of anti-aging products making it unaffordable
Increasing side-effects is degrading market growth
Stringent regulations imposed by government is hampering market expedition

13.3 Impact of drivers and challenges

Impact of drivers and challenges in 2025 and 2030

13.4 Market opportunities

Online availability of products is fostering market growth
Rise in popularity of multi-functional products
Shift from chemical-based products to chemical-free products

14. Competitive Landscape

14.1 Overview

14.2

Overview on criticality of inputs and factors of differentiation

14.3 Landscape disruption

Overview on factors of disruption

14.4 Industry risks

Impact of key risks on business

15. Competitive Analysis

15.1 Companies profiled

Companies covered

15.2 Company ranking index

15.3 Market positioning of companies

Matrix on companies position and classification

15.4 Allergan Aesthetics

Allergan Aesthetics - Overview
Allergan Aesthetics - Product / Service
Allergan Aesthetics - Key offerings
SWOT

15.5 Amorepacific Corp.

Amorepacific Corp. - Overview
Amorepacific Corp. - Business segments
Amorepacific Corp. - Key offerings
Amorepacific Corp. - Segment focus
SWOT

15.6 Colgate Palmolive Co.

Colgate Palmolive Co. - Overview
Colgate Palmolive Co. - Business segments
Colgate Palmolive Co. - Key offerings
Colgate Palmolive Co. - Segment focus
SWOT

15.7 Coty Inc.

Coty Inc. - Overview
Coty Inc. - Business segments
Coty Inc. - Key news
Coty Inc. - Key offerings
Coty Inc. - Segment focus
SWOT

15.8 Kao Corp.

Kao Corp. - Overview
Kao Corp. - Business segments
Kao Corp. - Key news
Kao Corp. - Key offerings
Kao Corp. - Segment focus
SWOT

15.9 Kenvue Inc.

Kenvue Inc. - Overview
Kenvue Inc. - Business segments
Kenvue Inc. - Key news
Kenvue Inc. - Key offerings
Kenvue Inc. - Segment focus
SWOT

15.10 Loreal SA

Loreal SA - Overview
Loreal SA - Business segments
Loreal SA - Key offerings
Loreal SA - Segment focus
SWOT

15.11 Nu Skin Enterprises Inc.

Nu Skin Enterprises Inc. - Overview
Nu Skin Enterprises Inc. - Business segments
Nu Skin Enterprises Inc. - Key news
Nu Skin Enterprises Inc. - Key offerings
Nu Skin Enterprises Inc. - Segment focus
SWOT

15.12 Pierre Fabre SA

Pierre Fabre SA - Overview
Pierre Fabre SA - Product / Service
Pierre Fabre SA - Key offerings
SWOT

15.13 Procter and Gamble Co.

Procter and Gamble Co. - Overview
Procter and Gamble Co. - Business segments
Procter and Gamble Co. - Key news
Procter and Gamble Co. - Key offerings
Procter and Gamble Co. - Segment focus
SWOT

15.14 Revlon Inc.

Revlon Inc. - Overview
Revlon Inc. - Product / Service
Revlon Inc. - Key offerings
SWOT

15.15 Shiseido Co. Ltd.

Shiseido Co. Ltd. - Overview
Shiseido Co. Ltd. - Business segments
Shiseido Co. Ltd. - Key offerings
Shiseido Co. Ltd. - Segment focus
SWOT

15.16 The Avon Co.

The Avon Co. - Overview
The Avon Co. - Product / Service
The Avon Co. - Key offerings
SWOT

15.17 The Estee Lauder Co. Inc.

The Estee Lauder Co. Inc. - Overview
The Estee Lauder Co. Inc. - Business segments
The Estee Lauder Co. Inc. - Key offerings
The Estee Lauder Co. Inc. - Segment focus
SWOT

15.18 Unilever PLC

Unilever PLC - Overview
Unilever PLC - Business segments
Unilever PLC - Key news
Unilever PLC - Key offerings
Unilever PLC - Segment focus
SWOT

16. Appendix

16.1 Scope of the report

Market definition
Objectives
Notes and caveats

16.2 Inclusions and exclusions checklist

Inclusions checklist
Exclusions checklist

16.3 Currency conversion rates for US$

16.4 Research methodology

16.5 Data procurement

Information sources

16.6 Data validation

16.7 Validation techniques employed for market sizing

16.8 Data synthesis

16.9 360 degree market analysis

16.10 List of abbreviations

Research Methodology

Technavio presents a detailed picture of the market by way of study, synthesis, and summation of data from multiple sources. The analysts have presented the various facets of the market with a particular focus on identifying the key industry influencers. The data thus presented is comprehensive, reliable, and the result of extensive research, both primary and secondary.

INFORMATION SOURCES

Primary sources

  • Manufacturers and suppliers
  • Channel partners
  • Industry experts
  • Strategic decision makers

Secondary sources

  • Industry journals and periodicals
  • Government data
  • Financial reports of key industry players
  • Historical data
  • Press releases

DATA ANALYSIS

Data Synthesis

  • Collation of data
  • Estimation of key figures
  • Analysis of derived insights

Data Validation

  • Triangulation with data models
  • Reference against proprietary databases
  • Corroboration with industry experts

REPORT WRITING

Qualitative

  • Market drivers
  • Market challenges
  • Market trends
  • Five forces analysis

Quantitative

  • Market size and forecast
  • Market segmentation
  • Geographical insights
  • Competitive landscape

Interested in this report?

Get your sample now to see our research methodology and insights!

Download Now

Frequently Asked Questions

Anti-aging Products market growth will increase by USD 25823.0 million during 2026-2030.

The Anti-aging Products market is expected to grow at a CAGR of 7.3% during 2026-2030.

Anti-aging Products market is segmented by Product type (Facial cream and lotions, Serum and concentrates, Under eye creams, Others) Distribution channel (Supermarkets and hypermarkets, Online, Pharmacy and drug stores, Specialty stores) End-user (Skin care, Hair care, Others)

Allergan Aesthetics, Amorepacific Corp., Colgate Palmolive Co., Coty Inc., Galderma Group AG, Kao Corp., Kenvue Inc., Loreal SA, Mary Kay Inc., Nu Skin Enterprises Inc., Oriflame Cosmetics SA, Pierre Fabre SA, Procter and Gamble Co., Revlon Inc., RoC Skincare, Shiseido Co. Ltd., SISLEY, The Avon Co., The Estee Lauder Co. Inc., Unilever PLC are a few of the key vendors in the Anti-aging Products market.

North America will register the highest growth rate of 36.8% among the other regions. Therefore, the Anti-aging Products market in North America is expected to garner significant business opportunities for the vendors during the forecast period.

US, Canada, Mexico, Germany, UK, France, Italy, Spain, The Netherlands, China, Japan, India, South Korea, Australia, Indonesia, Brazil, Argentina, Chile, Saudi Arabia, UAE, South Africa, Israel, Turkey

  • Increasing older population is increasing market demand is the driving factor this market.

The Anti-aging Products market vendors should focus on grabbing business opportunities from the Product type segment as it accounted for the largest market share in the base year.
RIA - Research AI Assistant
Ask RIA