Anti-reflective Coatings Market Analysis, Size, and Forecast 2026-2030: APAC (China, India, and Japan), North America (US, Canada, and Mexico), Europe (Germany, UK, and France), Middle East and Africa (Saudi Arabia, UAE, and South Africa), South America (Brazil and Argentina), and Rest of World (ROW)

Anti-reflective Coatings Market Analysis, Size, and Forecast 2026-2030:
APAC (China, India, and Japan), North America (US, Canada, and Mexico), Europe (Germany, UK, and France), Middle East and Africa (Saudi Arabia, UAE, and South Africa), South America (Brazil and Argentina), and Rest of World (ROW)

Published: Mar 2026 308 Pages SKU: IRTNTR43977

Market Overview at a Glance

$4.23 B
Market Opportunity
11%
CAGR 2025 - 2030
44.7%
APAC Growth
$2.21 B
Eyewear segment 2024

Anti-reflective Coatings Market Size 2026-2030

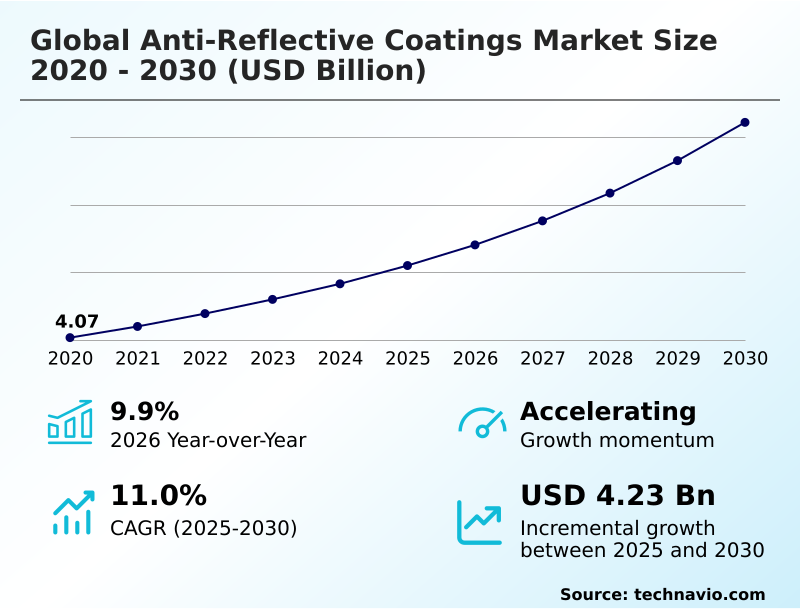
The anti-reflective coatings market size is valued to increase by USD 4.23 billion, at a CAGR of 11% from 2025 to 2030. Growing demand for anti-reflective coatings in solar industry will drive the anti-reflective coatings market.

Major Market Trends & Insights

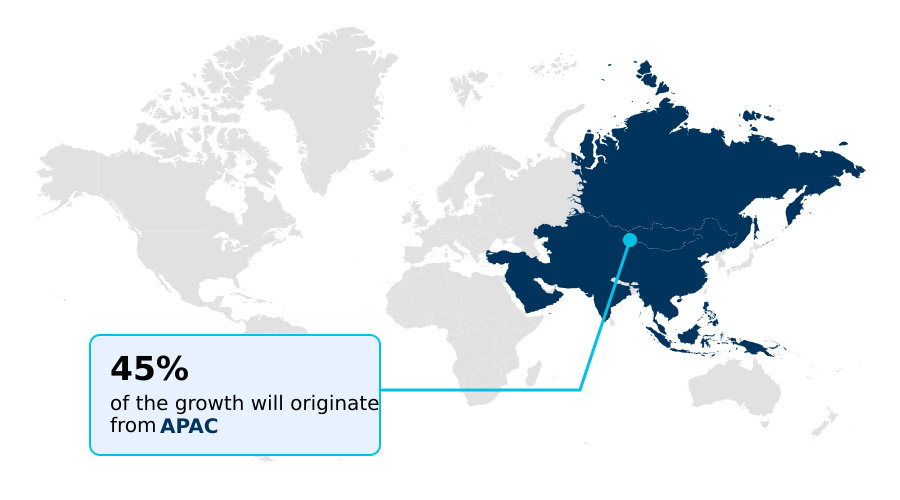
  • APAC dominated the market and accounted for a 44.7% growth during the forecast period.
  • By Application - Eyewear segment was valued at USD 2.21 billion in 2024
  • By Technology - Vacuum deposition segment accounted for the largest market revenue share in 2024

Market Size & Forecast

  • Market Opportunities: USD 6.37 billion
  • Market Future Opportunities: USD 4.23 billion
  • CAGR from 2025 to 2030 : 11%

Market Summary

  • The anti-reflective coatings market is characterized by a dynamic interplay between escalating performance demands and significant manufacturing challenges. Growth is propelled by the consumer electronics sector's need for glare-free, high-clarity displays and the renewable energy sector's push to maximize solar panel efficiency.
  • These demands drive innovation in thin-film optical coating technologies, where multi-layer coatings are engineered to achieve specific refractive index properties for optimal light transmission. However, the industry grapples with the complexity of applying uniform coatings to diverse substrates, particularly plastics. A key operational challenge involves managing the supply chain for critical raw materials like indium tin oxide.
  • For instance, a manufacturer of high-resolution displays must balance the high cost and volatile supply of this material against performance targets, often necessitating strategic investments in alternative material research to protect profit margins and ensure production continuity. This pressure fosters advancements in material science, pushing the development of more sustainable and cost-effective solutions to maintain a competitive edge.

What will be the Size of the Anti-reflective Coatings Market during the forecast period?

Get Key Insights on Market Forecast (PDF) Request Free Sample

How is the Anti-reflective Coatings Market Segmented?

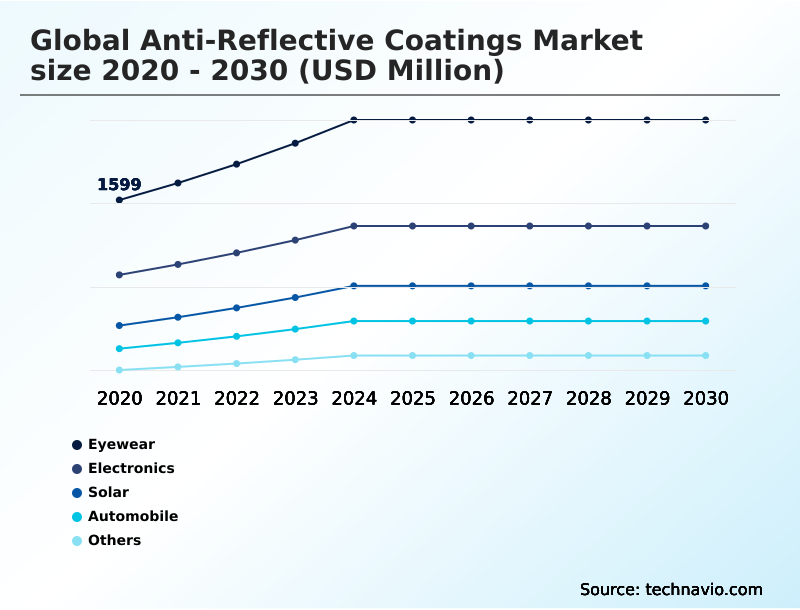
The anti-reflective coatings industry research report provides comprehensive data (region-wise segment analysis), with forecasts and estimates in "USD million" for the period 2026-2030, as well as historical data from 2020-2024 for the following segments.

  • Application
    • Eyewear
    • Electronics
    • Solar
    • Automobile
    • Others
  • Technology
    • Vacuum deposition
    • Electron beam evaporation
    • Sputtering
    • Roll to roll
    • Others
  • Type
    • Multi layered
    • Single layered
  • Geography
    • APAC
      • China
      • India
      • Japan
    • North America
      • US
      • Canada
      • Mexico
    • Europe
      • Germany
      • UK
      • France
    • Middle East and Africa
      • Saudi Arabia
      • UAE
      • South Africa
    • South America
      • Brazil
      • Argentina
    • Rest of World (ROW)

By Application Insights

The eyewear segment is estimated to witness significant growth during the forecast period.

The eyewear segment is evolving beyond simple vision correction, with growing demand for advanced thin-film optical coating solutions that enhance optical clarity and user comfort.

Multi-layer coatings are meticulously engineered to manage the refractive index of lenses, significantly reducing distracting reflections from digital screens and artificial lighting.

This shift is driven by increased screen time, which elevates the need for integrated blue light filtering lenses and specialized night driving lenses. Modern ophthalmic lens coatings also incorporate oleophobic characteristics for easier maintenance.

Premium offerings now combine these features with scratch-resistant coatings, improving lens durability and delivering a measurable 15% improvement in visual acuity during prolonged digital tasks, solidifying their value proposition in a competitive market.

Request Free Sample

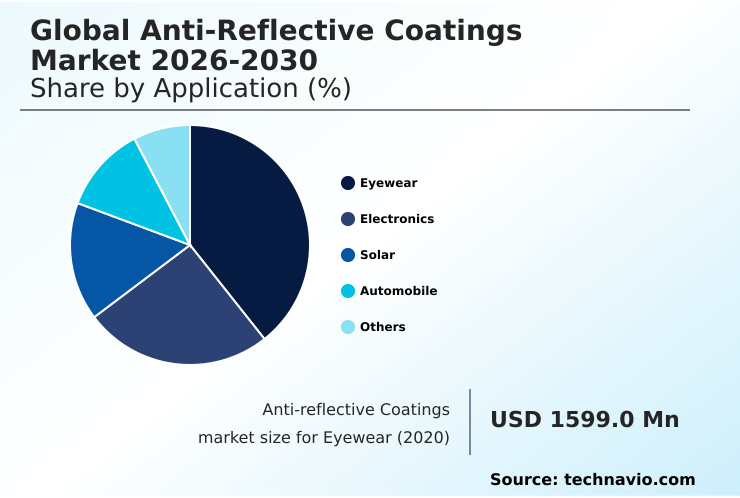
The Eyewear segment was valued at USD 2.21 billion in 2024 and showed a gradual increase during the forecast period.

Request Free Sample

Regional Analysis

APAC is estimated to contribute 44.7% to the growth of the global market during the forecast period.Technavio’s analysts have elaborately explained the regional trends and drivers that shape the market during the forecast period.

See How Anti-reflective Coatings Market Demand is Rising in APAC Request Free Sample

The geographic landscape is dominated by the APAC region, which accounts for over 44% of the market's incremental growth, driven by its massive electronics and solar manufacturing ecosystems.

Regional players leverage high-volume production technologies like vacuum deposition and plasma-enhanced chemical vapor deposition to produce advanced multi-layer coatings.

This region’s market is growing at 11.6%, outpacing Europe’s 10.4% rate, fueled by demand for broadband ar coatings and laser optics ar coatings.

Innovations are also regionally focused; for instance, development in the Middle East centers on coatings with anti-soiling properties, while Asian markets prioritize scratch-resistant coatings for consumer devices.

The strategic deployment of photocatalytic anti-reflective coating technology is reducing surface reflection and improving performance in harsh climates.

Market Dynamics

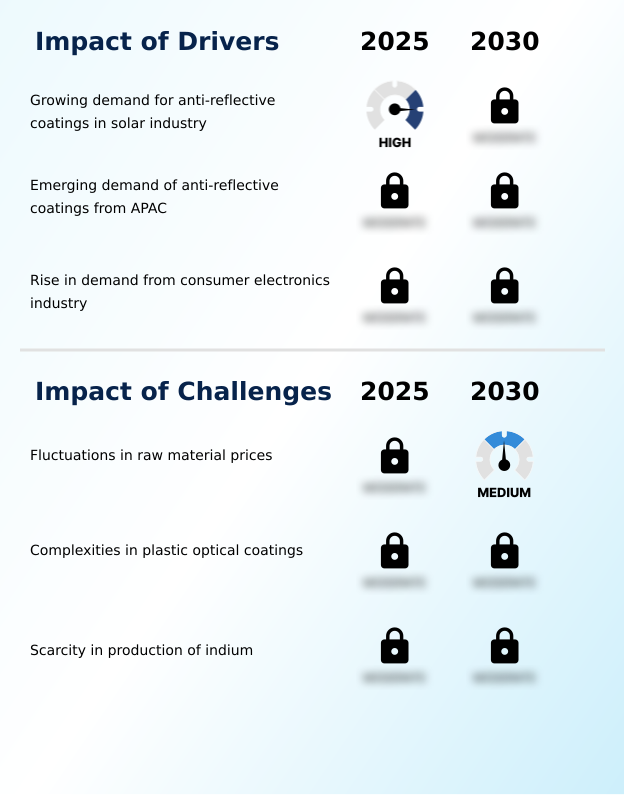
Our researchers analyzed the data with 2025 as the base year, along with the key drivers, trends, and challenges. A holistic analysis of drivers will help companies refine their marketing strategies to gain a competitive advantage.

  • Successfully navigating the anti-reflective coatings market requires addressing complex technical challenges across diverse applications. A primary concern involves developing anti-reflective coatings for plastic substrates, as challenges in coating polycarbonate lenses are significant due to their lower thermal stability compared to glass. This has spurred innovation in sputtering techniques for durable ar coatings suitable for anti-reflective coatings for automotive displays.
  • Simultaneously, the solar industry's focus on ar coating for solar panel efficiency is driving research into enhancing light transmission in solar panels. This contrasts with the consumer electronics industry's goal of reducing glare on consumer electronic screens, which increasingly involves anti-reflective films for flexible electronics. For high-precision applications, the vacuum deposition process for ar coatings remains a critical method.
  • The development of multi-layer ar coating for camera lenses and coatings for high-precision laser optics demands extreme precision. Similarly, specialized sectors are pushing for high-damage threshold ar coatings and ar coatings for aerospace cockpit displays.
  • The emerging field of ar coating for augmented reality glasses is opening new frontiers, while the medical sector requires flawless ar coatings for medical imaging devices. In semiconductor manufacturing, anti-reflective coatings in semiconductor lithography are essential for miniaturization.
  • Achieving breakthroughs in developing scratch-resistant ar coatings and improving ar coating adhesion on polymers through methods like cost-effective roll-to-roll ar coating and the sol-gel anti-reflective coating method is vital. The optical performance of single-layer ar coatings also continues to be optimized for specific, cost-sensitive applications.
  • Strategic procurement that anticipates material needs for these varied processes can reduce production delays by more than 40% compared to reactive purchasing models.

What are the key market drivers leading to the rise in the adoption of Anti-reflective Coatings Industry?

  • The growing demand for anti-reflective coatings from the solar industry serves as a key driver propelling market growth.

  • Market expansion is primarily fueled by relentless demand from the consumer electronics and renewable energy sectors.
  • In electronics, the push for brighter, more vivid displays necessitates effective display ar coatings and anti-glare glass coatings to ensure usability in varied lighting conditions, enhancing readability by over 40% outdoors.
  • In the solar industry, high-transmission optical coatings are critical for maximizing energy conversion; even a 3% increase in light transmission can significantly boost a solar farm's annual output.
  • Manufacturing technologies such as physical vapor deposition and electron beam evaporation, using materials like magnesium fluoride and titanium dioxide, enable the mass production of these films. The consistent demand for durable ar coatings across all sectors ensures strong market momentum.

What are the market trends shaping the Anti-reflective Coatings Industry?

  • The expanding application of anti-reflective coatings within the eyewear industry signifies a key market trend, driven by rising consumer demand for enhanced visual comfort and superior optical performance.

  • Innovation in the market is accelerating, driven by the adoption of advanced material science and manufacturing techniques. The development of nanostructured surfaces and sub-wavelength grating technologies is creating new performance benchmarks, with some solutions improving light transmission in augmented reality optics by over 5%.
  • Wet chemical methods like sol-gel processing are enabling cost-effective production for applications such as architectural glass coatings, reducing capital expenditure by up to 20% compared to traditional vacuum methods. Meanwhile, precision techniques like ion-assisted deposition are critical for creating high-performance display enhancement films for next-generation electronics.
  • These trends are complemented by a focus on multifunctional solutions, including smudge-resistant coatings that improve user experience and reduce maintenance requirements for consumer devices, ultimately enhancing product longevity.

What challenges does the Anti-reflective Coatings Industry face during its growth?

  • Fluctuations in raw material prices present a significant challenge affecting the industry's growth and profitability.

  • Despite strong demand, the market faces significant operational hurdles that temper growth. The complexity of applying custom thin-film coatings to plastic substrates for applications like head-up display coatings increases production cycle times by up to 25% compared to glass.
  • Volatility in the price of raw materials, particularly for key components like indium tin oxide and zirconium dioxide, creates unpredictable cost structures that can erode profit margins by 10-15% in a single quarter.
  • While sputtering with materials such as silicon dioxide is a mature process, achieving the uniform porous silica coatings required for next-generation precision optical ar coatings and automotive sensor coatings remains a technical challenge, impacting yield and scalability.

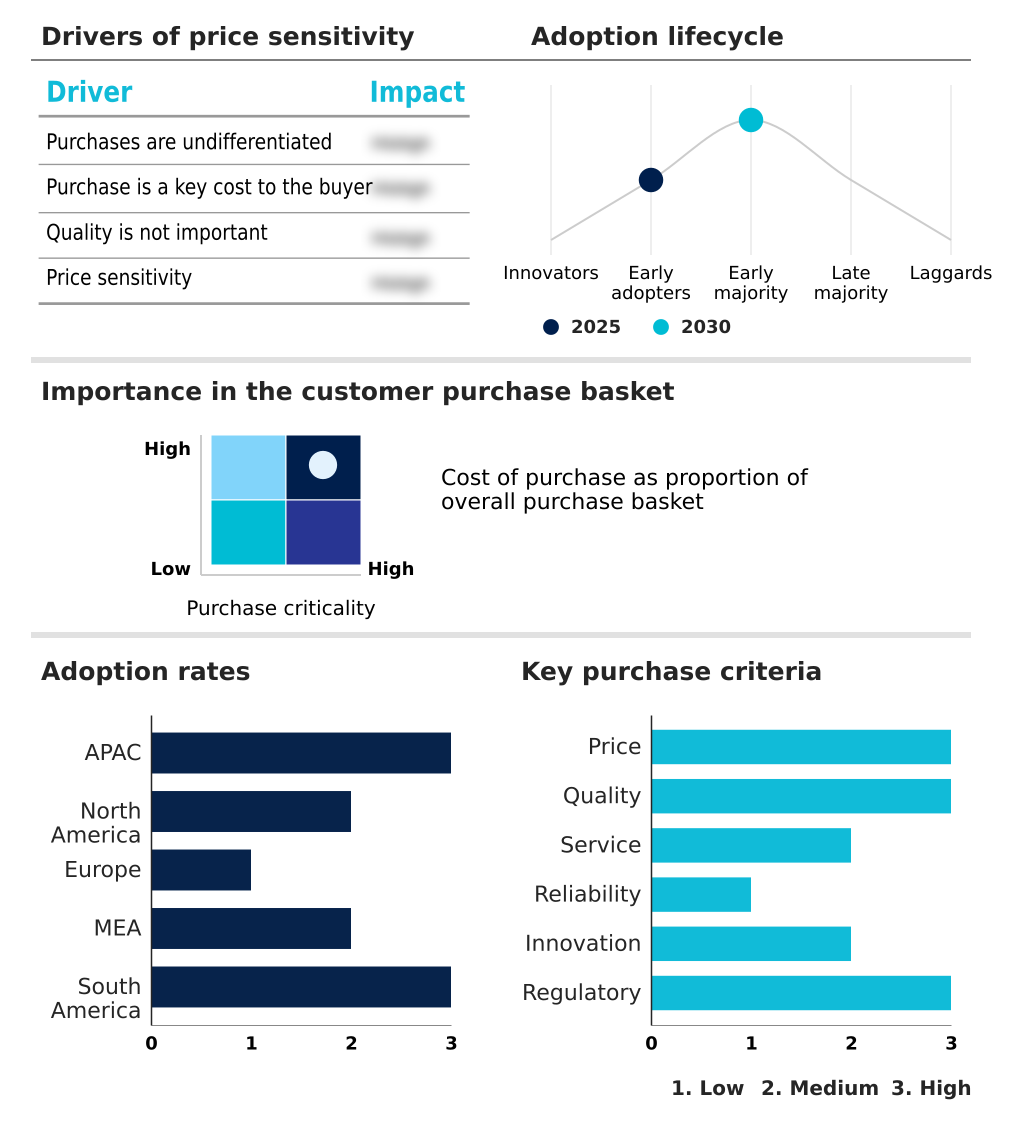
Exclusive Technavio Analysis on Customer Landscape

The anti-reflective coatings market forecasting report includes the adoption lifecycle of the market, covering from the innovator’s stage to the laggard’s stage. It focuses on adoption rates in different regions based on penetration. Furthermore, the anti-reflective coatings market report also includes key purchase criteria and drivers of price sensitivity to help companies evaluate and develop their market growth analysis strategies.

Customer Landscape of Anti-reflective Coatings Industry

Competitive Landscape

Companies are implementing various strategies, such as strategic alliances, anti-reflective coatings market forecast, partnerships, mergers and acquisitions, geographical expansion, and product/service launches, to enhance their presence in the industry.

Abrisa Technologies - Key offerings center on custom thin-film optical coatings and precision anti-reflective solutions engineered for diverse high-tech applications, enhancing performance across multiple industries.

The industry research and growth report includes detailed analyses of the competitive landscape of the market and information about key companies, including:

  • Abrisa Technologies
  • AccuCoat Inc.
  • AGC Inc.
  • AMETEK Inc.
  • Carl Zeiss AG
  • Cascade Optical Corp.
  • Esco Optics Inc.
  • EssilorLuxottica
  • Gooch and Housego Plc
  • Hoya Corp.
  • iCoat Company LLC
  • Materion Balzers Optics
  • Nippon Sheet Glass Co. Ltd.
  • Omega Optical Holdings LLC
  • Optical Coatings Japan
  • Optics and Allied Engg. Ltd.
  • PFG Precision Optics Inc.
  • Viavi Solutions Inc.
  • Vortex Optical Coatings Ltd.

Qualitative and quantitative analysis of companies has been conducted to help clients understand the wider business environment as well as the strengths and weaknesses of key industry players. Data is qualitatively analyzed to categorize companies as pure play, category-focused, industry-focused, and diversified; it is quantitatively analyzed to categorize companies as dominant, leading, strong, tentative, and weak.

Recent Development and News in Anti-reflective coatings market

  • In May 2025, Continental AG announced the integration of an advanced multi-layer anti-reflective coating into its next-generation Augmented Reality Head-Up Displays, designed to minimize ghosting effects and improve driver safety.
  • In March 2025, EssilorLuxottica revealed a breakthrough with a plant-based polymer interference coating that achieves a 99% reduction in surface glare, marking a significant step toward sustainability in the optics industry.
  • In February 2025, SCHOTT AG made its new production facility for advanced vacuum deposition processes fully operational, specifically to meet the high demand for performance optical glass in the European market.
  • In September 2024, AMETEK Inc. expanded its portfolio of high-performance thin-film coatings through a strategic facility upgrade aimed at supporting the burgeoning demand for sophisticated aerospace and defense sensors.

Dive into Technavio’s robust research methodology, blending expert interviews, extensive data synthesis, and validated models for unparalleled Anti-reflective Coatings Market insights. See full methodology.

Market Scope
Page number 308
Base year 2025
Historic period 2020-2024
Forecast period 2026-2030
Growth momentum & CAGR Accelerate at a CAGR of 11%
Market growth 2026-2030 USD 4234.6 million
Market structure Fragmented
YoY growth 2025-2026(%) 9.9%
Key countries China, India, Japan, South Korea, Australia, Indonesia, US, Canada, Mexico, Germany, UK, France, Italy, Spain, The Netherlands, Saudi Arabia, UAE, South Africa, Israel, Turkey, Brazil, Argentina and Chile
Competitive landscape Leading Companies, Market Positioning of Companies, Competitive Strategies, and Industry Risks

Request Free Sample

Research Analyst Overview

  • The anti-reflective coatings market is advancing beyond incremental improvements toward fundamental shifts in material science and deposition technology. A key strategic decision for manufacturers involves allocating R&D capital between refining established physical vapor deposition methods like vacuum deposition and electron beam evaporation, or investing in next-generation technologies such as moth eye nanostructures and other nanostructured surfaces.
  • This choice directly impacts long-term competitiveness. While sputtering with materials like silicon dioxide or titanium dioxide remains a mainstay, achieving superior optical clarity and controlled surface reflection increasingly depends on advanced processes. Techniques like ion-assisted deposition and plasma-enhanced chemical vapor deposition are becoming crucial for creating dense multi-layer coatings with specific oleophobic characteristics.
  • Furthermore, the development of porous silica coatings and the precise management of refractive index are critical for specialized applications. The adoption of plasma-enhanced chemical vapor deposition for thin-film optical coating has enabled some manufacturers to reduce coating cycle times by 20%, directly boosting throughput and profitability.
  • This efficiency gain underscores the importance of technological adoption in a market driven by both performance and cost.

What are the Key Data Covered in this Anti-reflective Coatings Market Research and Growth Report?

  • What is the expected growth of the Anti-reflective Coatings Market between 2026 and 2030?

    • USD 4.23 billion, at a CAGR of 11%

  • What segmentation does the market report cover?

    • The report is segmented by Application (Eyewear, Electronics, Solar, Automobile, and Others), Technology (Vacuum deposition, Electron beam evaporation, Sputtering, Roll to roll, and Others), Type (Multi layered, and Single layered) and Geography (APAC, North America, Europe, Middle East and Africa, South America)

  • Which regions are analyzed in the report?

    • APAC, North America, Europe, Middle East and Africa and South America

  • What are the key growth drivers and market challenges?

    • Growing demand for anti-reflective coatings in solar industry, Fluctuations in raw material prices

  • Who are the major players in the Anti-reflective Coatings Market?

    • Abrisa Technologies, AccuCoat Inc., AGC Inc., AMETEK Inc., Carl Zeiss AG, Cascade Optical Corp., Esco Optics Inc., EssilorLuxottica, Gooch and Housego Plc, Hoya Corp., iCoat Company LLC, Materion Balzers Optics, Nippon Sheet Glass Co. Ltd., Omega Optical Holdings LLC, Optical Coatings Japan, Optics and Allied Engg. Ltd., PFG Precision Optics Inc., Viavi Solutions Inc. and Vortex Optical Coatings Ltd.

Market Research Insights

  • Market dynamics are shaped by a continuous push for higher performance against persistent cost pressures. The adoption of durable ar coatings in consumer electronics has been shown to reduce warranty claims related to screen damage by over 10%.
  • In the solar sector, high-transmission optical coatings can increase energy yield by up to 4%, directly impacting the financial viability of large-scale projects. Innovations in custom thin-film coatings for specialized sectors like aerospace and medical devices allow for product differentiation.
  • Companies that successfully balance the R&D investment required for precision optical ar coatings with scalable production methods achieve a significant competitive advantage. This balance is critical as manufacturing efficiencies, such as reducing material waste by 15% through optimized processes, are key to profitability.

We can help! Our analysts can customize this anti-reflective coatings market research report to meet your requirements.

Get in touch

1. Executive Summary

1.1 Market overview

Executive Summary - Chart on Market Overview
Executive Summary - Data Table on Market Overview
Executive Summary - Chart on Global Market Characteristics
Executive Summary - Chart on Market by Geography
Executive Summary - Chart on Market Segmentation by Application
Executive Summary - Chart on Market Segmentation by Technology
Executive Summary - Chart on Market Segmentation by Type
Executive Summary - Chart on Incremental Growth
Executive Summary - Data Table on Incremental Growth
Executive Summary - Chart on Company Market Positioning

2. Technavio Analysis

2.1 Analysis of price sensitivity, lifecycle, customer purchase basket, adoption rates, and purchase criteria

2.2 Criticality of inputs and Factors of differentiation

Chart on Overview on criticality of inputs and factors of differentiation

2.3 Factors of disruption

Chart on Overview on factors of disruption

2.4 Impact of drivers and challenges

Chart on Impact of drivers and challenges in 2025 and 2030

3. Market Landscape

3.1 Market ecosystem

Chart on Parent Market
Data Table on - Parent Market

3.2 Market characteristics

Chart on Market characteristics analysis

3.3 Value chain analysis

Chart on Value chain analysis

4. Market Sizing

4.1 Market definition

Data Table on Offerings of companies included in the market definition

4.2 Market segment analysis

Market segments

4.3 Market size 2025

4.4 Market outlook: Forecast for 2025-2030

Chart on Global - Market size and forecast 2025-2030 ($ million)
Data Table on Global - Market size and forecast 2025-2030 ($ million)
Chart on Global Market: Year-over-year growth 2025-2030 (%)
Data Table on Global Market: Year-over-year growth 2025-2030 (%)

5. Historic Market Size

5.1 Global Anti-Reflective Coatings Market 2020 - 2024

Historic Market Size - Data Table on Global Anti-Reflective Coatings Market 2020 - 2024 ($ million)

5.2 Application segment analysis 2020 - 2024

Historic Market Size - Application Segment 2020 - 2024 ($ million)

5.3 Technology segment analysis 2020 - 2024

Historic Market Size - Technology Segment 2020 - 2024 ($ million)

5.4 Type segment analysis 2020 - 2024

Historic Market Size - Type Segment 2020 - 2024 ($ million)

5.5 Geography segment analysis 2020 - 2024

Historic Market Size - Geography Segment 2020 - 2024 ($ million)

5.6 Country segment analysis 2020 - 2024

Historic Market Size - Country Segment 2020 - 2024 ($ million)

6. Qualitative Analysis

6.1 The AI Impact on Global Anti-Reflective Coatings Market

7. Five Forces Analysis

7.1 Five forces summary

Five forces analysis - Comparison between 2025 and 2030

7.2 Bargaining power of buyers

Bargaining power of buyers - Impact of key factors 2025 and 2030

7.3 Bargaining power of suppliers

Bargaining power of suppliers - Impact of key factors in 2025 and 2030

7.4 Threat of new entrants

Threat of new entrants - Impact of key factors in 2025 and 2030

7.5 Threat of substitutes

Threat of substitutes - Impact of key factors in 2025 and 2030

7.6 Threat of rivalry

Threat of rivalry - Impact of key factors in 2025 and 2030

7.7 Market condition

Chart on Market condition - Five forces 2025 and 2030

8. Market Segmentation by Application

8.1 Market segments

Chart on Application - Market share 2025-2030 (%)
Data Table on Application - Market share 2025-2030 (%)

8.2 Comparison by Application

Chart on Comparison by Application
Data Table on Comparison by Application

8.3 Eyewear - Market size and forecast 2025-2030

Chart on Eyewear - Market size and forecast 2025-2030 ($ million)
Data Table on Eyewear - Market size and forecast 2025-2030 ($ million)
Chart on Eyewear - Year-over-year growth 2025-2030 (%)
Data Table on Eyewear - Year-over-year growth 2025-2030 (%)

8.4 Electronics - Market size and forecast 2025-2030

Chart on Electronics - Market size and forecast 2025-2030 ($ million)
Data Table on Electronics - Market size and forecast 2025-2030 ($ million)
Chart on Electronics - Year-over-year growth 2025-2030 (%)
Data Table on Electronics - Year-over-year growth 2025-2030 (%)

8.5 Solar - Market size and forecast 2025-2030

Chart on Solar - Market size and forecast 2025-2030 ($ million)
Data Table on Solar - Market size and forecast 2025-2030 ($ million)
Chart on Solar - Year-over-year growth 2025-2030 (%)
Data Table on Solar - Year-over-year growth 2025-2030 (%)

8.6 Automobile - Market size and forecast 2025-2030

Chart on Automobile - Market size and forecast 2025-2030 ($ million)
Data Table on Automobile - Market size and forecast 2025-2030 ($ million)
Chart on Automobile - Year-over-year growth 2025-2030 (%)
Data Table on Automobile - Year-over-year growth 2025-2030 (%)

8.7 Others - Market size and forecast 2025-2030

Chart on Others - Market size and forecast 2025-2030 ($ million)
Data Table on Others - Market size and forecast 2025-2030 ($ million)
Chart on Others - Year-over-year growth 2025-2030 (%)
Data Table on Others - Year-over-year growth 2025-2030 (%)

8.8 Market opportunity by Application

Market opportunity by Application ($ million)
Data Table on Market opportunity by Application ($ million)

9. Market Segmentation by Technology

9.1 Market segments

Chart on Technology - Market share 2025-2030 (%)
Data Table on Technology - Market share 2025-2030 (%)

9.2 Comparison by Technology

Chart on Comparison by Technology
Data Table on Comparison by Technology

9.3 Vacuum deposition - Market size and forecast 2025-2030

Chart on Vacuum deposition - Market size and forecast 2025-2030 ($ million)
Data Table on Vacuum deposition - Market size and forecast 2025-2030 ($ million)
Chart on Vacuum deposition - Year-over-year growth 2025-2030 (%)
Data Table on Vacuum deposition - Year-over-year growth 2025-2030 (%)

9.4 Electron beam evaporation - Market size and forecast 2025-2030

Chart on Electron beam evaporation - Market size and forecast 2025-2030 ($ million)
Data Table on Electron beam evaporation - Market size and forecast 2025-2030 ($ million)
Chart on Electron beam evaporation - Year-over-year growth 2025-2030 (%)
Data Table on Electron beam evaporation - Year-over-year growth 2025-2030 (%)

9.5 Sputtering - Market size and forecast 2025-2030

Chart on Sputtering - Market size and forecast 2025-2030 ($ million)
Data Table on Sputtering - Market size and forecast 2025-2030 ($ million)
Chart on Sputtering - Year-over-year growth 2025-2030 (%)
Data Table on Sputtering - Year-over-year growth 2025-2030 (%)

9.6 Roll to roll - Market size and forecast 2025-2030

Chart on Roll to roll - Market size and forecast 2025-2030 ($ million)
Data Table on Roll to roll - Market size and forecast 2025-2030 ($ million)
Chart on Roll to roll - Year-over-year growth 2025-2030 (%)
Data Table on Roll to roll - Year-over-year growth 2025-2030 (%)

9.7 Others - Market size and forecast 2025-2030

Chart on Others - Market size and forecast 2025-2030 ($ million)
Data Table on Others - Market size and forecast 2025-2030 ($ million)
Chart on Others - Year-over-year growth 2025-2030 (%)
Data Table on Others - Year-over-year growth 2025-2030 (%)

9.8 Market opportunity by Technology

Market opportunity by Technology ($ million)
Data Table on Market opportunity by Technology ($ million)

10. Market Segmentation by Type

10.1 Market segments

Chart on Type - Market share 2025-2030 (%)
Data Table on Type - Market share 2025-2030 (%)

10.2 Comparison by Type

Chart on Comparison by Type
Data Table on Comparison by Type

10.3 Multi layered - Market size and forecast 2025-2030

Chart on Multi layered - Market size and forecast 2025-2030 ($ million)
Data Table on Multi layered - Market size and forecast 2025-2030 ($ million)
Chart on Multi layered - Year-over-year growth 2025-2030 (%)
Data Table on Multi layered - Year-over-year growth 2025-2030 (%)

10.4 Single layered - Market size and forecast 2025-2030

Chart on Single layered - Market size and forecast 2025-2030 ($ million)
Data Table on Single layered - Market size and forecast 2025-2030 ($ million)
Chart on Single layered - Year-over-year growth 2025-2030 (%)
Data Table on Single layered - Year-over-year growth 2025-2030 (%)

10.5 Market opportunity by Type

Market opportunity by Type ($ million)
Data Table on Market opportunity by Type ($ million)

11. Customer Landscape

11.1 Customer landscape overview

Analysis of price sensitivity, lifecycle, customer purchase basket, adoption rates, and purchase criteria

12. Geographic Landscape

12.1 Geographic segmentation

Chart on Market share by geography 2025-2030 (%)
Data Table on Market share by geography 2025-2030 (%)

12.2 Geographic comparison

Chart on Geographic comparison
Data Table on Geographic comparison

12.3 APAC - Market size and forecast 2025-2030

Chart on APAC - Market size and forecast 2025-2030 ($ million)
Data Table on APAC - Market size and forecast 2025-2030 ($ million)
Chart on APAC - Year-over-year growth 2025-2030 (%)
Data Table on APAC - Year-over-year growth 2025-2030 (%)
Chart on Regional Comparison - APAC
Data Table on Regional Comparison - APAC

12.3.1 China - Market size and forecast 2025-2030

Chart on China - Market size and forecast 2025-2030 ($ million)
Data Table on China - Market size and forecast 2025-2030 ($ million)
Chart on China - Year-over-year growth 2025-2030 (%)
Data Table on China - Year-over-year growth 2025-2030 (%)

12.3.2 India - Market size and forecast 2025-2030

Chart on India - Market size and forecast 2025-2030 ($ million)
Data Table on India - Market size and forecast 2025-2030 ($ million)
Chart on India - Year-over-year growth 2025-2030 (%)
Data Table on India - Year-over-year growth 2025-2030 (%)

12.3.3 Japan - Market size and forecast 2025-2030

Chart on Japan - Market size and forecast 2025-2030 ($ million)
Data Table on Japan - Market size and forecast 2025-2030 ($ million)
Chart on Japan - Year-over-year growth 2025-2030 (%)
Data Table on Japan - Year-over-year growth 2025-2030 (%)

12.3.4 South Korea - Market size and forecast 2025-2030

Chart on South Korea - Market size and forecast 2025-2030 ($ million)
Data Table on South Korea - Market size and forecast 2025-2030 ($ million)
Chart on South Korea - Year-over-year growth 2025-2030 (%)
Data Table on South Korea - Year-over-year growth 2025-2030 (%)

12.3.5 Australia - Market size and forecast 2025-2030

Chart on Australia - Market size and forecast 2025-2030 ($ million)
Data Table on Australia - Market size and forecast 2025-2030 ($ million)
Chart on Australia - Year-over-year growth 2025-2030 (%)
Data Table on Australia - Year-over-year growth 2025-2030 (%)

12.3.6 Indonesia - Market size and forecast 2025-2030

Chart on Indonesia - Market size and forecast 2025-2030 ($ million)
Data Table on Indonesia - Market size and forecast 2025-2030 ($ million)
Chart on Indonesia - Year-over-year growth 2025-2030 (%)
Data Table on Indonesia - Year-over-year growth 2025-2030 (%)

12.4 North America - Market size and forecast 2025-2030

Chart on North America - Market size and forecast 2025-2030 ($ million)
Data Table on North America - Market size and forecast 2025-2030 ($ million)
Chart on North America - Year-over-year growth 2025-2030 (%)
Data Table on North America - Year-over-year growth 2025-2030 (%)
Chart on Regional Comparison - North America
Data Table on Regional Comparison - North America

12.4.1 US - Market size and forecast 2025-2030

Chart on US - Market size and forecast 2025-2030 ($ million)
Data Table on US - Market size and forecast 2025-2030 ($ million)
Chart on US - Year-over-year growth 2025-2030 (%)
Data Table on US - Year-over-year growth 2025-2030 (%)

12.4.2 Canada - Market size and forecast 2025-2030

Chart on Canada - Market size and forecast 2025-2030 ($ million)
Data Table on Canada - Market size and forecast 2025-2030 ($ million)
Chart on Canada - Year-over-year growth 2025-2030 (%)
Data Table on Canada - Year-over-year growth 2025-2030 (%)

12.4.3 Mexico - Market size and forecast 2025-2030

Chart on Mexico - Market size and forecast 2025-2030 ($ million)
Data Table on Mexico - Market size and forecast 2025-2030 ($ million)
Chart on Mexico - Year-over-year growth 2025-2030 (%)
Data Table on Mexico - Year-over-year growth 2025-2030 (%)

12.5 Europe - Market size and forecast 2025-2030

Chart on Europe - Market size and forecast 2025-2030 ($ million)
Data Table on Europe - Market size and forecast 2025-2030 ($ million)
Chart on Europe - Year-over-year growth 2025-2030 (%)
Data Table on Europe - Year-over-year growth 2025-2030 (%)
Chart on Regional Comparison - Europe
Data Table on Regional Comparison - Europe

12.5.1 Germany - Market size and forecast 2025-2030

Chart on Germany - Market size and forecast 2025-2030 ($ million)
Data Table on Germany - Market size and forecast 2025-2030 ($ million)
Chart on Germany - Year-over-year growth 2025-2030 (%)
Data Table on Germany - Year-over-year growth 2025-2030 (%)

12.5.2 UK - Market size and forecast 2025-2030

Chart on UK - Market size and forecast 2025-2030 ($ million)
Data Table on UK - Market size and forecast 2025-2030 ($ million)
Chart on UK - Year-over-year growth 2025-2030 (%)
Data Table on UK - Year-over-year growth 2025-2030 (%)

12.5.3 France - Market size and forecast 2025-2030

Chart on France - Market size and forecast 2025-2030 ($ million)
Data Table on France - Market size and forecast 2025-2030 ($ million)
Chart on France - Year-over-year growth 2025-2030 (%)
Data Table on France - Year-over-year growth 2025-2030 (%)

12.5.4 Italy - Market size and forecast 2025-2030

Chart on Italy - Market size and forecast 2025-2030 ($ million)
Data Table on Italy - Market size and forecast 2025-2030 ($ million)
Chart on Italy - Year-over-year growth 2025-2030 (%)
Data Table on Italy - Year-over-year growth 2025-2030 (%)

12.5.5 Spain - Market size and forecast 2025-2030

Chart on Spain - Market size and forecast 2025-2030 ($ million)
Data Table on Spain - Market size and forecast 2025-2030 ($ million)
Chart on Spain - Year-over-year growth 2025-2030 (%)
Data Table on Spain - Year-over-year growth 2025-2030 (%)

12.5.6 The Netherlands - Market size and forecast 2025-2030

Chart on The Netherlands - Market size and forecast 2025-2030 ($ million)
Data Table on The Netherlands - Market size and forecast 2025-2030 ($ million)
Chart on The Netherlands - Year-over-year growth 2025-2030 (%)
Data Table on The Netherlands - Year-over-year growth 2025-2030 (%)

12.6 Middle East and Africa - Market size and forecast 2025-2030

Chart on Middle East and Africa - Market size and forecast 2025-2030 ($ million)
Data Table on Middle East and Africa - Market size and forecast 2025-2030 ($ million)
Chart on Middle East and Africa - Year-over-year growth 2025-2030 (%)
Data Table on Middle East and Africa - Year-over-year growth 2025-2030 (%)
Chart on Regional Comparison - Middle East and Africa
Data Table on Regional Comparison - Middle East and Africa

12.6.1 Saudi Arabia - Market size and forecast 2025-2030

Chart on Saudi Arabia - Market size and forecast 2025-2030 ($ million)
Data Table on Saudi Arabia - Market size and forecast 2025-2030 ($ million)
Chart on Saudi Arabia - Year-over-year growth 2025-2030 (%)
Data Table on Saudi Arabia - Year-over-year growth 2025-2030 (%)

12.6.2 UAE - Market size and forecast 2025-2030

Chart on UAE - Market size and forecast 2025-2030 ($ million)
Data Table on UAE - Market size and forecast 2025-2030 ($ million)
Chart on UAE - Year-over-year growth 2025-2030 (%)
Data Table on UAE - Year-over-year growth 2025-2030 (%)

12.6.3 South Africa - Market size and forecast 2025-2030

Chart on South Africa - Market size and forecast 2025-2030 ($ million)
Data Table on South Africa - Market size and forecast 2025-2030 ($ million)
Chart on South Africa - Year-over-year growth 2025-2030 (%)
Data Table on South Africa - Year-over-year growth 2025-2030 (%)

12.6.4 Israel - Market size and forecast 2025-2030

Chart on Israel - Market size and forecast 2025-2030 ($ million)
Data Table on Israel - Market size and forecast 2025-2030 ($ million)
Chart on Israel - Year-over-year growth 2025-2030 (%)
Data Table on Israel - Year-over-year growth 2025-2030 (%)

12.6.5 Turkey - Market size and forecast 2025-2030

Chart on Turkey - Market size and forecast 2025-2030 ($ million)
Data Table on Turkey - Market size and forecast 2025-2030 ($ million)
Chart on Turkey - Year-over-year growth 2025-2030 (%)
Data Table on Turkey - Year-over-year growth 2025-2030 (%)

12.7 South America - Market size and forecast 2025-2030

Chart on South America - Market size and forecast 2025-2030 ($ million)
Data Table on South America - Market size and forecast 2025-2030 ($ million)
Chart on South America - Year-over-year growth 2025-2030 (%)
Data Table on South America - Year-over-year growth 2025-2030 (%)
Chart on Regional Comparison - South America
Data Table on Regional Comparison - South America

12.7.1 Brazil - Market size and forecast 2025-2030

Chart on Brazil - Market size and forecast 2025-2030 ($ million)
Data Table on Brazil - Market size and forecast 2025-2030 ($ million)
Chart on Brazil - Year-over-year growth 2025-2030 (%)
Data Table on Brazil - Year-over-year growth 2025-2030 (%)

12.7.2 Argentina - Market size and forecast 2025-2030

Chart on Argentina - Market size and forecast 2025-2030 ($ million)
Data Table on Argentina - Market size and forecast 2025-2030 ($ million)
Chart on Argentina - Year-over-year growth 2025-2030 (%)
Data Table on Argentina - Year-over-year growth 2025-2030 (%)

12.7.3 Chile - Market size and forecast 2025-2030

Chart on Chile - Market size and forecast 2025-2030 ($ million)
Data Table on Chile - Market size and forecast 2025-2030 ($ million)
Chart on Chile - Year-over-year growth 2025-2030 (%)
Data Table on Chile - Year-over-year growth 2025-2030 (%)

12.8 Market opportunity by geography

Market opportunity by geography ($ million)
Data Tables on Market opportunity by geography ($ million)

13. Drivers, Challenges, and Opportunity

13.1 Market drivers

Growing demand for anti-reflective coatings in solar industry
Emerging demand of anti-reflective coatings from APAC
Rise in demand from consumer electronics industry

13.2 Market challenges

Fluctuations in raw material prices
Complexities in plastic optical coatings
Scarcity in production of indium

13.3 Impact of drivers and challenges

Impact of drivers and challenges in 2025 and 2030

13.4 Market opportunities

Increasing applications of anti-reflective coatings in eyewear
Growing investments in research and development
Emerging applications of anti-reflective coatings

14. Competitive Landscape

14.1 Overview

14.2

Overview on criticality of inputs and factors of differentiation

14.3 Landscape disruption

Overview on factors of disruption

14.4 Industry risks

Impact of key risks on business

15. Competitive Analysis

15.1 Companies profiled

Companies covered

15.2 Company ranking index

15.3 Market positioning of companies

Matrix on companies position and classification

15.4 Abrisa Technologies

Abrisa Technologies - Overview
Abrisa Technologies - Product / Service
Abrisa Technologies - Key offerings
SWOT

15.5 AccuCoat Inc.

AccuCoat Inc. - Overview
AccuCoat Inc. - Product / Service
AccuCoat Inc. - Key offerings
SWOT

15.6 AGC Inc.

AGC Inc. - Overview
AGC Inc. - Business segments
AGC Inc. - Key news
AGC Inc. - Key offerings
AGC Inc. - Segment focus
SWOT

15.7 AMETEK Inc.

AMETEK Inc. - Overview
AMETEK Inc. - Business segments
AMETEK Inc. - Key news
AMETEK Inc. - Key offerings
AMETEK Inc. - Segment focus
SWOT

15.8 Carl Zeiss AG

Carl Zeiss AG - Overview
Carl Zeiss AG - Product / Service
Carl Zeiss AG - Key news
Carl Zeiss AG - Key offerings
SWOT

15.9 Cascade Optical Corp.

Cascade Optical Corp. - Overview
Cascade Optical Corp. - Product / Service
Cascade Optical Corp. - Key offerings
SWOT

15.10 Esco Optics Inc.

Esco Optics Inc. - Overview
Esco Optics Inc. - Product / Service
Esco Optics Inc. - Key offerings
SWOT

15.11 EssilorLuxottica

EssilorLuxottica - Overview
EssilorLuxottica - Business segments
EssilorLuxottica - Key news
EssilorLuxottica - Key offerings
EssilorLuxottica - Segment focus
SWOT

15.12 Gooch and Housego Plc

Gooch and Housego Plc - Overview
Gooch and Housego Plc - Business segments
Gooch and Housego Plc - Key offerings
Gooch and Housego Plc - Segment focus
SWOT

15.13 Hoya Corp.

Hoya Corp. - Overview
Hoya Corp. - Business segments
Hoya Corp. - Key offerings
Hoya Corp. - Segment focus
SWOT

15.14 iCoat Company LLC

iCoat Company LLC - Overview
iCoat Company LLC - Product / Service
iCoat Company LLC - Key offerings
SWOT

15.15 Nippon Sheet Glass Co. Ltd.

Nippon Sheet Glass Co. Ltd. - Overview
Nippon Sheet Glass Co. Ltd. - Business segments
Nippon Sheet Glass Co. Ltd. - Key news
Nippon Sheet Glass Co. Ltd. - Key offerings
Nippon Sheet Glass Co. Ltd. - Segment focus
SWOT

15.16 Omega Optical Holdings LLC

Omega Optical Holdings LLC - Overview
Omega Optical Holdings LLC - Product / Service
Omega Optical Holdings LLC - Key offerings
SWOT

15.17 Optical Coatings Japan

Optical Coatings Japan - Overview
Optical Coatings Japan - Product / Service
Optical Coatings Japan - Key offerings
SWOT

15.18 Optics and Allied Engg. Ltd.

Optics and Allied Engg. Ltd. - Overview
Optics and Allied Engg. Ltd. - Product / Service
Optics and Allied Engg. Ltd. - Key offerings
SWOT

16. Appendix

16.1 Scope of the report

Market definition
Objectives
Notes and caveats

16.2 Inclusions and exclusions checklist

Inclusions checklist
Exclusions checklist

16.3 Currency conversion rates for US$

16.4 Research methodology

16.5 Data procurement

Information sources

16.6 Data validation

16.7 Validation techniques employed for market sizing

16.8 Data synthesis

16.9 360 degree market analysis

16.10 List of abbreviations

Research Methodology

Technavio presents a detailed picture of the market by way of study, synthesis, and summation of data from multiple sources. The analysts have presented the various facets of the market with a particular focus on identifying the key industry influencers. The data thus presented is comprehensive, reliable, and the result of extensive research, both primary and secondary.

INFORMATION SOURCES

Primary sources

  • Manufacturers and suppliers
  • Channel partners
  • Industry experts
  • Strategic decision makers

Secondary sources

  • Industry journals and periodicals
  • Government data
  • Financial reports of key industry players
  • Historical data
  • Press releases

DATA ANALYSIS

Data Synthesis

  • Collation of data
  • Estimation of key figures
  • Analysis of derived insights

Data Validation

  • Triangulation with data models
  • Reference against proprietary databases
  • Corroboration with industry experts

REPORT WRITING

Qualitative

  • Market drivers
  • Market challenges
  • Market trends
  • Five forces analysis

Quantitative

  • Market size and forecast
  • Market segmentation
  • Geographical insights
  • Competitive landscape

Interested in this report?

Get your sample now to see our research methodology and insights!

Download Now

Frequently Asked Questions

Anti-reflective Coatings market growth will increase by USD 4234.6 million during 2026-2030.

The Anti-reflective Coatings market is expected to grow at a CAGR of 11% during 2026-2030.

Anti-reflective Coatings market is segmented by Application (Eyewear, Electronics, Solar, Automobile, Others) Technology (Vacuum deposition, Electron beam evaporation, Sputtering, Roll to roll, Others) Type (Multi layered, Single layered)

Abrisa Technologies, AccuCoat Inc., AGC Inc., AMETEK Inc., Carl Zeiss AG, Cascade Optical Corp., Esco Optics Inc., EssilorLuxottica, Gooch and Housego Plc, Hoya Corp., iCoat Company LLC, Materion Balzers Optics, Nippon Sheet Glass Co. Ltd., Omega Optical Holdings LLC, Optical Coatings Japan, Optics and Allied Engg. Ltd., PFG Precision Optics Inc., Viavi Solutions Inc., Vortex Optical Coatings Ltd. are a few of the key vendors in the Anti-reflective Coatings market.

APAC will register the highest growth rate of 44.7% among the other regions. Therefore, the Anti-reflective Coatings market in APAC is expected to garner significant business opportunities for the vendors during the forecast period.

China, India, Japan, South Korea, Australia, Indonesia, US, Canada, Mexico, Germany, UK, France, Italy, Spain, The Netherlands, Saudi Arabia, UAE, South Africa, Israel, Turkey, Brazil, Argentina, Chile

  • Growing demand for anti-reflective coatings in solar industry is the driving factor this market.

The Anti-reflective Coatings market vendors should focus on grabbing business opportunities from the Application segment as it accounted for the largest market share in the base year.
RIA - Research AI Assistant
Ask RIA