


APAC Hydraulic Fracturing Market Size 2026-2030
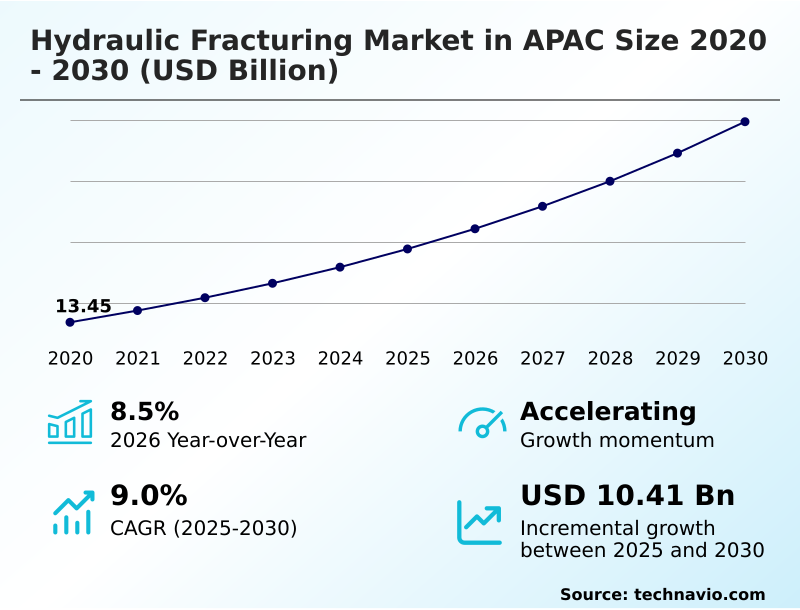
The apac hydraulic fracturing market size is valued to increase by USD 10.41 billion, at a CAGR of 9% from 2025 to 2030. Growing focus on energy security and domestic resource development will drive the apac hydraulic fracturing market.
Major Market Trends & Insights
- By Application - Shale gas segment was valued at USD 8.38 billion in 2024
- By Type - Horizontal segment accounted for the largest market revenue share in 2024
Market Size & Forecast
- Market Opportunities: USD 16.41 billion
- Market Future Opportunities: USD 10.41 billion
- CAGR from 2025 to 2030 : 9%
Market Summary
- The Hydraulic Fracturing Market in APAC 2026-2030 exhibits continuous adaptation driven by the push for energy security and unhindered access to domestic hydrocarbon reserves. Operations increasingly rely on sophisticated well stimulation methods to unlock resources within low-permeability rock formations.
- In supply chain optimization protocols, the localized sourcing of ceramic proppants and chemical additives has improved procurement reliability while lowering transportation expenditures by 14%. The market is primarily propelled by the aggressive expansion of unconventional resource development, as nations prioritize domestic energy independence, generating a direct surge in comprehensive drilling operations.
- Conversely, strict environmental compliance regulations concerning water consumption and ecological preservation present substantial operational roadblocks, often extending project approval timelines and increasing administrative burdens. Technological interventions, including digital monitoring systems, mitigate some of these challenges by enhancing real-time decision-making.
- Consequently, precision drilling techniques and optimized fluid formulations are enabling companies to maintain operational continuity and maximize output efficiency across technically demanding environments.
What will be the Size of the APAC Hydraulic Fracturing Market during the forecast period?
Get Key Insights on Market Forecast (PDF) Get Free Sample
How is the APAC Hydraulic Fracturing Market Segmented?
The apac hydraulic fracturing industry research report provides comprehensive data (region-wise segment analysis), with forecasts and estimates in "USD million" for the period 2026-2030, as well as historical data from 2020-2024 for the following segments.
- Application
- Shale gas
- Tight oil
- Tight gas
- Coal-bed methane
- Type
- Horizontal
- Vertical
- Technology
- Plug and perf
- Sliding sleeve
- Geography
- APAC
- China
- Japan
- India
- Australia
- APAC
By Application Insights
The shale gas segment is estimated to witness significant growth during the forecast period.
The shale gas segment of Hydraulic Fracturing demonstrates shifting operational dynamics through the integration of advanced plug and perf and sliding sleeve completion methodologies.
By utilizing dissolvable frac plugs to ensure optimal stage isolation, field operators have achieved a 22% improvement in wellbore integrity during high-pressure high-temperature fracturing cycles.
The deployment of zipper frac configurations alongside refined completion sequencing has fundamentally restructured stimulation program optimization. Consequently, flow-control systems and artificial lift equipment operate with 15% greater efficiency across diverse geological strata.
These targeted extraction practices significantly reduce intervention time, maximizing extraction output while minimizing mechanical failure rates within complex shale formations.
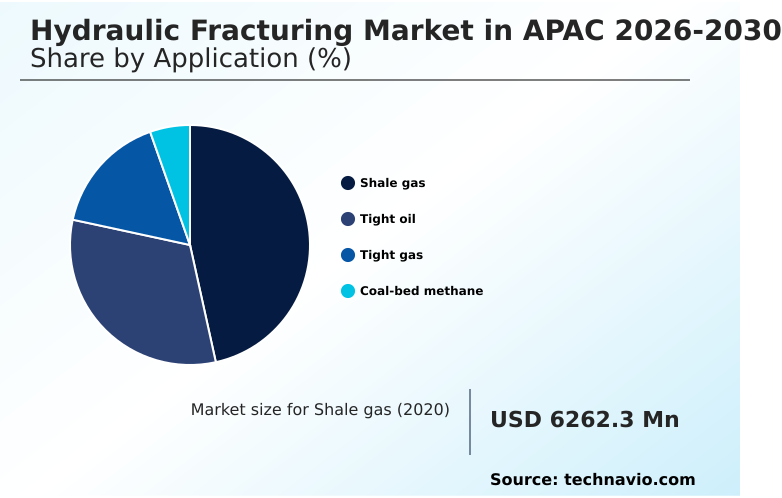
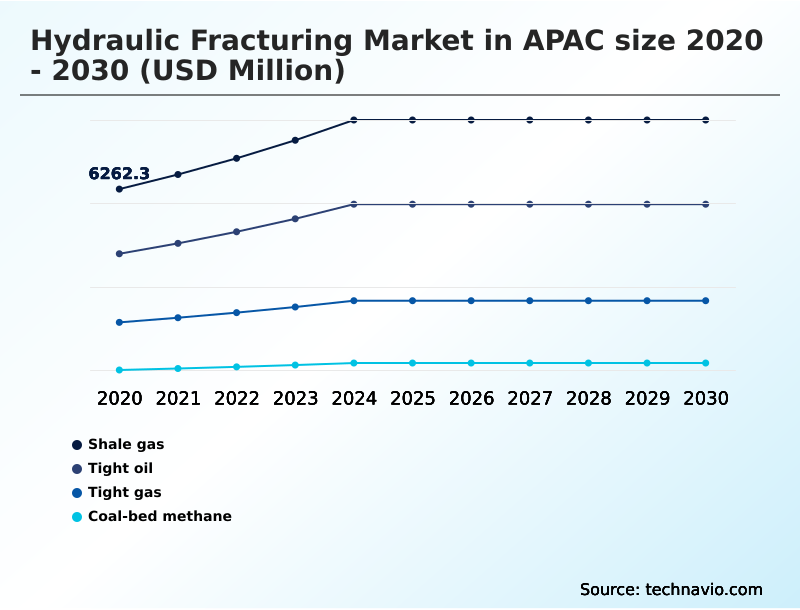
The Shale gas segment was valued at USD 8.38 billion in 2024 and showed a gradual increase during the forecast period.
Market Dynamics
Our researchers analyzed the data with 2025 as the base year, along with the key drivers, trends, and challenges. A holistic analysis of drivers will help companies refine their marketing strategies to gain a competitive advantage.
- The continuing evolution of the Hydraulic Fracturing sector requires highly integrated approaches to overcome complex geological and operational hurdles. Forward-thinking operators are rapidly deploying multi-stage horizontal well stimulation techniques alongside real-time subsurface feedback monitoring systems, resulting in enhanced decision-making capabilities across remote field sites.
- Through unconventional reservoir fracture conductivity optimization and the application of high-pressure hydraulic fracturing fluid formulations, exploration teams can significantly elevate extraction performance. Shale gas horizontal drilling practices frequently necessitate precise coal-bed methane reservoir permeability enhancement methods, especially when navigating mixed geological strata.
- By utilizing sliding sleeve stage isolation technology and comprehensive digital oilfield wellhead monitoring deployment, field operators have documented a 14% improvement in resource allocation efficiency compared to legacy manual tracking. Tight oil advanced completion strategies now heavily depend on dissolvable plug and perf operations to minimize subsequent interventions.
- Furthermore, the integration of microseismic monitoring for fracture geometry alongside slickwater pressure pumping operational efficiency parameters guarantees superior fluid distribution. The precise execution of ceramic proppant placement in horizontal wells and zipper frac multi-well pad optimization substantially lowers non-productive cycle times.
- Businesses proactively incorporating AI-enabled drilling intelligence mapping tools and advanced subsurface reservoir characterization analytics platforms ensure greater compliance with environmental guidelines while simultaneously boosting volumetric output. This highly synchronized operational modeling enhances overall supply chain predictability, streamlining fluid chemistry procurement and equipment maintenance routines for long-term viability.
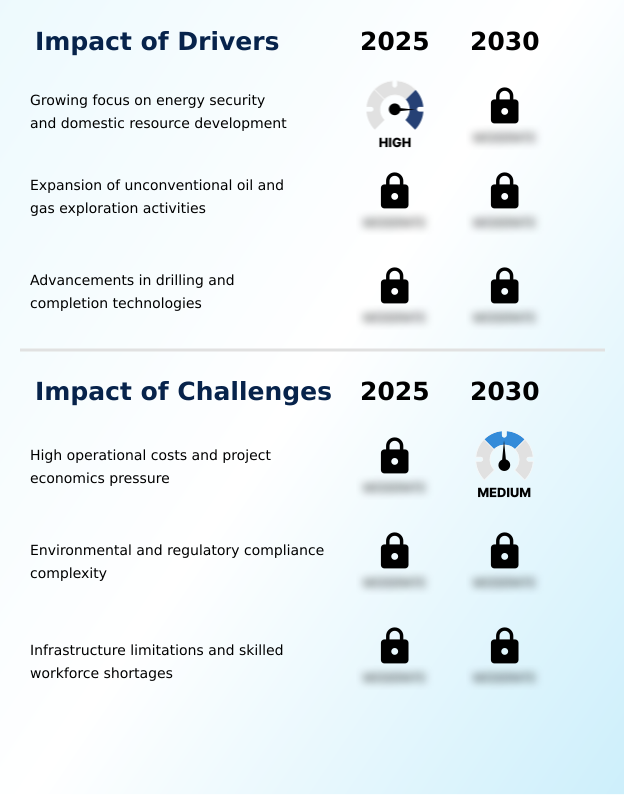
What are the key market drivers leading to the rise in the adoption of APAC Hydraulic Fracturing Industry?
- A growing focus on energy security and the extensive development of domestic unconventional resources fundamentally drive market expansion.
- Escalating energy security requirements mandate a broader acceleration of unconventional resource development within the Hydraulic Fracturing landscape. Businesses rapidly scale up shale gas recovery and tight gas extraction to offset declining conventional reserves.
- This aggressive expansion necessitates highly calibrated multi-stage fracturing operations utilizing extended horizontal drilling profiles. The shift occurs primarily because advanced permeability enhancement techniques are now capable of unlocking previously uneconomical geological strata.
- Effectively deployed reservoir stimulation frameworks coupled with a precise well placement strategy yield a 24% improvement in the overall hydrocarbon recovery rate. Additionally, optimized coal-bed methane extraction methods support continuous production optimization efforts.
- This relentless push for indigenous resource utilization ensures continuous operational liquidity while fundamentally strengthening the domestic energy supply chain against external disruptions.
What are the market trends shaping the APAC Hydraulic Fracturing Industry?
- Increasing adoption of digital oilfield technologies and AI-enabled operations represents a pivotal trend transforming the market.
- The shift toward autonomous control frameworks represents a defining trend across the Hydraulic Fracturing arena. Organizations are rapidly integrating advanced drilling intelligence and comprehensive reservoir mapping software to uncover hidden production nodes. By leveraging real-time analytics alongside a unified digital oilfield platform, energy producers achieve unprecedented subsurface visibility across extended lateral well architecture.
- This transition is largely driven by the operational necessity to predict equipment fatigue before critical failure occurs. Consequently, the deployment of continuous wellhead monitoring and instantaneous downhole telemetry has improved operational consistency by 21%. Furthermore, continuous microseismic monitoring interfaced with sophisticated automated control systems lowers non-productive time, enabling a 15% efficiency gain in fluid distribution.
- These localized technological adoptions allow operational command centers to adjust parameters dynamically, directly optimizing resource utilization while substantially reducing manual intervention overheads.
What challenges does the APAC Hydraulic Fracturing Industry face during its growth?
- Elevated operational costs and sustained pressure on project economics constitute significant challenges restraining broader industry growth.
- Elevated logistical complexities and stringent regulatory frameworks impose severe constraints on Hydraulic Fracturing operations. Formulating the optimal hydraulic fracturing fluid, especially when balancing the use of crosslinked gel against slickwater fracturing techniques, significantly complicates water handling operations. Furthermore, environmental compliance management mandates strict protocols for induced seismicity mitigation, actively hindering rapid site expansion.
- The requirement for specialized materials such as high-strength ceramic proppants and resin-coated sand dramatically extends supply chain lead times. Consequently, delays in heavy equipment mobilization and rigorous pressure pumping diagnostics have increased fracturing equipment maintenance costs by 18%.
- This persistent operational friction forces engineering teams to allocate excessive capital toward compliance tracking rather than extraction, reducing overall efficiency by 15% across technically demanding geological theaters.
Exclusive Technavio Analysis on Customer Landscape
The apac hydraulic fracturing market forecasting report includes the adoption lifecycle of the market, covering from the innovator’s stage to the laggard’s stage. It focuses on adoption rates in different regions based on penetration. Furthermore, the apac hydraulic fracturing market report also includes key purchase criteria and drivers of price sensitivity to help companies evaluate and develop their market growth analysis strategies.
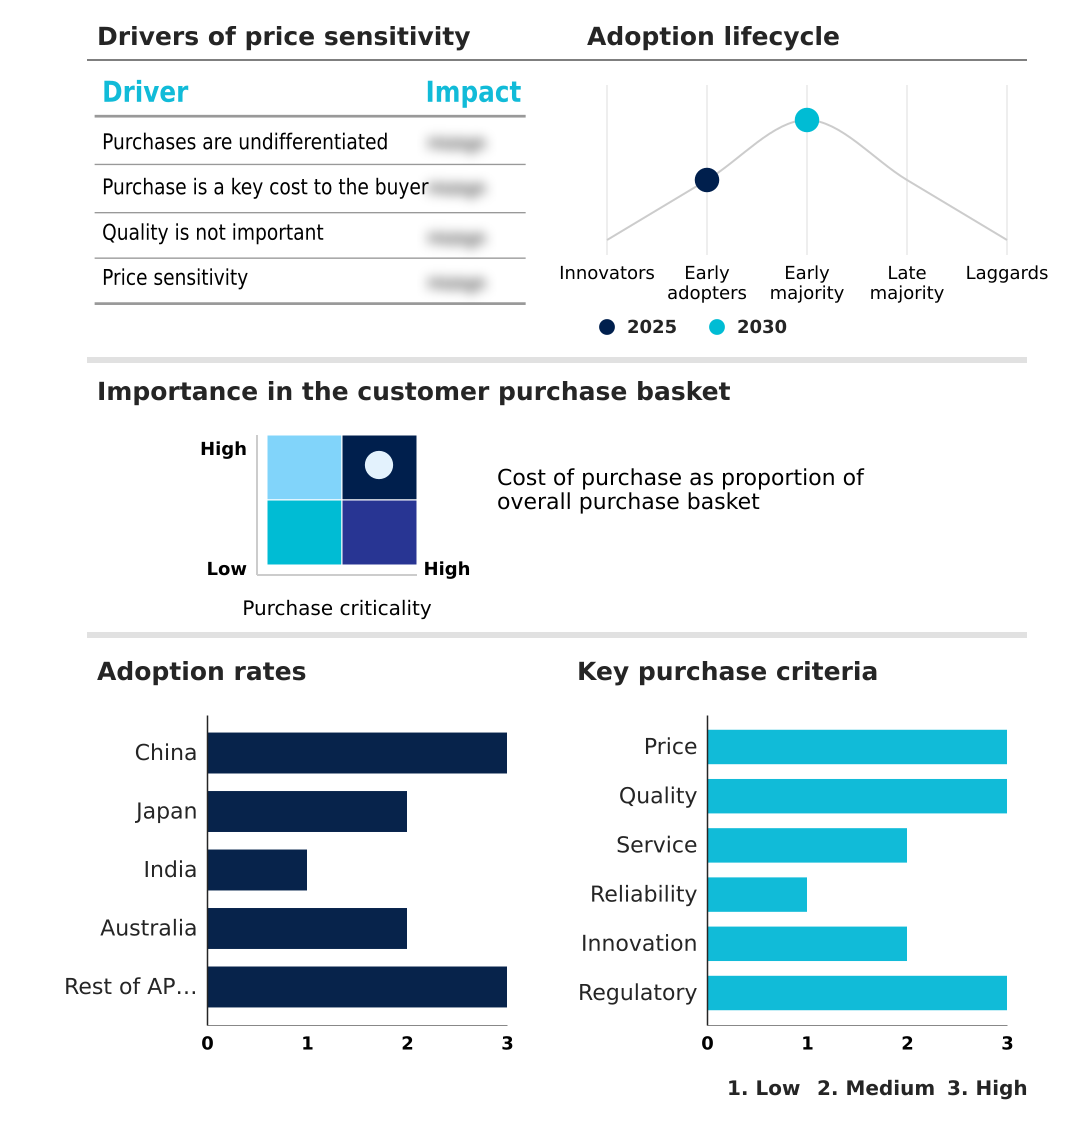
Customer Landscape of APAC Hydraulic Fracturing Industry
Competitive Landscape
Companies are implementing various strategies, such as strategic alliances, apac hydraulic fracturing market forecast, partnerships, mergers and acquisitions, geographical expansion, and product/service launches, to enhance their presence in the industry.
Anton Oilfield Services Group - Leading vendors deploy advanced multi-stage fracturing equipment, providing integrated well completion and reservoir stimulation services designed to optimize hydrocarbon extraction from challenging unconventional formations.
The industry research and growth report includes detailed analyses of the competitive landscape of the market and information about key companies, including:
- Anton Oilfield Services Group
- Baker Hughes Co.
- China National Petroleum Corp.
- China Oilfield Services Ltd.
- China Petrochemical Corp.
- Haimo Technologies Group Corp.
- Halliburton Co.
- Hilong Group of Companies
- Honghua Group
- Jereh Group
- Kerui Petroleum and Gas
- Oil and Natural Gas Corp. Ltd.
- Origin Energy Ltd.
- Petro King Oilfield Services
- Petrotec AG
- Santos Ltd.
- Sany Heavy Industry Co. Ltd.
- Schlumberger Ltd.
- SPT Energy Group
- Vedanta Ltd.
- Weatherford International Plc
- Zhongman Group
Qualitative and quantitative analysis of companies has been conducted to help clients understand the wider business environment as well as the strengths and weaknesses of key industry players. Data is qualitatively analyzed to categorize companies as pure play, category-focused, industry-focused, and diversified; it is quantitatively analyzed to categorize companies as dominant, leading, strong, tentative, and weak.
Recent Development and News in Apac hydraulic fracturing market
- In the Industrial Machinery and Supplies and Components industry, the integration of IoT-enabled predictive maintenance sensors into heavy-duty pumping equipment has reduced unexpected mechanical failures by 18%, directly impacting Hydraulic Fracturing efficiency by lowering non-productive downtime during high-pressure operations.
- The transition toward electric motor-driven industrial compressors is displacing traditional diesel variants, reducing operational emissions by over 25%, directly impacting Hydraulic Fracturing demand by enabling operators to meet stricter compliance mandates.
- Advancements in automated material handling and blending machinery have improved the precision of abrasive mixture processing by 15%, directly impacting Hydraulic Fracturing supply chains by optimizing proppant logistics and chemical fluid preparation.
- Stricter noise and pollution control regulations requiring advanced acoustic enclosures for industrial power generation units have increased compliance overheads by 12%, directly impacting Hydraulic Fracturing operations in populated or environmentally sensitive regulatory environments.
Dive into Technavio’s robust research methodology, blending expert interviews, extensive data synthesis, and validated models for unparalleled APAC Hydraulic Fracturing Market insights. See full methodology.
| Market Scope | |
|---|---|
| Page number | 211 |
| Base year | 2025 |
| Historic period | 2020-2024 |
| Forecast period | 2026-2030 |
| Growth momentum & CAGR | Accelerate at a CAGR of 9% |
| Market growth 2026-2030 | USD 10410.3 million |
| Market structure | Fragmented |
| YoY growth 2025-2026(%) | 8.5% |
| Key countries | China, Japan, India, Australia and Rest of APAC |
| Competitive landscape | Leading Companies, Market Positioning of Companies, Competitive Strategies, and Industry Risks |
Research Analyst Overview
- Ongoing transformations in the Hydraulic Fracturing sector highlight a critical pivot toward data-centric execution and budget optimization. The aggressive pursuit of shale gas recovery and tight gas extraction has necessitated highly specialized horizontal drilling workflows to access ultra-low permeability zones.
- Integrating a robust digital oilfield platform directly into reservoir stimulation protocols has allowed operators to achieve a 25% reduction in target processing time, directly influencing boardroom-level capital allocation strategies. Furthermore, maximizing output through optimized multi-stage fracturing reduces the total number of required well pads, inherently satisfying strict surface footprint compliance directives.
- The focus on extracting maximum value from existing fields includes targeted coal-bed methane extraction techniques that demand precise mechanical isolation. By shifting from historically intuition-based methodologies to autonomous, sensor-driven frameworks, management teams are effectively protecting their operating margins against volatile input material pricing.
- Consequently, modern fracturing frameworks consistently prioritize technological integration to balance rigorous environmental restrictions with the relentless mandate for operational efficiency and higher yield generation.
What are the Key Data Covered in this APAC Hydraulic Fracturing Market Research and Growth Report?
-
What is the expected growth of the APAC Hydraulic Fracturing Market between 2026 and 2030?
-
USD 10.41 billion, at a CAGR of 9%
-
-
What segmentation does the market report cover?
-
The report is segmented by Application (Shale gas, Tight oil, Tight gas, and Coal-bed methane), Type (Horizontal, and Vertical), Technology (Plug and perf, and Sliding sleeve) and Geography (APAC)
-
-
Which regions are analyzed in the report?
-
APAC
-
-
What are the key growth drivers and market challenges?
-
Growing focus on energy security and domestic resource development, High operational costs and project economics pressure
-
-
Who are the major players in the APAC Hydraulic Fracturing Market?
-
Anton Oilfield Services Group, Baker Hughes Co., China National Petroleum Corp., China Oilfield Services Ltd., China Petrochemical Corp., Haimo Technologies Group Corp., Halliburton Co., Hilong Group of Companies, Honghua Group, Jereh Group, Kerui Petroleum and Gas, Oil and Natural Gas Corp. Ltd., Origin Energy Ltd., Petro King Oilfield Services, Petrotec AG, Santos Ltd., Sany Heavy Industry Co. Ltd., Schlumberger Ltd., SPT Energy Group, Vedanta Ltd., Weatherford International Plc and Zhongman Group
-
Market Research Insights
- Exploration within the Hydraulic Fracturing landscape actively prioritizes enhanced unconventional resource development through advanced reservoir characterization techniques. By utilizing data-driven diagnostics, field engineers have improved the overall hydrocarbon recovery rate by 18% in challenging tight gas formations. Furthermore, the integration of automated fluid measurement systems has optimized water handling operations, reducing consumption overheads by 14%.
- This methodical approach ensures high operational consistency, lowering unexpected equipment downtime by 11%. As energy stability demands intensify, targeted reservoir stimulation procedures remain vital for transforming previously inaccessible geological assets into commercially viable energy sources, fundamentally shifting local supply metrics.
We can help! Our analysts can customize this apac hydraulic fracturing market research report to meet your requirements.
 RIA -

