API Security Management Platforms Market Analysis, Size, and Forecast 2026-2030: North America (US, Canada, and Mexico), APAC (China, India, and Japan), Europe (Germany, UK, and France), Middle East and Africa (Saudi Arabia, UAE, and South Africa), South America (Brazil, Argentina, and Colombia), and Rest of World (ROW)

API Security Management Platforms Market Analysis, Size, and Forecast 2026-2030:
North America (US, Canada, and Mexico), APAC (China, India, and Japan), Europe (Germany, UK, and France), Middle East and Africa (Saudi Arabia, UAE, and South Africa), South America (Brazil, Argentina, and Colombia), and Rest of World (ROW)

Published: May 2026 289 Pages SKU: IRTNTR81281

Market Overview at a Glance

$2.02 B
Market Opportunity
16.7%
CAGR 2025 - 2030
36.1%
North America Growth
$976.9 Mn
Solutions segment 2024

Api Security Management Platforms Market Size and Growth Forecast 2026-2030

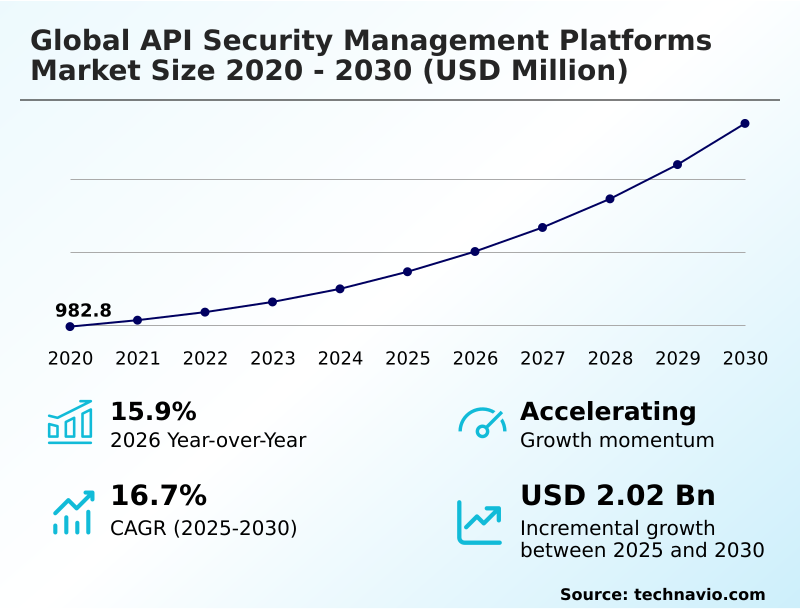
The Api Security Management Platforms Market size was valued at USD 1.73 billion in 2025 growing at a CAGR of 16.7% during the forecast period 2026-2030.

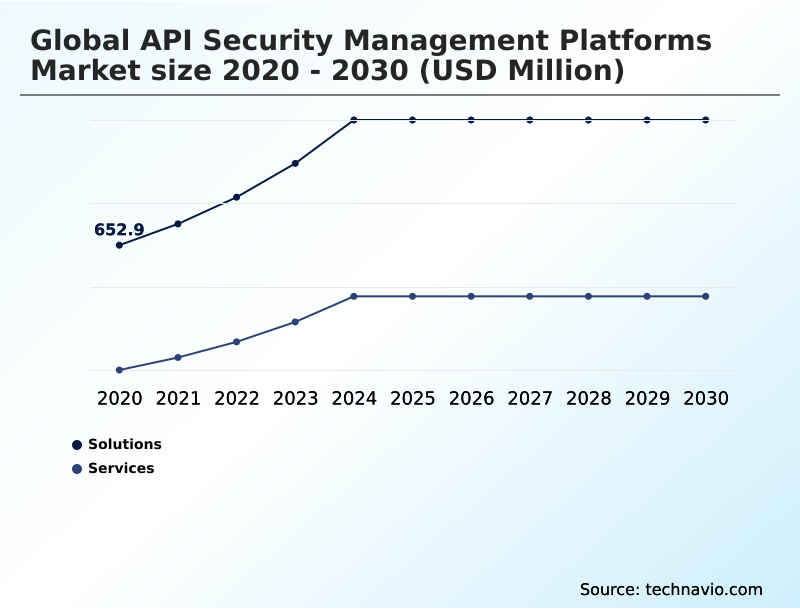
North America accounts for 36.1% of incremental growth during the forecast period. The Solutions segment by Component was valued at USD 976.9 million in 2024, while the Cloud-based segment holds the largest revenue share by Deployment.

The market is projected to grow by USD 2.77 billion from 2020 to 2030, with USD 2.02 billion of the growth expected during the forecast period of 2025 to 2030.

Get Key Insights on Market Forecast (PDF) Request Free Sample

Api Security Management Platforms Market Overview

The API security management platforms market is defined by a fundamental shift toward protecting the connective interfaces of modern software, with a year-over-year growth of 15.9% underscoring its importance. As North America contributes over 36% of the incremental growth, enterprises are heavily investing in platforms that provide deep visibility and automated protection. For instance, a financial institution implementing an open banking strategy under PSD2 regulations deploys a dedicated api security gateway to enforce strict api authentication and authorization for all third-party connections. This zero trust api security approach prevents sensitive data exposure and ensures compliance, with behavioral analytics engines monitoring for anomalous patterns indicative of credential stuffing or broken object level authorization attacks. This strategic focus on securing the data exchange layer is now a cornerstone of enterprise risk management, moving beyond simple perimeter defenses to address the granular nature of application-to-application communication.

Drivers, Trends, and Challenges in the Api Security Management Platforms Market

The growth trajectory for API security management platforms is significantly influenced by the increasing complexity of digital ecosystems and the financial repercussions of security failures. The cost of an API security breach extends beyond immediate remediation, encompassing regulatory fines, customer churn, and long-term brand damage, making proactive security a critical investment.

Organizations are evaluating unified api protection platform benefits, which consolidate discovery, testing, and runtime defense into a single console. A key development is the use of ai for api security threat detection, where machine learning models analyze traffic to identify and block sophisticated attacks in real time.

For instance, a major e-commerce platform leverages these tools for protecting apis from automated bot attacks that attempt inventory hoarding or credential stuffing, ensuring compliance with PCI DSS. Integrating api security in ci/cd pipeline is another critical focus, enabling developers to remediate vulnerabilities early. However, multi-cloud api security challenges, such as inconsistent policy enforcement and lack of visibility, persist.

The debate over api security vs web application firewall efficacy continues, though specialized platforms demonstrate superior performance in detecting logic-based attacks.

As the market evolves, understanding graphql vs rest api security issues becomes essential for tailoring defenses, while the demand for transparent api security management solutions pricing grows, especially among small and medium enterprises seeking scalable protection for assets like api security for iot devices.

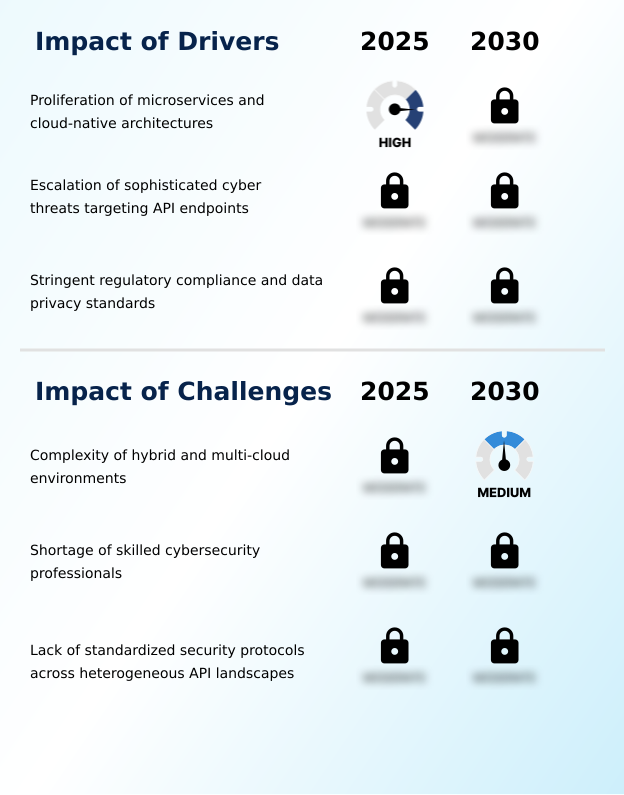
Primary Growth Driver: The rapid proliferation of microservices and cloud-native architectures is a primary market driver, expanding the digital attack surface and necessitating specialized security controls.

The market's expansion, marked by a 15.9% year-over-year growth rate, is fundamentally driven by two interconnected factors: architectural evolution and a rising threat landscape.

The widespread adoption of microservices security principles has deconstructed monolithic applications, creating thousands of new API endpoints that require specialized protection.

This explosion of interfaces necessitates robust api discovery and inventory management to identify and secure all potential entry points, including unmanaged or shadow APIs. Simultaneously, attackers are increasingly targeting vulnerabilities outlined in frameworks like the owasp api security top 10.

This requires enterprises to invest in platforms that offer advanced api threat protection and automated remediation capabilities to defend against logic-based attacks that traditional firewalls often miss.

Emerging Market Trend: The proliferation of artificial intelligence and machine learning is a defining market trend, enabling advanced capabilities in automated threat remediation and behavioral analysis.

Key market trends are converging around automation and intelligence to counter sophisticated threats. The integration of ai for api security is central to this shift, enabling platforms to move beyond static rules to proactive, behavioral-based threat detection. This is particularly crucial as organizations adopt complex microservices architectures, which are projected to drive the market's 15.9% year-over-year growth.

The consolidation of security functions into unified web application and api protection (waap) platforms is another significant development, providing a single management plane for both web and API assets. This trend simplifies operations and enhances api posture management by ensuring consistent policy application, from initial api security testing to ongoing monitoring in production environments.

Key Industry Challenge: The inherent complexity of securing and managing heterogeneous assets across hybrid and multi-cloud environments poses a significant challenge to market growth.

A primary challenge constraining market growth is the operational complexity of securing APIs across fragmented multi-cloud and hybrid environments. This heterogeneity impedes efforts to establish consistent multi-cloud api security policies and complicates api inventory management, making shadow api discovery a persistent issue.

The problem is compounded by a global shortage of skilled cybersecurity professionals with expertise in modern application architectures and logic-based threats. This talent gap makes it difficult for organizations, particularly small and medium enterprises, to manage sophisticated platforms and effectively respond to security alerts.

Without sufficient human oversight, even advanced tools for api security monitoring and api risk assessment may fail to deliver their full protective value.

Explore Full Market Dynamics Analysis Request Free Sample

Api Security Management Platforms Market Segmentation

The api security management platforms industry research report provides comprehensive data including region-wise segment analysis, with forecasts and analysis for the period 2026-2030, as well as historical data from 2020-2024 for the following segments.

Market Segment by Component
  • Solutions
  • Services
Market Segment by Deployment
  • Cloud-based
  • On-premises
  • Hybrid
Market Segment by End-user
  • Large enterprises
  • Small and medium enterprises
Market Segment by Geography
North America
US, Canada, Mexico
APAC
China, India, Japan, South Korea, Australia, Indonesia
Europe
Germany, UK, France, The Netherlands, Italy, Spain
Middle East and Africa
Saudi Arabia, UAE, South Africa, Israel, Turkey
South America
Brazil, Argentina, Colombia

Component Segment Analysis

The solutions segment is estimated to witness significant growth during the forecast period.

The market is segmented by component, deployment, end-user, and geography. The solutions segment, which is projected to grow from a 2024 value of USD 976.9 million, represents the core of the market, providing the technological tools for api threat protection.

These platforms deliver essential capabilities such as automated api security, real-time monitoring, and robust api governance frameworks. As organizations expand their digital footprint, the demand for comprehensive solutions that offer runtime api security and effective api data protection intensifies.

These systems are critical for identifying vulnerabilities highlighted by standards like the owasp api security top 10 and ensuring secure data exchange across distributed architectures, making them a foundational investment for enterprise cybersecurity.

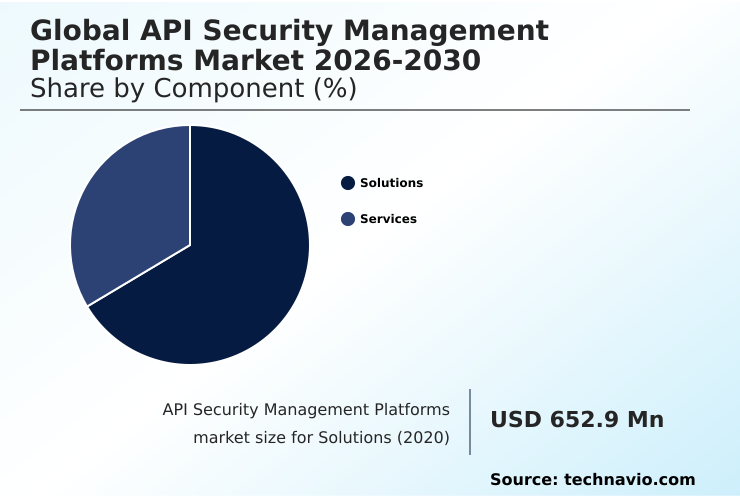
The Solutions segment was valued at USD 976.9 million in 2024 and showed a gradual increase during the forecast period.

Api Security Management Platforms Market by Region: North America Leads with 36.1% Growth Share

North America is estimated to contribute 36.1% to the growth of the global market during the forecast period.

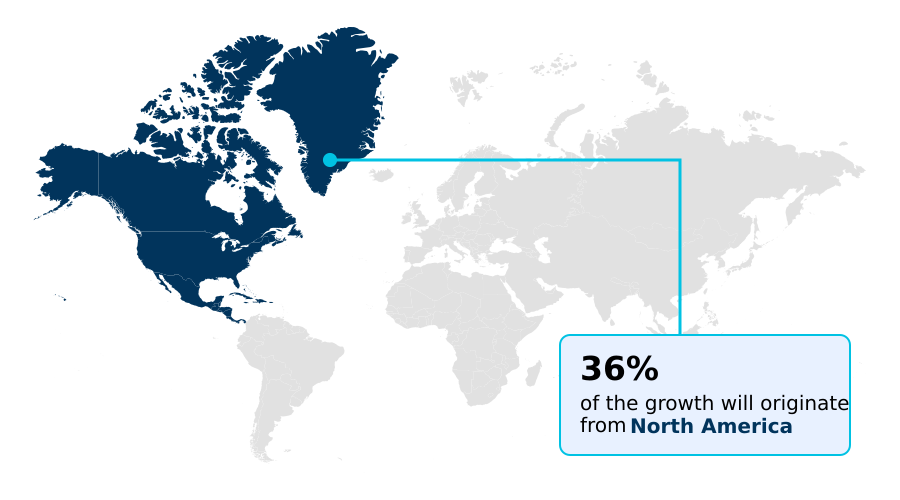
The geographic landscape is led by North America, which accounts for approximately 36.1% of the market's incremental growth, driven by a high concentration of technology firms and stringent data privacy regulations.

Concurrently, the APAC region is forecast to expand at the fastest rate, with a CAGR of 17.9%, fueled by rapid digitalization in countries like India and China.

In Europe, adoption is strongly influenced by mandates such as the gdpr api compliance requirements, compelling organizations to implement rigorous api access control and data protection measures.

The global distribution of cloud infrastructure further necessitates cloud native api security solutions that can enforce consistent policies across jurisdictions. This regional divergence creates a complex but opportunity-rich environment for vendors.

Customer Landscape Analysis for the Api Security Management Platforms Market

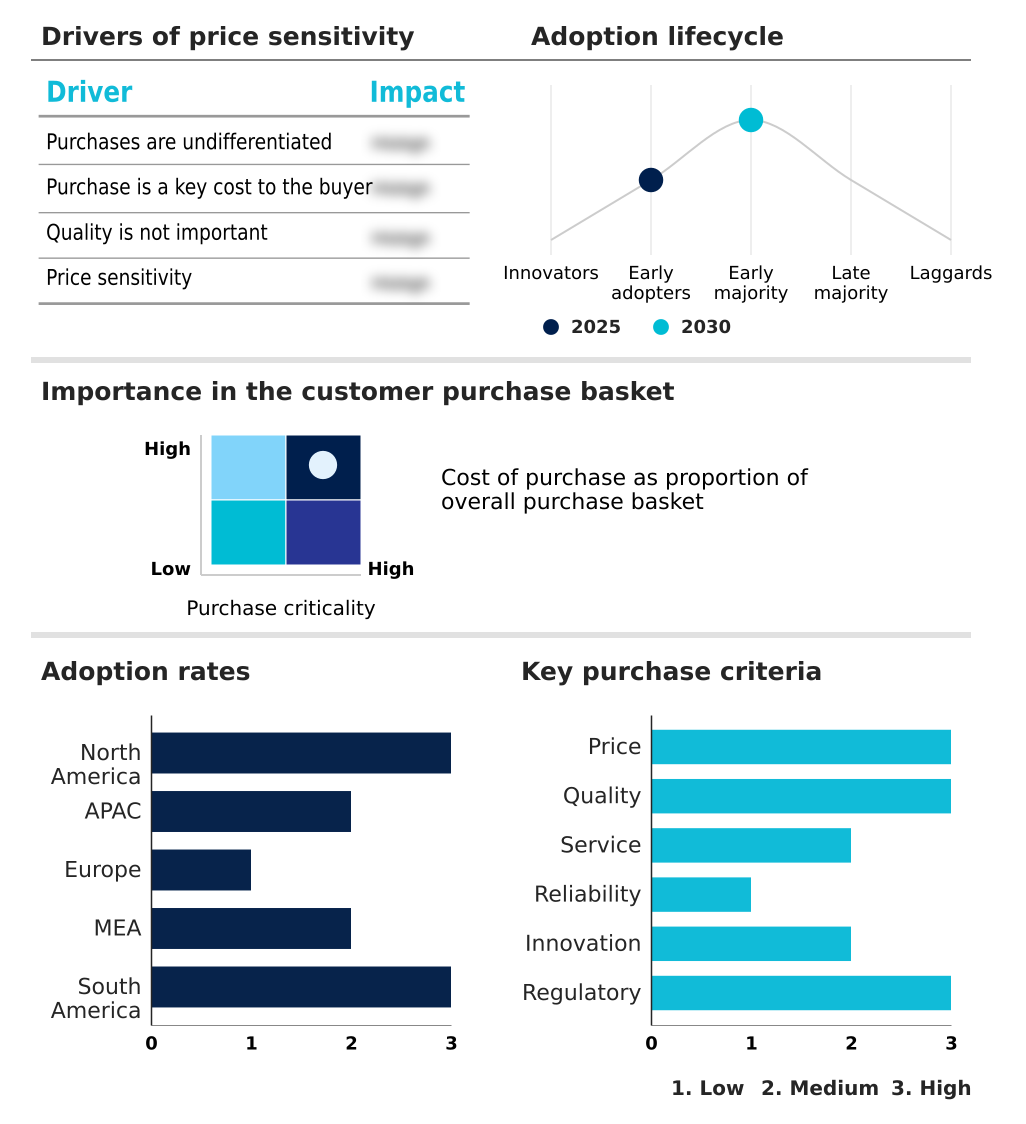
The api security management platforms market forecasting report includes the adoption lifecycle of the market, covering from the innovator’s stage to the laggard’s stage. It focuses on adoption rates in different regions based on penetration. Furthermore, the api security management platforms market report also includes key purchase criteria and drivers of price sensitivity to help companies evaluate and develop their market growth analysis strategies.

Competitive Landscape of the Api Security Management Platforms Market

Companies are implementing various strategies, such as strategic alliances, partnerships, mergers and acquisitions, geographical expansion, and product/service launches, to enhance their presence in the api security management platforms market industry.

42Crunch Ltd - Offerings include high-performance application delivery controllers with integrated endpoint protection and traffic analysis, designed to secure and manage modern distributed architectures.

The industry research and growth report includes detailed analyses of the competitive landscape of the market and information about key companies, including:

  • 42Crunch Ltd
  • A10 Networks Inc.
  • Akamai Technologies Inc.
  • Amazon.com Inc.
  • Axway Software SA
  • Broadcom Inc.
  • Cequence Security Inc.
  • Check Point Software Tech Ltd.
  • Cloudflare Inc.
  • Data Theorem Inc.
  • F5 Inc.
  • Google LLC
  • Kong Inc
  • Microsoft Corp.
  • Palo Alto Networks Inc.
  • Salesforce Inc.
  • Salt Security
  • Thales Group
  • Traceable AI
  • Wallarm Inc

Qualitative and quantitative analysis of companies has been conducted to help clients understand the wider business environment as well as the strengths and weaknesses of key industry players. Data is qualitatively analyzed to categorize companies as pure play, category-focused, industry-focused, and diversified; it is quantitatively analyzed to categorize companies as dominant, leading, strong, tentative, and weak.

Recent Developments in the Api Security Management Platforms Market

  • In May 2025, Cequence Security Inc. announced strategic partnerships with Skyfire and Inspira to enhance agentic AI security, strengthen bot defense capabilities, and improve protection against API-based threats.
  • In April 2025, 42Crunch Ltd. released an update to its platform, deepening integrations with popular CI/CD tools to automate API contract security testing earlier in the development lifecycle, addressing the growing 'shift-left' security trend.
  • In February 2025, the International Standards Organization published revised protocols for autonomous API authentication, establishing a new global benchmark to address threats like broken object level authorization and credential stuffing.
  • In November 2024, F5 Inc. expanded its F5 Distributed Cloud Services to include advanced API discovery and posture management, providing organizations with unified visibility into both documented and shadow APIs across hybrid environments.

Research Analyst Overview: Api Security Management Platforms Market

The operational imperative to secure digital supply chains is driving significant investment in API security management platforms. A primary factor is the architectural shift to distributed systems, where the proliferation of interfaces mandates robust api governance and automated api security.

Boardroom decisions on cybersecurity budgets are now directly linked to the need for advanced api threat protection and compliance with regulations like GDPR. Solutions are a dominant market component, reflecting the demand for tools that manage the entire secure api lifecycle management, from api discovery and api security testing in pre-production to runtime api security in live environments.

Enterprises are prioritizing platforms that address the owasp api security top 10, particularly vulnerabilities like broken object level authorization (bola) and sensitive data exposure prevention. The adoption of web application and api protection (waap) unifies defenses, while technologies such as behavioral api security and zero trust api security provide granular api access control.

Effective api inventory management and api posture management are becoming standard practice, with api encryption and api rate limiting serving as foundational controls.

Dive into Technavio’s robust research methodology, blending expert interviews, extensive data synthesis, and validated models for unparalleled Api Security Management Platforms Market insights. See full methodology.

Request Free Sample

Market Scope
Page number 289
Base year 2025
Historic period 2020-2024
Forecast period 2026-2030
Growth momentum & CAGR Accelerate at a CAGR of 16.7%
Market growth 2026-2030 USD 2022.5 million
Market structure Fragmented
YoY growth 2025-2026(%) 15.9%
Key countries US, Canada, Mexico, China, India, Japan, South Korea, Australia, Indonesia, Germany, UK, France, The Netherlands, Italy, Spain, Saudi Arabia, UAE, South Africa, Israel, Turkey, Brazil, Argentina and Colombia
Competitive landscape Leading Companies, Market Positioning of Companies, Competitive Strategies, and Industry Risks

Api Security Management Platforms Market: Key Questions Answered in This Report

  • What is the expected growth of the Api Security Management Platforms Market between 2026 and 2030?

    • The Api Security Management Platforms Market is expected to grow by USD 2.02 billion during 2026-2030, registering a CAGR of 16.7%. Year-over-year growth in 2026 is estimated at 15.9%%. This acceleration is shaped by proliferation of microservices and cloud-native architectures, which is intensifying demand across multiple end-use verticals covered in the report.

  • What segmentation does the market report cover?

    • The report is segmented by Component (Solutions, and Services), Deployment (Cloud-based, On-premises, and Hybrid), End-user (Large enterprises, and Small and medium enterprises) and Geography (North America, APAC, Europe, Middle East and Africa, South America). Among these, the Solutions segment is estimated to witness significant growth during the forecast period, driven by rising adoption across key application areas. Each segment includes detailed qualitative and quantitative analysis, along with historical data from 2020-2024 and forecasts through 2030 with year-over-year growth rates.

  • Which regions are analyzed in the report?

    • The report covers North America, APAC, Europe, Middle East and Africa and South America. North America is estimated to contribute 36.1% to market growth during the forecast period. Country-level analysis includes US, Canada, Mexico, China, India, Japan, South Korea, Australia, Indonesia, Germany, UK, France, The Netherlands, Italy, Spain, Saudi Arabia, UAE, South Africa, Israel, Turkey, Brazil, Argentina and Colombia, with dedicated market size tables and year-over-year growth for each.

  • What are the key growth drivers and market challenges?

    • The primary driver is proliferation of microservices and cloud-native architectures, which is accelerating investment and industry demand. The main challenge is complexity of hybrid and multi-cloud environments, creating operational barriers for key market participants. The report quantifies the impact of each driver and challenge across 2026 and 2030 with comparative analysis.

  • Who are the major players in the Api Security Management Platforms Market?

    • Key vendors include 42Crunch Ltd, A10 Networks Inc., Akamai Technologies Inc., Amazon.com Inc., Axway Software SA, Broadcom Inc., Cequence Security Inc., Check Point Software Tech Ltd., Cloudflare Inc., Data Theorem Inc., F5 Inc., Google LLC, Kong Inc, Microsoft Corp., Palo Alto Networks Inc., Salesforce Inc., Salt Security, Thales Group, Traceable AI and Wallarm Inc. The report provides qualitative and quantitative analysis categorizing companies as dominant, leading, strong, tentative, and weak based on their market positioning. Company profiles include business segment analysis, SWOT assessment, key offerings, and recent strategic developments.

Api Security Management Platforms Market Research Insights

Market dynamics are shaped by the aggressive adoption of cloud-native architectures, where the cloud-based deployment segment outpaces on-premises growth due to its scalability and lower upfront costs. This shift is particularly evident in regulated industries requiring strong api security for financial services and healthcare.

Procurement decisions are increasingly influenced by regulatory frameworks like the gdpr api compliance mandates in Europe, which necessitate robust data protection controls. Consequently, platforms that facilitate open banking api security and automate compliance are gaining prominence.

Decision-makers are prioritizing solutions that offer not only advanced threat detection but also comprehensive visibility for api security audit and risk assessment, ensuring resilience across an expanding and complex digital ecosystem.

We can help! Our analysts can customize this api security management platforms market research report to meet your requirements.

Get in touch

1. Executive Summary

1.1 Market overview

Executive Summary - Chart on Market Overview
Executive Summary - Data Table on Market Overview
Executive Summary - Chart on Global Market Characteristics
Executive Summary - Chart on Market by Geography
Executive Summary - Chart on Market Segmentation by Component
Executive Summary - Chart on Market Segmentation by Deployment
Executive Summary - Chart on Market Segmentation by End-user
Executive Summary - Chart on Incremental Growth
Executive Summary - Data Table on Incremental Growth
Executive Summary - Chart on Company Market Positioning

2. Technavio Analysis

2.1 Analysis of price sensitivity, lifecycle, customer purchase basket, adoption rates, and purchase criteria

2.2 Criticality of inputs and Factors of differentiation

Chart on Overview on criticality of inputs and factors of differentiation

2.3 Factors of disruption

Chart on Overview on factors of disruption

2.4 Impact of drivers and challenges

Chart on Impact of drivers and challenges in 2025 and 2030

3. Market Landscape

3.1 Market ecosystem

Chart on Parent Market
Data Table on - Parent Market

3.2 Market characteristics

Chart on Market characteristics analysis

3.3 Value chain analysis

Chart on Value chain analysis

4. Market Sizing

4.1 Market definition

Data Table on Offerings of companies included in the market definition

4.2 Market segment analysis

Market segments

4.3 Market size 2025

4.4 Market outlook: Forecast for 2025-2030

Chart on Global - Market size and forecast 2025-2030 ($ million)
Data Table on Global - Market size and forecast 2025-2030 ($ million)
Chart on Global Market: Year-over-year growth 2025-2030 (%)
Data Table on Global Market: Year-over-year growth 2025-2030 (%)

5. Historic Market Size

5.1 Global API Security Management Platforms Market 2020 - 2024

Historic Market Size - Data Table on Global API Security Management Platforms Market 2020 - 2024 ($ million)

5.2 Component segment analysis 2020 - 2024

Historic Market Size - Component Segment 2020 - 2024 ($ million)

5.3 Deployment segment analysis 2020 - 2024

Historic Market Size - Deployment Segment 2020 - 2024 ($ million)

5.4 End-user segment analysis 2020 - 2024

Historic Market Size - End-user Segment 2020 - 2024 ($ million)

5.5 Geography segment analysis 2020 - 2024

Historic Market Size - Geography Segment 2020 - 2024 ($ million)

5.6 Country segment analysis 2020 - 2024

Historic Market Size - Country Segment 2020 - 2024 ($ million)

6. Qualitative Analysis

6.1 Impact of AI on Global API Security Management Platforms Market

7. Five Forces Analysis

7.1 Five forces summary

Five forces analysis - Comparison between 2025 and 2030

7.2 Bargaining power of buyers

Bargaining power of buyers - Impact of key factors 2025 and 2030

7.3 Bargaining power of suppliers

Bargaining power of suppliers - Impact of key factors in 2025 and 2030

7.4 Threat of new entrants

Threat of new entrants - Impact of key factors in 2025 and 2030

7.5 Threat of substitutes

Threat of substitutes - Impact of key factors in 2025 and 2030

7.6 Threat of rivalry

Threat of rivalry - Impact of key factors in 2025 and 2030

7.7 Market condition

Chart on Market condition - Five forces 2025 and 2030

8. Market Segmentation by Component

8.1 Market segments

Chart on Component - Market share 2025-2030 (%)
Data Table on Component - Market share 2025-2030 (%)

8.2 Comparison by Component

Chart on Comparison by Component
Data Table on Comparison by Component

8.3 Solutions - Market size and forecast 2025-2030

Chart on Solutions - Market size and forecast 2025-2030 ($ million)
Data Table on Solutions - Market size and forecast 2025-2030 ($ million)
Chart on Solutions - Year-over-year growth 2025-2030 (%)
Data Table on Solutions - Year-over-year growth 2025-2030 (%)

8.4 Services - Market size and forecast 2025-2030

Chart on Services - Market size and forecast 2025-2030 ($ million)
Data Table on Services - Market size and forecast 2025-2030 ($ million)
Chart on Services - Year-over-year growth 2025-2030 (%)
Data Table on Services - Year-over-year growth 2025-2030 (%)

8.5 Market opportunity by Component

Market opportunity by Component ($ million)
Data Table on Market opportunity by Component ($ million)

9. Market Segmentation by Deployment

9.1 Market segments

Chart on Deployment - Market share 2025-2030 (%)
Data Table on Deployment - Market share 2025-2030 (%)

9.2 Comparison by Deployment

Chart on Comparison by Deployment
Data Table on Comparison by Deployment

9.3 Cloud-based - Market size and forecast 2025-2030

Chart on Cloud-based - Market size and forecast 2025-2030 ($ million)
Data Table on Cloud-based - Market size and forecast 2025-2030 ($ million)
Chart on Cloud-based - Year-over-year growth 2025-2030 (%)
Data Table on Cloud-based - Year-over-year growth 2025-2030 (%)

9.4 On-premises - Market size and forecast 2025-2030

Chart on On-premises - Market size and forecast 2025-2030 ($ million)
Data Table on On-premises - Market size and forecast 2025-2030 ($ million)
Chart on On-premises - Year-over-year growth 2025-2030 (%)
Data Table on On-premises - Year-over-year growth 2025-2030 (%)

9.5 Hybrid - Market size and forecast 2025-2030

Chart on Hybrid - Market size and forecast 2025-2030 ($ million)
Data Table on Hybrid - Market size and forecast 2025-2030 ($ million)
Chart on Hybrid - Year-over-year growth 2025-2030 (%)
Data Table on Hybrid - Year-over-year growth 2025-2030 (%)

9.6 Market opportunity by Deployment

Market opportunity by Deployment ($ million)
Data Table on Market opportunity by Deployment ($ million)

10. Market Segmentation by End-user

10.1 Market segments

Chart on End-user - Market share 2025-2030 (%)
Data Table on End-user - Market share 2025-2030 (%)

10.2 Comparison by End-user

Chart on Comparison by End-user
Data Table on Comparison by End-user

10.3 Large enterprises - Market size and forecast 2025-2030

Chart on Large enterprises - Market size and forecast 2025-2030 ($ million)
Data Table on Large enterprises - Market size and forecast 2025-2030 ($ million)
Chart on Large enterprises - Year-over-year growth 2025-2030 (%)
Data Table on Large enterprises - Year-over-year growth 2025-2030 (%)

10.4 Small and medium enterprises - Market size and forecast 2025-2030

Chart on Small and medium enterprises - Market size and forecast 2025-2030 ($ million)
Data Table on Small and medium enterprises - Market size and forecast 2025-2030 ($ million)
Chart on Small and medium enterprises - Year-over-year growth 2025-2030 (%)
Data Table on Small and medium enterprises - Year-over-year growth 2025-2030 (%)

10.5 Market opportunity by End-user

Market opportunity by End-user ($ million)
Data Table on Market opportunity by End-user ($ million)

11. Customer Landscape

11.1 Customer landscape overview

Analysis of price sensitivity, lifecycle, customer purchase basket, adoption rates, and purchase criteria

12. Geographic Landscape

12.1 Geographic segmentation

Chart on Market share by geography 2025-2030 (%)
Data Table on Market share by geography 2025-2030 (%)

12.2 Geographic comparison

Chart on Geographic comparison
Data Table on Geographic comparison

12.3 North America - Market size and forecast 2025-2030

Chart on North America - Market size and forecast 2025-2030 ($ million)
Data Table on North America - Market size and forecast 2025-2030 ($ million)
Chart on North America - Year-over-year growth 2025-2030 (%)
Data Table on North America - Year-over-year growth 2025-2030 (%)
Chart on Regional Comparison - North America
Data Table on Regional Comparison - North America

12.3.1 US - Market size and forecast 2025-2030

Chart on US - Market size and forecast 2025-2030 ($ million)
Data Table on US - Market size and forecast 2025-2030 ($ million)
Chart on US - Year-over-year growth 2025-2030 (%)
Data Table on US - Year-over-year growth 2025-2030 (%)

12.3.2 Canada - Market size and forecast 2025-2030

Chart on Canada - Market size and forecast 2025-2030 ($ million)
Data Table on Canada - Market size and forecast 2025-2030 ($ million)
Chart on Canada - Year-over-year growth 2025-2030 (%)
Data Table on Canada - Year-over-year growth 2025-2030 (%)

12.3.3 Mexico - Market size and forecast 2025-2030

Chart on Mexico - Market size and forecast 2025-2030 ($ million)
Data Table on Mexico - Market size and forecast 2025-2030 ($ million)
Chart on Mexico - Year-over-year growth 2025-2030 (%)
Data Table on Mexico - Year-over-year growth 2025-2030 (%)

12.4 APAC - Market size and forecast 2025-2030

Chart on APAC - Market size and forecast 2025-2030 ($ million)
Data Table on APAC - Market size and forecast 2025-2030 ($ million)
Chart on APAC - Year-over-year growth 2025-2030 (%)
Data Table on APAC - Year-over-year growth 2025-2030 (%)
Chart on Regional Comparison - APAC
Data Table on Regional Comparison - APAC

12.4.1 China - Market size and forecast 2025-2030

Chart on China - Market size and forecast 2025-2030 ($ million)
Data Table on China - Market size and forecast 2025-2030 ($ million)
Chart on China - Year-over-year growth 2025-2030 (%)
Data Table on China - Year-over-year growth 2025-2030 (%)

12.4.2 India - Market size and forecast 2025-2030

Chart on India - Market size and forecast 2025-2030 ($ million)
Data Table on India - Market size and forecast 2025-2030 ($ million)
Chart on India - Year-over-year growth 2025-2030 (%)
Data Table on India - Year-over-year growth 2025-2030 (%)

12.4.3 Japan - Market size and forecast 2025-2030

Chart on Japan - Market size and forecast 2025-2030 ($ million)
Data Table on Japan - Market size and forecast 2025-2030 ($ million)
Chart on Japan - Year-over-year growth 2025-2030 (%)
Data Table on Japan - Year-over-year growth 2025-2030 (%)

12.4.4 South Korea - Market size and forecast 2025-2030

Chart on South Korea - Market size and forecast 2025-2030 ($ million)
Data Table on South Korea - Market size and forecast 2025-2030 ($ million)
Chart on South Korea - Year-over-year growth 2025-2030 (%)
Data Table on South Korea - Year-over-year growth 2025-2030 (%)

12.4.5 Australia - Market size and forecast 2025-2030

Chart on Australia - Market size and forecast 2025-2030 ($ million)
Data Table on Australia - Market size and forecast 2025-2030 ($ million)
Chart on Australia - Year-over-year growth 2025-2030 (%)
Data Table on Australia - Year-over-year growth 2025-2030 (%)

12.4.6 Indonesia - Market size and forecast 2025-2030

Chart on Indonesia - Market size and forecast 2025-2030 ($ million)
Data Table on Indonesia - Market size and forecast 2025-2030 ($ million)
Chart on Indonesia - Year-over-year growth 2025-2030 (%)
Data Table on Indonesia - Year-over-year growth 2025-2030 (%)

12.5 Europe - Market size and forecast 2025-2030

Chart on Europe - Market size and forecast 2025-2030 ($ million)
Data Table on Europe - Market size and forecast 2025-2030 ($ million)
Chart on Europe - Year-over-year growth 2025-2030 (%)
Data Table on Europe - Year-over-year growth 2025-2030 (%)
Chart on Regional Comparison - Europe
Data Table on Regional Comparison - Europe

12.5.1 Germany - Market size and forecast 2025-2030

Chart on Germany - Market size and forecast 2025-2030 ($ million)
Data Table on Germany - Market size and forecast 2025-2030 ($ million)
Chart on Germany - Year-over-year growth 2025-2030 (%)
Data Table on Germany - Year-over-year growth 2025-2030 (%)

12.5.2 UK - Market size and forecast 2025-2030

Chart on UK - Market size and forecast 2025-2030 ($ million)
Data Table on UK - Market size and forecast 2025-2030 ($ million)
Chart on UK - Year-over-year growth 2025-2030 (%)
Data Table on UK - Year-over-year growth 2025-2030 (%)

12.5.3 France - Market size and forecast 2025-2030

Chart on France - Market size and forecast 2025-2030 ($ million)
Data Table on France - Market size and forecast 2025-2030 ($ million)
Chart on France - Year-over-year growth 2025-2030 (%)
Data Table on France - Year-over-year growth 2025-2030 (%)

12.5.4 The Netherlands - Market size and forecast 2025-2030

Chart on The Netherlands - Market size and forecast 2025-2030 ($ million)
Data Table on The Netherlands - Market size and forecast 2025-2030 ($ million)
Chart on The Netherlands - Year-over-year growth 2025-2030 (%)
Data Table on The Netherlands - Year-over-year growth 2025-2030 (%)

12.5.5 Italy - Market size and forecast 2025-2030

Chart on Italy - Market size and forecast 2025-2030 ($ million)
Data Table on Italy - Market size and forecast 2025-2030 ($ million)
Chart on Italy - Year-over-year growth 2025-2030 (%)
Data Table on Italy - Year-over-year growth 2025-2030 (%)

12.5.6 Spain - Market size and forecast 2025-2030

Chart on Spain - Market size and forecast 2025-2030 ($ million)
Data Table on Spain - Market size and forecast 2025-2030 ($ million)
Chart on Spain - Year-over-year growth 2025-2030 (%)
Data Table on Spain - Year-over-year growth 2025-2030 (%)

12.6 Middle East and Africa - Market size and forecast 2025-2030

Chart on Middle East and Africa - Market size and forecast 2025-2030 ($ million)
Data Table on Middle East and Africa - Market size and forecast 2025-2030 ($ million)
Chart on Middle East and Africa - Year-over-year growth 2025-2030 (%)
Data Table on Middle East and Africa - Year-over-year growth 2025-2030 (%)
Chart on Regional Comparison - Middle East and Africa
Data Table on Regional Comparison - Middle East and Africa

12.6.1 Saudi Arabia - Market size and forecast 2025-2030

Chart on Saudi Arabia - Market size and forecast 2025-2030 ($ million)
Data Table on Saudi Arabia - Market size and forecast 2025-2030 ($ million)
Chart on Saudi Arabia - Year-over-year growth 2025-2030 (%)
Data Table on Saudi Arabia - Year-over-year growth 2025-2030 (%)

12.6.2 UAE - Market size and forecast 2025-2030

Chart on UAE - Market size and forecast 2025-2030 ($ million)
Data Table on UAE - Market size and forecast 2025-2030 ($ million)
Chart on UAE - Year-over-year growth 2025-2030 (%)
Data Table on UAE - Year-over-year growth 2025-2030 (%)

12.6.3 South Africa - Market size and forecast 2025-2030

Chart on South Africa - Market size and forecast 2025-2030 ($ million)
Data Table on South Africa - Market size and forecast 2025-2030 ($ million)
Chart on South Africa - Year-over-year growth 2025-2030 (%)
Data Table on South Africa - Year-over-year growth 2025-2030 (%)

12.6.4 Israel - Market size and forecast 2025-2030

Chart on Israel - Market size and forecast 2025-2030 ($ million)
Data Table on Israel - Market size and forecast 2025-2030 ($ million)
Chart on Israel - Year-over-year growth 2025-2030 (%)
Data Table on Israel - Year-over-year growth 2025-2030 (%)

12.6.5 Turkey - Market size and forecast 2025-2030

Chart on Turkey - Market size and forecast 2025-2030 ($ million)
Data Table on Turkey - Market size and forecast 2025-2030 ($ million)
Chart on Turkey - Year-over-year growth 2025-2030 (%)
Data Table on Turkey - Year-over-year growth 2025-2030 (%)

12.7 South America - Market size and forecast 2025-2030

Chart on South America - Market size and forecast 2025-2030 ($ million)
Data Table on South America - Market size and forecast 2025-2030 ($ million)
Chart on South America - Year-over-year growth 2025-2030 (%)
Data Table on South America - Year-over-year growth 2025-2030 (%)
Chart on Regional Comparison - South America
Data Table on Regional Comparison - South America

12.7.1 Brazil - Market size and forecast 2025-2030

Chart on Brazil - Market size and forecast 2025-2030 ($ million)
Data Table on Brazil - Market size and forecast 2025-2030 ($ million)
Chart on Brazil - Year-over-year growth 2025-2030 (%)
Data Table on Brazil - Year-over-year growth 2025-2030 (%)

12.7.2 Argentina - Market size and forecast 2025-2030

Chart on Argentina - Market size and forecast 2025-2030 ($ million)
Data Table on Argentina - Market size and forecast 2025-2030 ($ million)
Chart on Argentina - Year-over-year growth 2025-2030 (%)
Data Table on Argentina - Year-over-year growth 2025-2030 (%)

12.7.3 Colombia - Market size and forecast 2025-2030

Chart on Colombia - Market size and forecast 2025-2030 ($ million)
Data Table on Colombia - Market size and forecast 2025-2030 ($ million)
Chart on Colombia - Year-over-year growth 2025-2030 (%)
Data Table on Colombia - Year-over-year growth 2025-2030 (%)

12.8 Market opportunity by geography

Market opportunity by geography ($ million)
Data Tables on Market opportunity by geography ($ million)

13. Drivers, Challenges, and Opportunity

13.1 Market drivers

Proliferation of microservices and cloud-native architectures
Escalation of sophisticated cyber threats targeting API endpoints
Stringent regulatory compliance and data privacy standards

13.2 Market challenges

Complexity of hybrid and multi-cloud environments
Shortage of skilled cybersecurity professionals
Lack of standardized security protocols across heterogeneous API landscapes

13.3 Impact of drivers and challenges

Impact of drivers and challenges in 2025 and 2030

13.4 Market opportunities

Proliferation of AI and machine learning in automated threat remediation
Integration of web application and API protection (WAAP) strategies
Advancement of shift-left security and lifecycle management within DevOps pipelines

14. Competitive Landscape

14.1 Overview

14.2

Overview on criticality of inputs and factors of differentiation

14.3 Landscape disruption

Overview on factors of disruption

14.4 Industry risks

Impact of key risks on business

15. Competitive Analysis

15.1 Companies profiled

Companies covered

15.2 Company ranking index

15.3 Market positioning of companies

Matrix on companies position and classification

15.4 A10 Networks Inc.

A10 Networks Inc. - Overview
A10 Networks Inc. - Product / Service
A10 Networks Inc. - Key offerings
SWOT

15.5 Akamai Technologies Inc.

Akamai Technologies Inc. - Overview
Akamai Technologies Inc. - Business segments
Akamai Technologies Inc. - Key news
Akamai Technologies Inc. - Key offerings
Akamai Technologies Inc. - Segment focus
SWOT

15.6 Amazon.com Inc.

Amazon.com Inc. - Overview
Amazon.com Inc. - Business segments
Amazon.com Inc. - Key news
Amazon.com Inc. - Key offerings
Amazon.com Inc. - Segment focus
SWOT

15.7 Broadcom Inc.

Broadcom Inc. - Overview
Broadcom Inc. - Business segments
Broadcom Inc. - Key offerings
Broadcom Inc. - Segment focus
SWOT

15.8 Cequence Security Inc.

Cequence Security Inc. - Overview
Cequence Security Inc. - Product / Service
Cequence Security Inc. - Key offerings
SWOT

15.9 Check Point Software Tech Ltd.

Check Point Software Tech Ltd. - Overview
Check Point Software Tech Ltd. - Product / Service
Check Point Software Tech Ltd. - Key offerings
SWOT

15.10 Cloudflare Inc.

Cloudflare Inc. - Overview
Cloudflare Inc. - Product / Service
Cloudflare Inc. - Key offerings
SWOT

15.11 Data Theorem Inc.

Data Theorem Inc. - Overview
Data Theorem Inc. - Product / Service
Data Theorem Inc. - Key offerings
SWOT

15.12 F5 Inc.

F5 Inc. - Overview
F5 Inc. - Product / Service
F5 Inc. - Key news
F5 Inc. - Key offerings
SWOT

15.13 Microsoft Corp.

Microsoft Corp. - Overview
Microsoft Corp. - Business segments
Microsoft Corp. - Key news
Microsoft Corp. - Key offerings
Microsoft Corp. - Segment focus
SWOT

15.14 Palo Alto Networks Inc.

Palo Alto Networks Inc. - Overview
Palo Alto Networks Inc. - Business segments
Palo Alto Networks Inc. - Key offerings
Palo Alto Networks Inc. - Segment focus
SWOT

15.15 Salesforce Inc.

Salesforce Inc. - Overview
Salesforce Inc. - Business segments
Salesforce Inc. - Key news
Salesforce Inc. - Key offerings
Salesforce Inc. - Segment focus
SWOT

15.16 Salt Security

Salt Security - Overview
Salt Security - Product / Service
Salt Security - Key offerings
SWOT

15.17 Thales Group

Thales Group - Overview
Thales Group - Business segments
Thales Group - Key offerings
Thales Group - Segment focus
SWOT

15.18 Traceable AI

Traceable AI - Overview
Traceable AI - Product / Service
Traceable AI - Key offerings
SWOT

16. Appendix

16.1 Scope of the report

Market definition
Objectives
Notes and caveats

16.2 Inclusions and exclusions checklist

Inclusions checklist
Exclusions checklist

16.3 Currency conversion rates for US$

16.4 Research methodology

16.5 Data procurement

Information sources

16.6 Data validation

16.7 Validation techniques employed for market sizing

16.8 Data synthesis

16.9 360 degree market analysis

16.10 List of abbreviations

Research Methodology

Technavio presents a detailed picture of the market by way of study, synthesis, and summation of data from multiple sources. The analysts have presented the various facets of the market with a particular focus on identifying the key industry influencers. The data thus presented is comprehensive, reliable, and the result of extensive research, both primary and secondary.

INFORMATION SOURCES

Primary sources

  • Manufacturers and suppliers
  • Channel partners
  • Industry experts
  • Strategic decision makers

Secondary sources

  • Industry journals and periodicals
  • Government data
  • Financial reports of key industry players
  • Historical data
  • Press releases

DATA ANALYSIS

Data Synthesis

  • Collation of data
  • Estimation of key figures
  • Analysis of derived insights

Data Validation

  • Triangulation with data models
  • Reference against proprietary databases
  • Corroboration with industry experts

REPORT WRITING

Qualitative

  • Market drivers
  • Market challenges
  • Market trends
  • Five forces analysis

Quantitative

  • Market size and forecast
  • Market segmentation
  • Geographical insights
  • Competitive landscape

Interested in this report?

Get your sample now to see our research methodology and insights!

Download Now

Frequently Asked Questions

Api Security Management Platforms market growth will increase by USD 2022.5 million during 2026-2030.

The Api Security Management Platforms market is expected to grow at a CAGR of 16.7% during 2026-2030.

Api Security Management Platforms market is segmented by Component (Solutions, Services) Deployment (Cloud-based, On-premises, Hybrid) End-user (Large enterprises, Small and medium enterprises)

42Crunch Ltd, A10 Networks Inc., Akamai Technologies Inc., Amazon.com Inc., Axway Software SA, Broadcom Inc., Cequence Security Inc., Check Point Software Tech Ltd., Cloudflare Inc., Data Theorem Inc., F5 Inc., Google LLC, Kong Inc, Microsoft Corp., Palo Alto Networks Inc., Salesforce Inc., Salt Security, Thales Group, Traceable AI, Wallarm Inc are a few of the key vendors in the Api Security Management Platforms market.

North America will register the highest growth rate of 36.1% among the other regions. Therefore, the Api Security Management Platforms market in North America is expected to garner significant business opportunities for the vendors during the forecast period.

US, Canada, Mexico, China, India, Japan, South Korea, Australia, Indonesia, Germany, UK, France, The Netherlands, Italy, Spain, Saudi Arabia, UAE, South Africa, Israel, Turkey, Brazil, Argentina, Colombia

  • Proliferation of microservices and cloud-native architectures is the driving factor this market.

The Api Security Management Platforms market vendors should focus on grabbing business opportunities from the Component segment as it accounted for the largest market share in the base year.
RIA - Research AI Assistant
Ask RIA