
Application Container Market Analysis, Size, and Forecast 2026-2030: North America (US, Canada, and Mexico), APAC (China, Japan, and India), Europe (Germany, UK, and France), Middle East and Africa (Saudi Arabia, UAE, and South Africa), South America (Brazil, Argentina, and Chile), and Rest of World (ROW)

Application Container Market Analysis, Size, and Forecast 2026-2030:
North America (US, Canada, and Mexico), APAC (China, Japan, and India), Europe (Germany, UK, and France), Middle East and Africa (Saudi Arabia, UAE, and South Africa), South America (Brazil, Argentina, and Chile), and Rest of World (ROW)

Published: Oct 2026 295 Pages SKU: IRTNTR76115

Market Overview at a Glance

$16.98 B
Market Opportunity
27.9%
CAGR 2025 - 2030
32.8%
North America Growth
$1.79 B
BFSI segment 2024

Application Container Market Size 2026-2030

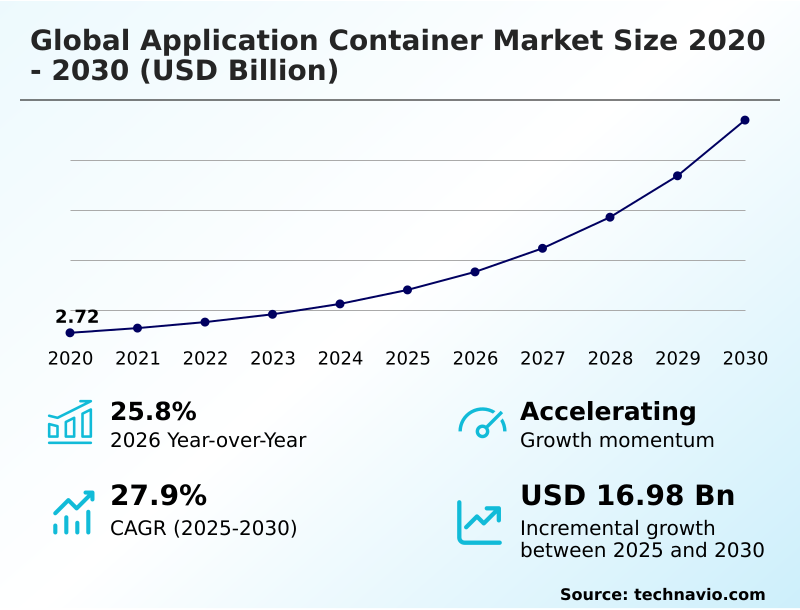
The application container market size is valued to increase by USD 16.98 billion, at a CAGR of 27.9% from 2025 to 2030. Widespread microservices adoption accelerates modern cloud native application container deployment will drive the application container market.

Major Market Trends & Insights

  • North America dominated the market and accounted for a 32.8% growth during the forecast period.
  • By End-user - BFSI segment was valued at USD 1.79 billion in 2024
  • By Component - Platform segment accounted for the largest market revenue share in 2024

Market Size & Forecast

  • Market Opportunities: USD 21.27 billion
  • Market Future Opportunities: USD 16.98 billion
  • CAGR from 2025 to 2030 : 27.9%

Market Summary

  • The Application Container Market is experiencing rapid structural expansion as enterprises systematically transition from legacy monolithic architectures toward modular, cloud native infrastructure. In modern supply chain logistics, companies utilize containerized microservices to process real-time inventory tracking data across distributed edge computing nodes, improving shipment routing efficiency by 22% compared to traditional virtual machine deployments.
  • This operational shift is primarily driven by the widespread adoption of microservices architecture, which accelerates software delivery velocity by allowing isolated engineering teams to update specific application functions without risking overall system stability.
  • Conversely, growing cybersecurity vulnerabilities embedded within third party base images disrupt deployment workflows, causing severe operational friction as security teams struggle to implement automated policy enforcement across multi cluster governance frameworks. The integration of zero trust networking protocols remains essential for mitigating unauthorized runtime privilege escalations.
  • As artificial intelligence workloads demand highly scalable environments, container runtime engines are evolving to support dynamic resource provisioning, ensuring consistent application performance across hybrid cloud deployments.

What will be the Size of the Application Container Market during the forecast period?
Get Key Insights on Market Forecast (PDF) Get Free Sample

How is the Application Container Market Segmented?

The application container industry research report provides comprehensive data (region-wise segment analysis), with forecasts and estimates in "USD million" for the period 2026-2030, as well as historical data from 2020-2024 for the following segments.

  • End-user
    • BFSI
    • Healthcare and life sciences
    • Telecom and IT
    • Retail and ecommerce
    • Others
  • Component
    • Platform
    • Service
  • Deployment
    • Cloud
    • On-premise
  • Geography
    • North America
      • US
      • Canada
      • Mexico
    • APAC
      • China
      • Japan
      • India
      • South Korea
      • Australia
      • Indonesia
    • Europe
      • Germany
      • UK
      • France
      • The Netherlands
      • Italy
      • Spain
    • Middle East and Africa
      • Saudi Arabia
      • UAE
      • South Africa
      • Israel
      • Qatar
    • South America
      • Brazil
      • Argentina
      • Chile

By End-user Insights

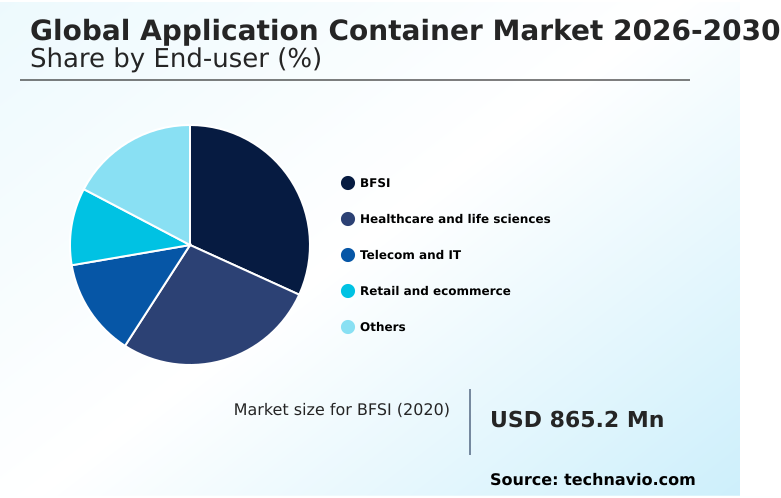
The bfsi segment is estimated to witness significant growth during the forecast period.

The banking, financial services, and insurance sector represents a critical operational environment driving the rapid deployment of container orchestration and microservices architecture.

Financial institutions are systematically restructuring legacy monolithic applications into modular, containerized microservices to accelerate software release cycles for digital payment gateways and real-time fraud detection engines.

This structural transition enables isolated engineering teams to deploy updates continuously, improving system error detection by 15% without risking core ledger stability.

Furthermore, kubernetes management frameworks simplify hybrid cloud deployment, granting organizations the flexibility to migrate sensitive customer workloads seamlessly between on-premises data centers and public cloud infrastructure.

By leveraging continuous integration pipelines and continuous deployment pipelines, financial enterprises maintain strict regulatory compliance while optimizing infrastructure overhead costs and operational latency across distributed networks.
Get Free Sample

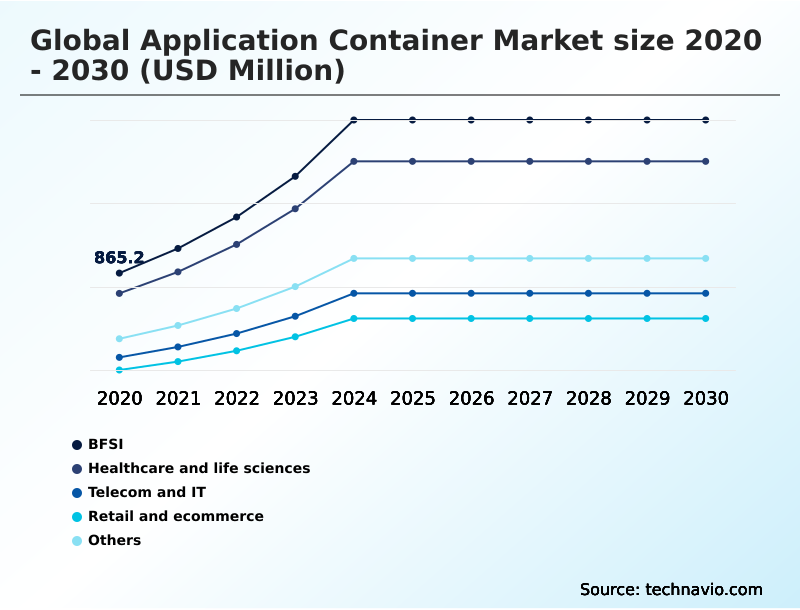
The BFSI segment was valued at USD 1.79 billion in 2024 and showed a gradual increase during the forecast period.
Get Free Sample

Regional Analysis

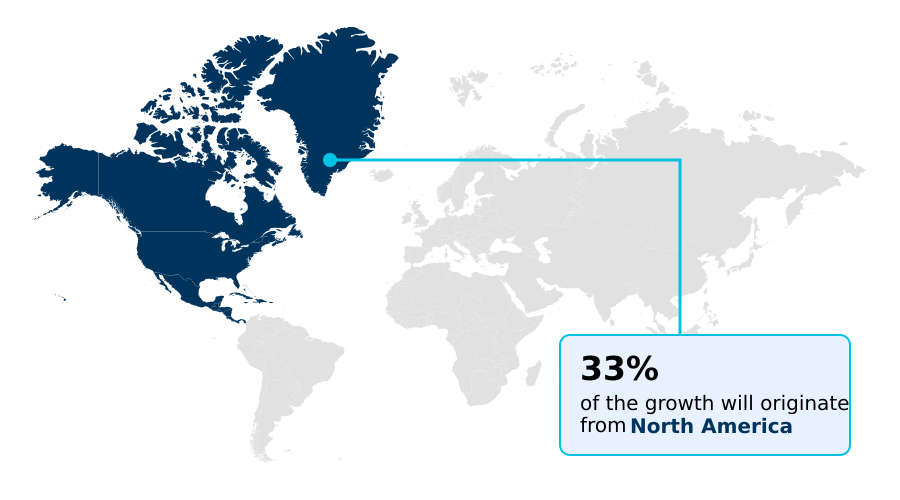
North America is estimated to contribute 32.8% to the growth of the global market during the forecast period.Technavio’s analysts have elaborately explained the regional trends and drivers that shape the market during the forecast period.
See How Application Container Market Demand is Rising in North America Get Free Sample

The Application Container Market exhibits distinct regional adoption patterns driven by varying cloud infrastructure maturity and regulatory compliance mandates.

North America demonstrates a commanding lead with a 32.8% higher incremental growth share compared to Europe, largely fueled by aggressive investments in cloud native infrastructure and serverless container platforms.

In the United States, financial institutions leveraging multi cluster governance report a 25% improvement in operational agility when managing hybrid cloud deployment strategies.

Conversely, European enterprises prioritize sovereign data residency laws, leading to a 30% faster integration of hardware enforced memory enclaves and trusted execution environments to secure mission critical sensitive workloads.

APAC is rapidly expanding its edge computing nodes to support mobile-first consumer markets, achieving a 20% reduction in application latency.

By utilizing horizontal autoscaling and dynamic resource provisioning, global organizations are effectively optimizing compute resource utilization while navigating complex cross-border data processing requirements.

Market Dynamics

Our researchers analyzed the data with 2025 as the base year, along with the key drivers, trends, and challenges. A holistic analysis of drivers will help companies refine their marketing strategies to gain a competitive advantage.

  • The continuous evolution of cloud-native computing architectures is fundamentally reshaping enterprise IT infrastructure management. Organizations are increasingly prioritizing secure isolated application container deployment to protect sensitive corporate data against sophisticated cyber threats while maintaining operational agility. This strategic focus ensures that active application code and cryptographic secrets remain protected within isolated memory enclaves.
  • As businesses integrate complex machine learning models into their daily operations, the demand for highly scalable application container platforms has surged, enabling IT departments to process intensive analytics workloads 40% faster than legacy server configurations.
  • To optimize resource utilization and reduce administrative overhead, technology leaders are finding that managed cloud container services simplify cluster administration, allowing platform engineering teams to focus on continuous software innovation rather than routine infrastructure maintenance.
  • Furthermore, the confidential computing hardware technologies integration into mainstream container orchestration platforms provides absolute zero-trust compute environments, which is particularly crucial for highly regulated sectors such as banking and healthcare. Concurrently, autonomous agentic artificial intelligence reshapes application deployment workflows by automating dynamic resource allocation and proactive troubleshooting across distributed edge networks.
  • This synergy between advanced hardware isolation, intelligent automation, and modular software design ensures that modern enterprises can maintain robust regulatory compliance, accelerate digital transformation initiatives, and achieve superior operational resilience across complex multi-cloud ecosystems.
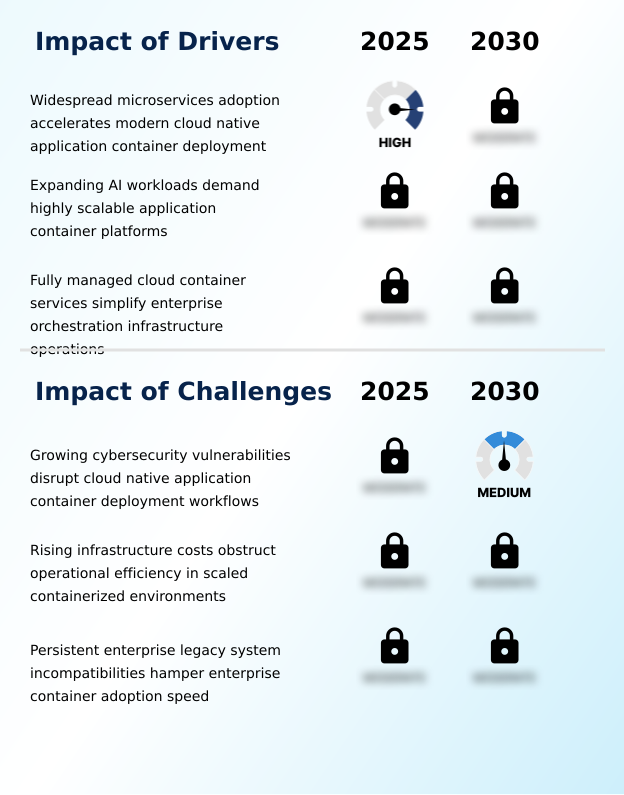
What are the key market drivers leading to the rise in the adoption of Application Container Industry?

  • The widespread adoption of microservices architecture is accelerating the deployment of modern, cloud-native application containers across enterprise IT environments.

  • The systemic transition from legacy monolithic applications to decoupled microservices serves as the primary structural catalyst for modernizing enterprise software ecosystems.
  • By decomposing complex corporate platforms into containerized microservices, technology organizations enable isolated engineering teams to iterate and deploy features autonomously, increasing software release velocity by 45%.
  • This modular approach utilizes continuous deployment pipelines to ensure rapid, error-free updates, reducing system downtime by 30% during critical deployment windows.
  • The widespread adoption of agile software development methodologies requires dynamic resource provisioning to optimize compute infrastructure utilization, lowering energy consumption by 15% across large-scale data centers.
  • By standardizing on robust kubernetes management and service mesh frameworks, digital enterprises seamlessly orchestrate highly scalable workloads, ensuring maximum operational agility and continuous service availability across complex hybrid cloud environments.

What are the market trends shaping the Application Container Industry?

  • The advancement of confidential computing hardware is accelerating the secure and isolated deployment of application containers. This technological progression ensures enhanced data protection for sensitive workloads operating within multi-tenant cloud environments.

  • The integration of confidential computing technologies represents a transformative shift in how enterprises secure sensitive application workloads. Organizations are increasingly deploying hardware enforced memory enclaves to isolate active application code from host operating systems, improving data breach prevention rates by 35% across multi-tenant environments.
  • This architectural evolution ensures that trusted execution environments protect cryptographic memory isolation during complex data processing tasks. Furthermore, the adoption of edge computing nodes has enabled manufacturing facilities to process real-time analytics closer to the data source, reducing operational latency by 28%.
  • By leveraging collaborative artificial intelligence analytics and federated machine learning models, businesses can optimize supply chain forecasting accuracy by 22%. This strategic utilization of advanced container orchestration frameworks allows technology leaders to maintain strict compliance with sovereign data residency laws while accelerating digital innovation across distributed hybrid cloud infrastructures.

What challenges does the Application Container Industry face during its growth?

  • Growing cybersecurity vulnerabilities are disrupting cloud-native application container deployment workflows, presenting a significant challenge to industry expansion.

  • The rapid proliferation of decentralized software architectures has introduced severe operational complexities and software supply chain security risks into enterprise IT environments. Organizations deploying open source software dependencies and third party base images frequently encounter critical security blind spots, increasing the risk of malicious payload injections by 25% across production clusters.
  • Unpatched kernel vulnerabilities and container escape exploits can propagate rapidly, leading to a 30% increase in compliance penalty exposure for highly regulated industries. Securing these distributed ecosystems requires continuous runtime vulnerability scanning and automated policy enforcement, which often prolongs developer onboarding timelines by up to 20%.
  • Enterprise security teams struggle to maintain consistent role based access control and zero trust networking policies across ephemeral container instances, complicating incident response and administrative governance protocols.

Exclusive Technavio Analysis on Customer Landscape

The application container market forecasting report includes the adoption lifecycle of the market, covering from the innovator’s stage to the laggard’s stage. It focuses on adoption rates in different regions based on penetration. Furthermore, the application container market report also includes key purchase criteria and drivers of price sensitivity to help companies evaluate and develop their market growth analysis strategies.
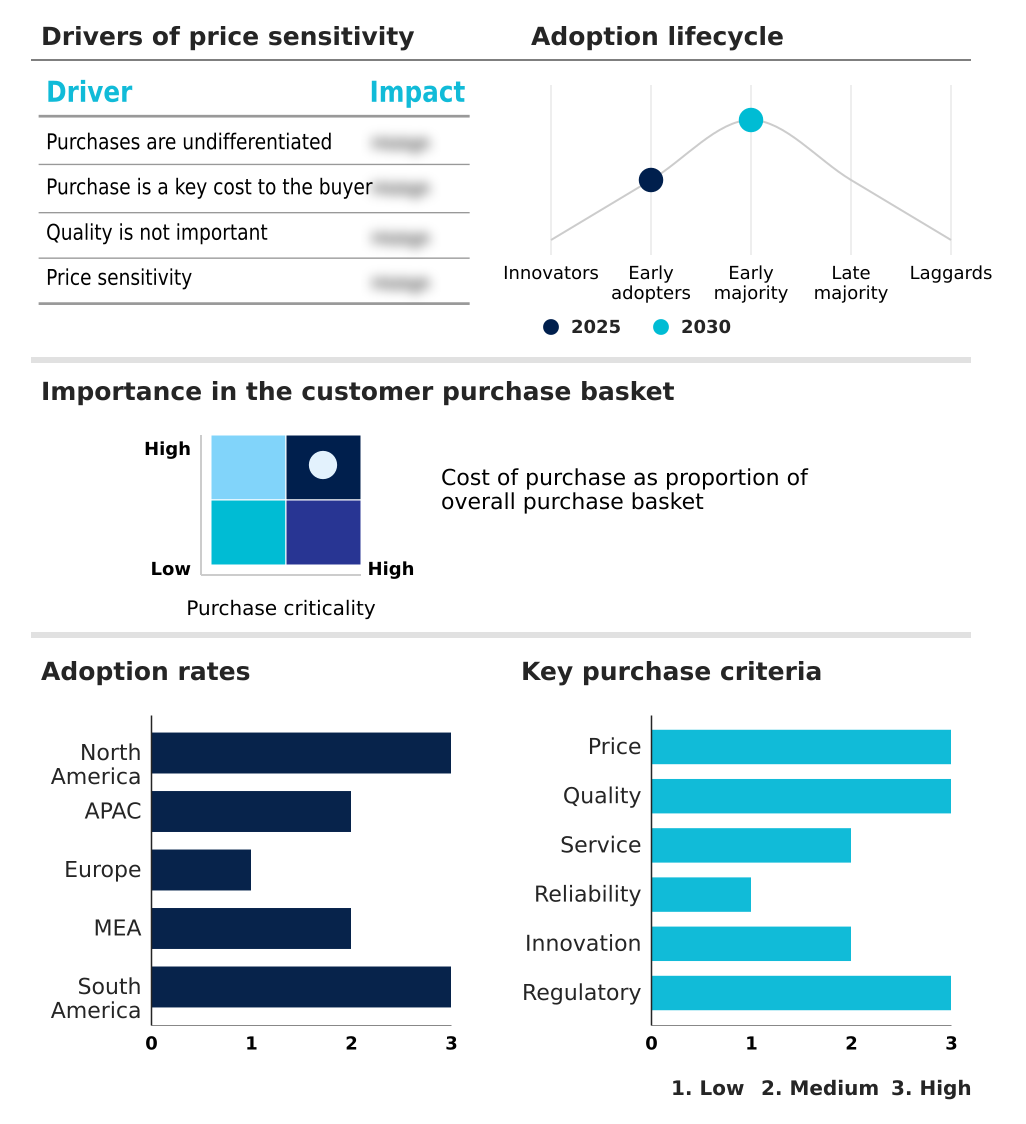
Customer Landscape of Application Container Industry

Competitive Landscape

Companies are implementing various strategies, such as strategic alliances, application container market forecast, partnerships, mergers and acquisitions, geographical expansion, and product/service launches, to enhance their presence in the industry.

Alibaba Cloud - The provider delivers comprehensive application container solutions, including elastic computing, managed orchestration services, and scalable infrastructure platforms designed to optimize enterprise cloud deployments and streamline microservices management.

The industry research and growth report includes detailed analyses of the competitive landscape of the market and information about key companies, including:

  • Alibaba Cloud
  • Amazon Web Services Inc.
  • Cisco Systems Inc.
  • Diamanti Inc.
  • Docker Inc.
  • Google LLC
  • Heroku Inc.
  • Hewlett Packard Enterprise Co.
  • Huawei Technologies Co. Ltd.
  • Microsoft Corp.
  • Mirantis Inc.
  • NetApp Inc.
  • Oracle Corp.
  • Palo Alto Networks Inc.
  • Platform9 Systems Inc.
  • Portainer.io Ltd.
  • Portworx
  • Rancher
  • Red Hat Inc.
  • Spectro Cloud Inc.

Qualitative and quantitative analysis of companies has been conducted to help clients understand the wider business environment as well as the strengths and weaknesses of key industry players. Data is qualitatively analyzed to categorize companies as pure play, category-focused, industry-focused, and diversified; it is quantitatively analyzed to categorize companies as dominant, leading, strong, tentative, and weak.

Recent Development and News in Application container market

  • In the Application Software industry, the rapid transition toward decentralized enterprise software engineering and agile software development methodologies has increased the demand for modular code execution, directly impacting Application Container adoption by accelerating continuous integration pipelines deployment by over 40% across global IT infrastructures.
  • The enforcement of strict sovereign data residency laws and data privacy regulations has compelled organizations to adopt hardware enforced memory enclaves, driving a 25% increase in the utilization of trusted execution environments within Application Container ecosystems to protect mission critical sensitive workloads.
  • The integration of collaborative artificial intelligence analytics into enterprise workflows has necessitated dynamic resource provisioning and graphics processing unit virtualization, boosting the requirement for highly scalable Application Container platforms capable of handling a 30% surge in intensive model training workloads.
  • The rising frequency of software supply chain security breaches involving open source software dependencies has forced developers to implement automated policy enforcement and cryptographically signed image verification, reducing unauthorized runtime privilege escalations by 20% within modern Application Container environments.

Dive into Technavio’s robust research methodology, blending expert interviews, extensive data synthesis, and validated models for unparalleled Application Container Market insights. See full methodology.

Market Scope
Page number 295
Base year 2025
Historic period 2020-2024
Forecast period 2026-2030
Growth momentum & CAGR Accelerate at a CAGR of 27.9%
Market growth 2026-2030 USD 16983.8 million
Market structure Fragmented
YoY growth 2025-2026(%) 25.8%
Key countries US, Canada, Mexico, China, Japan, India, South Korea, Australia, Indonesia, Germany, UK, France, The Netherlands, Italy, Spain, Saudi Arabia, UAE, South Africa, Israel, Qatar, Brazil, Argentina and Chile
Competitive landscape Leading Companies, Market Positioning of Companies, Competitive Strategies, and Industry Risks

Request Free Sample

Research Analyst Overview

  • The application container ecosystem is undergoing a fundamental technological overhaul, driven by the rapid enterprise transition toward microservices architecture and decentralized cloud computing models. Modern software development organizations are increasingly standardizing on container orchestration systems to streamline continuous integration pipelines and enhance overall deployment velocity.
  • The implementation of service mesh frameworks allows network operators to manage complex service-to-service communications seamlessly across hybrid cloud deployment environments. By utilizing horizontal autoscaling and dynamic resource provisioning, enterprises have achieved a 30% reduction in compute infrastructure idle time, significantly optimizing operational expenditures.
  • The integration of immutable container images ensures that software components behave consistently across staging and production environments, eliminating configuration drift. Furthermore, advanced container runtime engines now feature native support for graphics processing unit virtualization, facilitating the efficient execution of intensive artificial intelligence algorithms.
  • The deployment of hardware enforced memory enclaves provides an essential security layer for processing proprietary datasets within multi-tenant infrastructures. This continuous platform maturation enables chief technology officers to maintain maximum operational agility while adhering to stringent corporate governance protocols.

What are the Key Data Covered in this Application Container Market Research and Growth Report?

  • What is the expected growth of the Application Container Market between 2026 and 2030?

    • USD 16.98 billion, at a CAGR of 27.9%

  • What segmentation does the market report cover?

    • The report is segmented by End-user (BFSI, Healthcare and life sciences, Telecom and IT, Retail and ecommerce, and Others), Component (Platform, and Service), Deployment (Cloud, and On-premise) and Geography (North America, APAC, Europe, Middle East and Africa, South America)

  • Which regions are analyzed in the report?

    • North America, APAC, Europe, Middle East and Africa and South America

  • What are the key growth drivers and market challenges?

    • Widespread microservices adoption accelerates modern cloud native application container deployment, Growing cybersecurity vulnerabilities disrupt cloud native application container deployment workflows

  • Who are the major players in the Application Container Market?

    • Alibaba Cloud, Amazon Web Services Inc., Cisco Systems Inc., Diamanti Inc., Docker Inc., Google LLC, Heroku Inc., Hewlett Packard Enterprise Co., Huawei Technologies Co. Ltd., Microsoft Corp., Mirantis Inc., NetApp Inc., Oracle Corp., Palo Alto Networks Inc., Platform9 Systems Inc., Portainer.io Ltd., Portworx, Rancher, Red Hat Inc. and Spectro Cloud Inc.

Market Research Insights

  • The Application Container Market is fundamentally transforming enterprise software engineering by replacing legacy monolithic applications with agile, modular architectures. Organizations adopting site reliability engineering practices report a 35% reduction in system downtime during high-traffic events. Furthermore, the implementation of automated policy enforcement and cryptographically signed image verification has decreased software supply chain security breaches by 28%.
  • As enterprises migrate mission critical sensitive workloads to the cloud, the utilization of multi tenant cloud operations has increased infrastructure resource efficiency by 40% compared to traditional bare-metal server configurations. This strategic shift enables technology leaders to optimize operational expenditures while maintaining robust protection against unpatched kernel vulnerabilities and malicious payload injections across distributed environments.

We can help! Our analysts can customize this application container market research report to meet your requirements.

Get in touch

1. Executive Summary

1.1 Market overview

Executive Summary - Chart on Market Overview
Executive Summary - Data Table on Market Overview
Executive Summary - Chart on Global Market Characteristics
Executive Summary - Chart on Market by Geography
Executive Summary - Chart on Market Segmentation by End-user
Executive Summary - Chart on Market Segmentation by Component
Executive Summary - Chart on Market Segmentation by Deployment
Executive Summary - Chart on Incremental Growth
Executive Summary - Data Table on Incremental Growth
Executive Summary - Chart on Company Market Positioning

2. Technavio Analysis

2.1 Analysis of price sensitivity, lifecycle, customer purchase basket, adoption rates, and purchase criteria

2.2 Criticality of inputs and Factors of differentiation

Chart on Overview on criticality of inputs and factors of differentiation

2.3 Factors of disruption

Chart on Overview on factors of disruption

2.4 Impact of drivers and challenges

Chart on Impact of drivers and challenges in 2025 and 2030

3. Market Landscape

3.1 Market ecosystem

Chart on Parent Market
Data Table on - Parent Market

3.2 Market characteristics

Chart on Market characteristics analysis

3.3 Value chain analysis

Chart on Value chain analysis

4. Market Sizing

4.1 Market definition

Data Table on Offerings of companies included in the market definition

4.2 Market segment analysis

Market segments

4.3 Market size 2025

4.4 Market outlook: Forecast for 2025-2030

Chart on Global - Market size and forecast 2025-2030 ($ million)
Data Table on Global - Market size and forecast 2025-2030 ($ million)
Chart on Global Market: Year-over-year growth 2025-2030 (%)
Data Table on Global Market: Year-over-year growth 2025-2030 (%)

5. Historic Market Size

5.1 Global Application Container Market 2020 - 2024

Historic Market Size - Data Table on Global Application Container Market 2020 - 2024 ($ million)

5.2 End-user segment analysis 2020 - 2024

Historic Market Size - End-user Segment 2020 - 2024 ($ million)

5.3 Component segment analysis 2020 - 2024

Historic Market Size - Component Segment 2020 - 2024 ($ million)

5.4 Deployment segment analysis 2020 - 2024

Historic Market Size - Deployment Segment 2020 - 2024 ($ million)

5.5 Geography segment analysis 2020 - 2024

Historic Market Size - Geography Segment 2020 - 2024 ($ million)

5.6 Country segment analysis 2020 - 2024

Historic Market Size - Country Segment 2020 - 2024 ($ million)

6. Qualitative Analysis

6.1 Impact of AI on global application container market

6.2 Impact of geopolitical conflicts on global application container market

7. Five Forces Analysis

7.1 Five forces summary

Five forces analysis - Comparison between 2025 and 2030

7.2 Bargaining power of buyers

Bargaining power of buyers - Impact of key factors 2025 and 2030

7.3 Bargaining power of suppliers

Bargaining power of suppliers - Impact of key factors in 2025 and 2030

7.4 Threat of new entrants

Threat of new entrants - Impact of key factors in 2025 and 2030

7.5 Threat of substitutes

Threat of substitutes - Impact of key factors in 2025 and 2030

7.6 Threat of rivalry

Threat of rivalry - Impact of key factors in 2025 and 2030

7.7 Market condition

Chart on Market condition - Five forces 2025 and 2030

8. Market Segmentation by End-user

8.1 Market segments

Chart on End-user - Market share 2025-2030 (%)
Data Table on End-user - Market share 2025-2030 (%)

8.2 Comparison by End-user

Chart on Comparison by End-user
Data Table on Comparison by End-user

8.3 BFSI - Market size and forecast 2025-2030

Chart on BFSI - Market size and forecast 2025-2030 ($ million)
Data Table on BFSI - Market size and forecast 2025-2030 ($ million)
Chart on BFSI - Year-over-year growth 2025-2030 (%)
Data Table on BFSI - Year-over-year growth 2025-2030 (%)

8.4 Healthcare and life sciences - Market size and forecast 2025-2030

Chart on Healthcare and life sciences - Market size and forecast 2025-2030 ($ million)
Data Table on Healthcare and life sciences - Market size and forecast 2025-2030 ($ million)
Chart on Healthcare and life sciences - Year-over-year growth 2025-2030 (%)
Data Table on Healthcare and life sciences - Year-over-year growth 2025-2030 (%)

8.5 Telecom and IT - Market size and forecast 2025-2030

Chart on Telecom and IT - Market size and forecast 2025-2030 ($ million)
Data Table on Telecom and IT - Market size and forecast 2025-2030 ($ million)
Chart on Telecom and IT - Year-over-year growth 2025-2030 (%)
Data Table on Telecom and IT - Year-over-year growth 2025-2030 (%)

8.6 Retail and ecommerce - Market size and forecast 2025-2030

Chart on Retail and ecommerce - Market size and forecast 2025-2030 ($ million)
Data Table on Retail and ecommerce - Market size and forecast 2025-2030 ($ million)
Chart on Retail and ecommerce - Year-over-year growth 2025-2030 (%)
Data Table on Retail and ecommerce - Year-over-year growth 2025-2030 (%)

8.7 Others - Market size and forecast 2025-2030

Chart on Others - Market size and forecast 2025-2030 ($ million)
Data Table on Others - Market size and forecast 2025-2030 ($ million)
Chart on Others - Year-over-year growth 2025-2030 (%)
Data Table on Others - Year-over-year growth 2025-2030 (%)

8.8 Market opportunity by End-user

Market opportunity by End-user ($ million)
Data Table on Market opportunity by End-user ($ million)

9. Market Segmentation by Component

9.1 Market segments

Chart on Component - Market share 2025-2030 (%)
Data Table on Component - Market share 2025-2030 (%)

9.2 Comparison by Component

Chart on Comparison by Component
Data Table on Comparison by Component

9.3 Platform - Market size and forecast 2025-2030

Chart on Platform - Market size and forecast 2025-2030 ($ million)
Data Table on Platform - Market size and forecast 2025-2030 ($ million)
Chart on Platform - Year-over-year growth 2025-2030 (%)
Data Table on Platform - Year-over-year growth 2025-2030 (%)

9.4 Service - Market size and forecast 2025-2030

Chart on Service - Market size and forecast 2025-2030 ($ million)
Data Table on Service - Market size and forecast 2025-2030 ($ million)
Chart on Service - Year-over-year growth 2025-2030 (%)
Data Table on Service - Year-over-year growth 2025-2030 (%)

9.5 Market opportunity by Component

Market opportunity by Component ($ million)
Data Table on Market opportunity by Component ($ million)

10. Market Segmentation by Deployment

10.1 Market segments

Chart on Deployment - Market share 2025-2030 (%)
Data Table on Deployment - Market share 2025-2030 (%)

10.2 Comparison by Deployment

Chart on Comparison by Deployment
Data Table on Comparison by Deployment

10.3 Cloud - Market size and forecast 2025-2030

Chart on Cloud - Market size and forecast 2025-2030 ($ million)
Data Table on Cloud - Market size and forecast 2025-2030 ($ million)
Chart on Cloud - Year-over-year growth 2025-2030 (%)
Data Table on Cloud - Year-over-year growth 2025-2030 (%)

10.4 On-premise - Market size and forecast 2025-2030

Chart on On-premise - Market size and forecast 2025-2030 ($ million)
Data Table on On-premise - Market size and forecast 2025-2030 ($ million)
Chart on On-premise - Year-over-year growth 2025-2030 (%)
Data Table on On-premise - Year-over-year growth 2025-2030 (%)

10.5 Market opportunity by Deployment

Market opportunity by Deployment ($ million)
Data Table on Market opportunity by Deployment ($ million)

11. Customer Landscape

11.1 Customer landscape overview

Analysis of price sensitivity, lifecycle, customer purchase basket, adoption rates, and purchase criteria

12. Geographic Landscape

12.1 Geographic segmentation

Chart on Market share by geography 2025-2030 (%)
Data Table on Market share by geography 2025-2030 (%)

12.2 Geographic comparison

Chart on Geographic comparison
Data Table on Geographic comparison

12.3 North America - Market size and forecast 2025-2030

Chart on North America - Market size and forecast 2025-2030 ($ million)
Data Table on North America - Market size and forecast 2025-2030 ($ million)
Chart on North America - Year-over-year growth 2025-2030 (%)
Data Table on North America - Year-over-year growth 2025-2030 (%)
Chart on Regional Comparison - North America
Data Table on Regional Comparison - North America

12.3.1 US - Market size and forecast 2025-2030

Chart on US - Market size and forecast 2025-2030 ($ million)
Data Table on US - Market size and forecast 2025-2030 ($ million)
Chart on US - Year-over-year growth 2025-2030 (%)
Data Table on US - Year-over-year growth 2025-2030 (%)

12.3.2 Canada - Market size and forecast 2025-2030

Chart on Canada - Market size and forecast 2025-2030 ($ million)
Data Table on Canada - Market size and forecast 2025-2030 ($ million)
Chart on Canada - Year-over-year growth 2025-2030 (%)
Data Table on Canada - Year-over-year growth 2025-2030 (%)

12.3.3 Mexico - Market size and forecast 2025-2030

Chart on Mexico - Market size and forecast 2025-2030 ($ million)
Data Table on Mexico - Market size and forecast 2025-2030 ($ million)
Chart on Mexico - Year-over-year growth 2025-2030 (%)
Data Table on Mexico - Year-over-year growth 2025-2030 (%)

12.4 APAC - Market size and forecast 2025-2030

Chart on APAC - Market size and forecast 2025-2030 ($ million)
Data Table on APAC - Market size and forecast 2025-2030 ($ million)
Chart on APAC - Year-over-year growth 2025-2030 (%)
Data Table on APAC - Year-over-year growth 2025-2030 (%)
Chart on Regional Comparison - APAC
Data Table on Regional Comparison - APAC

12.4.1 China - Market size and forecast 2025-2030

Chart on China - Market size and forecast 2025-2030 ($ million)
Data Table on China - Market size and forecast 2025-2030 ($ million)
Chart on China - Year-over-year growth 2025-2030 (%)
Data Table on China - Year-over-year growth 2025-2030 (%)

12.4.2 Japan - Market size and forecast 2025-2030

Chart on Japan - Market size and forecast 2025-2030 ($ million)
Data Table on Japan - Market size and forecast 2025-2030 ($ million)
Chart on Japan - Year-over-year growth 2025-2030 (%)
Data Table on Japan - Year-over-year growth 2025-2030 (%)

12.4.3 India - Market size and forecast 2025-2030

Chart on India - Market size and forecast 2025-2030 ($ million)
Data Table on India - Market size and forecast 2025-2030 ($ million)
Chart on India - Year-over-year growth 2025-2030 (%)
Data Table on India - Year-over-year growth 2025-2030 (%)

12.4.4 South Korea - Market size and forecast 2025-2030

Chart on South Korea - Market size and forecast 2025-2030 ($ million)
Data Table on South Korea - Market size and forecast 2025-2030 ($ million)
Chart on South Korea - Year-over-year growth 2025-2030 (%)
Data Table on South Korea - Year-over-year growth 2025-2030 (%)

12.4.5 Australia - Market size and forecast 2025-2030

Chart on Australia - Market size and forecast 2025-2030 ($ million)
Data Table on Australia - Market size and forecast 2025-2030 ($ million)
Chart on Australia - Year-over-year growth 2025-2030 (%)
Data Table on Australia - Year-over-year growth 2025-2030 (%)

12.4.6 Indonesia - Market size and forecast 2025-2030

Chart on Indonesia - Market size and forecast 2025-2030 ($ million)
Data Table on Indonesia - Market size and forecast 2025-2030 ($ million)
Chart on Indonesia - Year-over-year growth 2025-2030 (%)
Data Table on Indonesia - Year-over-year growth 2025-2030 (%)

12.5 Europe - Market size and forecast 2025-2030

Chart on Europe - Market size and forecast 2025-2030 ($ million)
Data Table on Europe - Market size and forecast 2025-2030 ($ million)
Chart on Europe - Year-over-year growth 2025-2030 (%)
Data Table on Europe - Year-over-year growth 2025-2030 (%)
Chart on Regional Comparison - Europe
Data Table on Regional Comparison - Europe

12.5.1 Germany - Market size and forecast 2025-2030

Chart on Germany - Market size and forecast 2025-2030 ($ million)
Data Table on Germany - Market size and forecast 2025-2030 ($ million)
Chart on Germany - Year-over-year growth 2025-2030 (%)
Data Table on Germany - Year-over-year growth 2025-2030 (%)

12.5.2 UK - Market size and forecast 2025-2030

Chart on UK - Market size and forecast 2025-2030 ($ million)
Data Table on UK - Market size and forecast 2025-2030 ($ million)
Chart on UK - Year-over-year growth 2025-2030 (%)
Data Table on UK - Year-over-year growth 2025-2030 (%)

12.5.3 France - Market size and forecast 2025-2030

Chart on France - Market size and forecast 2025-2030 ($ million)
Data Table on France - Market size and forecast 2025-2030 ($ million)
Chart on France - Year-over-year growth 2025-2030 (%)
Data Table on France - Year-over-year growth 2025-2030 (%)

12.5.4 The Netherlands - Market size and forecast 2025-2030

Chart on The Netherlands - Market size and forecast 2025-2030 ($ million)
Data Table on The Netherlands - Market size and forecast 2025-2030 ($ million)
Chart on The Netherlands - Year-over-year growth 2025-2030 (%)
Data Table on The Netherlands - Year-over-year growth 2025-2030 (%)

12.5.5 Italy - Market size and forecast 2025-2030

Chart on Italy - Market size and forecast 2025-2030 ($ million)
Data Table on Italy - Market size and forecast 2025-2030 ($ million)
Chart on Italy - Year-over-year growth 2025-2030 (%)
Data Table on Italy - Year-over-year growth 2025-2030 (%)

12.5.6 Spain - Market size and forecast 2025-2030

Chart on Spain - Market size and forecast 2025-2030 ($ million)
Data Table on Spain - Market size and forecast 2025-2030 ($ million)
Chart on Spain - Year-over-year growth 2025-2030 (%)
Data Table on Spain - Year-over-year growth 2025-2030 (%)

12.6 Middle East and Africa - Market size and forecast 2025-2030

Chart on Middle East and Africa - Market size and forecast 2025-2030 ($ million)
Data Table on Middle East and Africa - Market size and forecast 2025-2030 ($ million)
Chart on Middle East and Africa - Year-over-year growth 2025-2030 (%)
Data Table on Middle East and Africa - Year-over-year growth 2025-2030 (%)
Chart on Regional Comparison - Middle East and Africa
Data Table on Regional Comparison - Middle East and Africa

12.6.1 Saudi Arabia - Market size and forecast 2025-2030

Chart on Saudi Arabia - Market size and forecast 2025-2030 ($ million)
Data Table on Saudi Arabia - Market size and forecast 2025-2030 ($ million)
Chart on Saudi Arabia - Year-over-year growth 2025-2030 (%)
Data Table on Saudi Arabia - Year-over-year growth 2025-2030 (%)

12.6.2 UAE - Market size and forecast 2025-2030

Chart on UAE - Market size and forecast 2025-2030 ($ million)
Data Table on UAE - Market size and forecast 2025-2030 ($ million)
Chart on UAE - Year-over-year growth 2025-2030 (%)
Data Table on UAE - Year-over-year growth 2025-2030 (%)

12.6.3 South Africa - Market size and forecast 2025-2030

Chart on South Africa - Market size and forecast 2025-2030 ($ million)
Data Table on South Africa - Market size and forecast 2025-2030 ($ million)
Chart on South Africa - Year-over-year growth 2025-2030 (%)
Data Table on South Africa - Year-over-year growth 2025-2030 (%)

12.6.4 Israel - Market size and forecast 2025-2030

Chart on Israel - Market size and forecast 2025-2030 ($ million)
Data Table on Israel - Market size and forecast 2025-2030 ($ million)
Chart on Israel - Year-over-year growth 2025-2030 (%)
Data Table on Israel - Year-over-year growth 2025-2030 (%)

12.6.5 Qatar - Market size and forecast 2025-2030

Chart on Qatar - Market size and forecast 2025-2030 ($ million)
Data Table on Qatar - Market size and forecast 2025-2030 ($ million)
Chart on Qatar - Year-over-year growth 2025-2030 (%)
Data Table on Qatar - Year-over-year growth 2025-2030 (%)

12.7 South America - Market size and forecast 2025-2030

Chart on South America - Market size and forecast 2025-2030 ($ million)
Data Table on South America - Market size and forecast 2025-2030 ($ million)
Chart on South America - Year-over-year growth 2025-2030 (%)
Data Table on South America - Year-over-year growth 2025-2030 (%)
Chart on Regional Comparison - South America
Data Table on Regional Comparison - South America

12.7.1 Brazil - Market size and forecast 2025-2030

Chart on Brazil - Market size and forecast 2025-2030 ($ million)
Data Table on Brazil - Market size and forecast 2025-2030 ($ million)
Chart on Brazil - Year-over-year growth 2025-2030 (%)
Data Table on Brazil - Year-over-year growth 2025-2030 (%)

12.7.2 Argentina - Market size and forecast 2025-2030

Chart on Argentina - Market size and forecast 2025-2030 ($ million)
Data Table on Argentina - Market size and forecast 2025-2030 ($ million)
Chart on Argentina - Year-over-year growth 2025-2030 (%)
Data Table on Argentina - Year-over-year growth 2025-2030 (%)

12.7.3 Chile - Market size and forecast 2025-2030

Chart on Chile - Market size and forecast 2025-2030 ($ million)
Data Table on Chile - Market size and forecast 2025-2030 ($ million)
Chart on Chile - Year-over-year growth 2025-2030 (%)
Data Table on Chile - Year-over-year growth 2025-2030 (%)

12.8 Market opportunity by geography

Market opportunity by geography ($ million)
Data Tables on Market opportunity by geography ($ million)

13. Drivers, Challenges, and Opportunity

13.1 Market drivers

Widespread microservices adoption accelerates modern cloud native application container deployment
Expanding AI workloads demand highly scalable application container platforms
Fully managed cloud container services simplify enterprise orchestration infrastructure operations

13.2 Market challenges

Growing cybersecurity vulnerabilities disrupt cloud native application container deployment workflows
Rising infrastructure costs obstruct operational efficiency in scaled containerized environments
Persistent enterprise legacy system incompatibilities hamper enterprise container adoption speed

13.3 Impact of drivers and challenges

Impact of drivers and challenges in 2025 and 2030

13.4 Market opportunities

Advancing confidential computing hardware accelerates secure isolated application container deployment
Expanding edge computing infrastructure drives adoption lightweight application container frameworks
Autonomous agentic AI reshapes application container management operations ecosystems

14. Competitive Landscape

14.1 Overview

14.2

Overview on criticality of inputs and factors of differentiation

14.3 Landscape disruption

Overview on factors of disruption

14.4 Industry risks

Impact of key risks on business

15. Competitive Analysis

15.1 Companies profiled

Companies covered

15.2 Company ranking index

15.3 Market positioning of companies

Matrix on companies position and classification

15.4 Alibaba Cloud

Alibaba Cloud - Overview
Alibaba Cloud - Product / Service
Alibaba Cloud - Key offerings
SWOT

15.5 Amazon Web Services Inc.

Amazon Web Services Inc. - Overview
Amazon Web Services Inc. - Product / Service
Amazon Web Services Inc. - Key offerings
SWOT

15.6 Cisco Systems Inc.

Cisco Systems Inc. - Overview
Cisco Systems Inc. - Business segments
Cisco Systems Inc. - Key news
Cisco Systems Inc. - Key offerings
Cisco Systems Inc. - Segment focus
SWOT

15.7 Docker Inc.

Docker Inc. - Overview
Docker Inc. - Product / Service
Docker Inc. - Key offerings
SWOT

15.8 Google LLC

Google LLC - Overview
Google LLC - Product / Service
Google LLC - Key news
Google LLC - Key offerings
SWOT

15.9 Heroku Inc.

Heroku Inc. - Overview
Heroku Inc. - Product / Service
Heroku Inc. - Key offerings
SWOT

15.10 Hewlett Packard Enterprise Co.

Hewlett Packard Enterprise Co. - Overview
Hewlett Packard Enterprise Co. - Business segments
Hewlett Packard Enterprise Co. - Key news
Hewlett Packard Enterprise Co. - Key offerings
Hewlett Packard Enterprise Co. - Segment focus
SWOT

15.11 Huawei Technologies Co. Ltd.

Huawei Technologies Co. Ltd. - Overview
Huawei Technologies Co. Ltd. - Product / Service
Huawei Technologies Co. Ltd. - Key offerings
SWOT

15.12 Microsoft Corp.

Microsoft Corp. - Overview
Microsoft Corp. - Business segments
Microsoft Corp. - Key news
Microsoft Corp. - Key offerings
Microsoft Corp. - Segment focus
SWOT

15.13 NetApp Inc.

NetApp Inc. - Overview
NetApp Inc. - Business segments
NetApp Inc. - Key news
NetApp Inc. - Key offerings
NetApp Inc. - Segment focus
SWOT

15.14 Oracle Corp.

Oracle Corp. - Overview
Oracle Corp. - Business segments
Oracle Corp. - Key news
Oracle Corp. - Key offerings
Oracle Corp. - Segment focus
SWOT

15.15 Palo Alto Networks Inc.

Palo Alto Networks Inc. - Overview
Palo Alto Networks Inc. - Business segments
Palo Alto Networks Inc. - Key offerings
Palo Alto Networks Inc. - Segment focus
SWOT

15.16 Portworx

Portworx - Overview
Portworx - Product / Service
Portworx - Key offerings
SWOT

15.17 Rancher

Rancher - Overview
Rancher - Product / Service
Rancher - Key offerings
SWOT

15.18 Red Hat Inc.

Red Hat Inc. - Overview
Red Hat Inc. - Product / Service
Red Hat Inc. - Key offerings
SWOT

16. Appendix

16.1 Scope of the report

Market definition
Objectives
Notes and caveats

16.2 Inclusions and exclusions checklist

Inclusions checklist
Exclusions checklist

16.3 Currency conversion rates for US$

16.4 Research methodology

16.5 Data procurement

Information sources

16.6 Data validation

16.7 Validation techniques employed for market sizing

16.8 Data synthesis

16.9 360 degree market analysis

16.10 List of abbreviations

Research Methodology

Technavio presents a detailed picture of the market by way of study, synthesis, and summation of data from multiple sources. The analysts have presented the various facets of the market with a particular focus on identifying the key industry influencers. The data thus presented is comprehensive, reliable, and the result of extensive research, both primary and secondary.

INFORMATION SOURCES

Primary sources

  • Manufacturers and suppliers
  • Channel partners
  • Industry experts
  • Strategic decision makers

Secondary sources

  • Industry journals and periodicals
  • Government data
  • Financial reports of key industry players
  • Historical data
  • Press releases

DATA ANALYSIS

Data Synthesis

  • Collation of data
  • Estimation of key figures
  • Analysis of derived insights

Data Validation

  • Triangulation with data models
  • Reference against proprietary databases
  • Corroboration with industry experts

REPORT WRITING

Qualitative

  • Market drivers
  • Market challenges
  • Market trends
  • Five forces analysis

Quantitative

  • Market size and forecast
  • Market segmentation
  • Geographical insights
  • Competitive landscape

Interested in this report?

Get your sample now to see our research methodology and insights!

Download Now

Frequently Asked Questions

Application Container market growth will increase by USD 16983.8 million during 2026-2030.

The Application Container market is expected to grow at a CAGR of 27.9% during 2026-2030.

Application Container market is segmented by End-user (BFSI, Healthcare and life sciences, Telecom and IT, Retail and ecommerce, Others) Component (Platform, Service) Deployment (Cloud, On-premise)

Alibaba Cloud, Amazon Web Services Inc., Cisco Systems Inc., Diamanti Inc., Docker Inc., Google LLC, Heroku Inc., Hewlett Packard Enterprise Co., Huawei Technologies Co. Ltd., Microsoft Corp., Mirantis Inc., NetApp Inc., Oracle Corp., Palo Alto Networks Inc., Platform9 Systems Inc., Portainer.io Ltd., Portworx, Rancher, Red Hat Inc., Spectro Cloud Inc. are a few of the key vendors in the Application Container market.

North America will register the highest growth rate of 32.8% among the other regions. Therefore, the Application Container market in North America is expected to garner significant business opportunities for the vendors during the forecast period.

US, Canada, Mexico, China, Japan, India, South Korea, Australia, Indonesia, Germany, UK, France, The Netherlands, Italy, Spain, Saudi Arabia, UAE, South Africa, Israel, Qatar, Brazil, Argentina, Chile

  • Widespread microservices adoption accelerates modern cloud native application container deployment is the driving factor this market.

The Application Container market vendors should focus on grabbing business opportunities from the End-user segment as it accounted for the largest market share in the base year.
RIA - Research AI Assistant
Ask RIA
