Arc Welding Robots Market Size 2025-2029
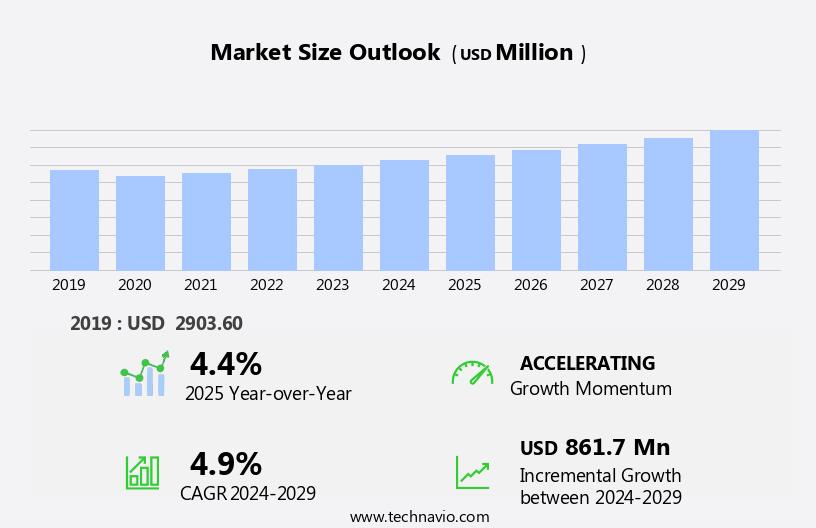
The arc welding robots market size is forecast to increase by USD 861.7 million at a CAGR of 4.9% between 2024 and 2029.
- The market is experiencing significant growth, driven by the increasing popularity of industrial robots in Asia Pacific regions. The adoption of innovative business models, such as robot-as-a-service, is fueling market expansion. However, operational challenges associated with welding robots, including high initial investment costs and complex installation processes, pose significant hurdles for market growth. Despite these challenges, companies seeking to capitalize on this market opportunity can benefit from advanced technologies, such as collaborative robots and artificial intelligence, which enhance productivity and flexibility. Strategic partnerships and collaborations between robot manufacturers and end-users can also help mitigate operational challenges and drive market growth. Overall, the market presents a compelling opportunity for companies to streamline manufacturing processes, improve product quality, and gain a competitive edge In the global industrial landscape.
What will be the Size of the Market during the forecast period?
- The market is experiencing significant growth due to the increasing automation and rapid industrialization in manufacturing sectors, particularly in automotive manufacturing. This market is driven by the demand for high-quality welds, consistency, and higher production rates. Advanced technologies, such as Industrial Internet of Things (IIoT), cyber-physical systems, cloud robotics, and cloud computing, are revolutionizing the welding industry by enabling zero down time, real-time data analysis, and remote monitoring. Arc welding robots are increasingly being integrated with sensors, vision systems, and controls to ensure precision and accuracy in welding metal components using various processes, including Metal Inert Gas (MIG) and Tungsten Inert Gas (TIG).
- The integration of big data and advanced analytics is enabling manufacturers to optimize welding processes and improve performance. The market is expected to continue growing as the demand for automation and higher production rates in manufacturing industries persists.
How is this Industry segmented?
The industry research report provides comprehensive data (region-wise segment analysis), with forecasts and estimates in "USD million" for the period 2025-2029, as well as historical data from 2019-2023 for the following segments.
- Product
- Consumable method
- Non consumable method
- Application
- Automotive
- Electricals and electronics
- Aerospace and defense
- Others
- Type
- Greater than150 kilograms
- 50-150 kilograms
- Geography
- APAC
- Australia
- China
- India
- Japan
- South Korea
- Europe
- France
- Germany
- UK
- North America
- US
- Canada
- South America
- Middle East and Africa
- APAC
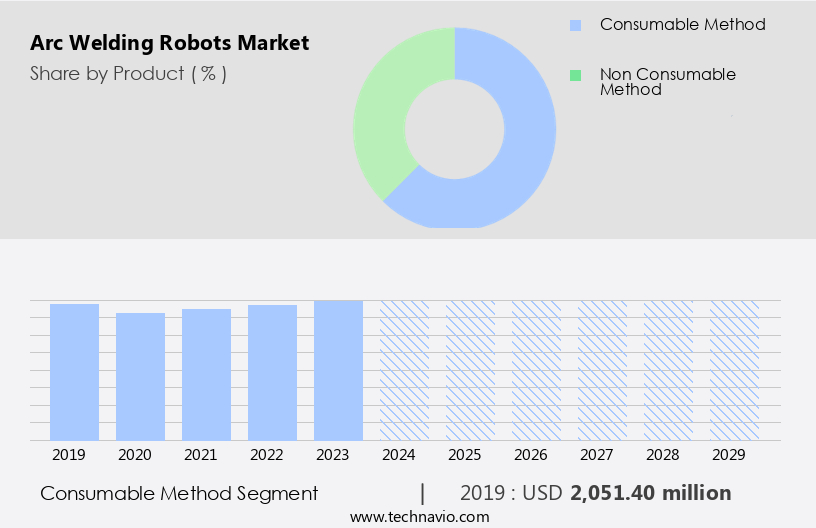
By Product Insights
The consumable method segment is estimated to witness significant growth during the forecast period. Arc welding robots have gained significant traction in various industries due to their ability to deliver high-quality, consistent, and high-speed welds. The automotive and transportation sectors, in particular, have embraced the use of welding robots for manufacturing processes, including automotive manufacture, construction, and general metal fabrication. These robots utilize advanced technologies such as the Industrial Internet of Things (IIoT), cyber-physical systems, cloud computing, big data, and zero down time automation. Welding processes, such as Metal Inert Gas (MIG) and Tungsten Inert Gas (TIG), are commonly used in arc welding robots. MIG welding uses a consumable wire electrode and a shielding gas to protect the weld pool, while TIG welding uses a non-consumable tungsten electrode and an inert gas to shield the weld area.
Get a glance at the market report of share of various segments Request Free Sample
The consumable method segment was valued at USD 2.05 billion in 2019 and showed a gradual increase during the forecast period.
Regional Analysis
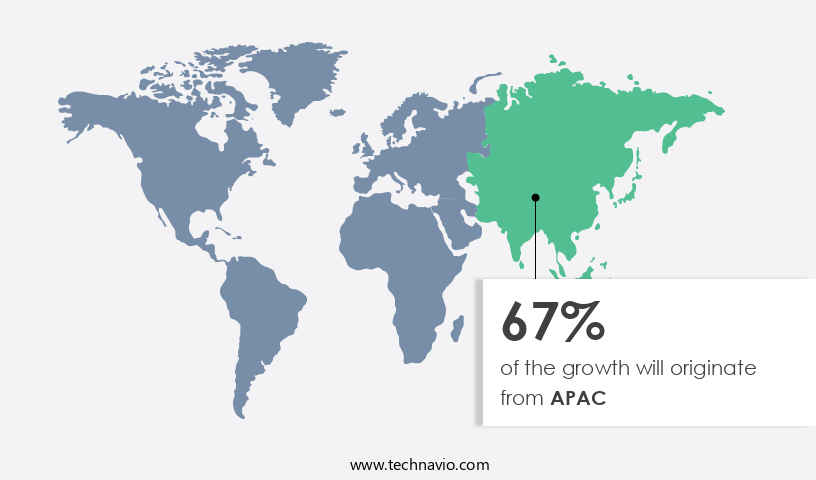
APAC is estimated to contribute 67% to the growth of the global market during the forecast period. Technavio's analysts have elaborately explained the regional trends and drivers that shape the market during the forecast period.
For more insights on the market size of various regions, Request Free Sample
The market in APAC is experiencing significant growth due to several factors. Government initiatives to promote industrial automation and the increasing demand for regionally manufactured automobiles are key drivers. In the automotive sector, manufacturers in countries like India and China are investing in welding robots to improve productivity and reduce cycle times, providing a competitive edge. The aerospace and defense industry in APAC is expanding due to increasing passenger and air cargo traffic, leading to the growth of low-cost carriers In the region. Additionally, the maintenance, repair, and operations (MRO) market is expected to grow, with Singapore and Malaysia serving as MRO hubs.
Market Dynamics
Our researchers analyzed the data with 2024 as the base year, along with the key drivers, trends, and challenges. A holistic analysis of drivers will help companies refine their marketing strategies to gain a competitive advantage.
What are the key market drivers leading to the rise In the adoption of Arc Welding Robots Industry?
- Growing popularity of industrial robots in APAC is the key driver of the market. The Asia Pacific region has become a significant player In the industrial robotics market due to the economic growth and expansion of the manufacturing sector. Industrial robots, including those used for welding, cutting, and assembly, have become essential in this region as they offer precision and productivity. Major contributors to the market are China, South Korea, and Japan.
- However, emerging economies like Singapore, Vietnam, and Malaysia are also witnessing a increase In the adoption of industrial robots. The increasing demand for automation and the need for cost-effective labor solutions are driving the growth of the industrial robotics market in APAC. This trend presents a lucrative opportunity for robot manufacturers to expand their sales and establish a strong presence in this region.
What are the market trends shaping the Arc Welding Robots Industry?
- Adoption of innovative business models is the upcoming market trend. Arc welding robots have gained significant traction In the manufacturing sector due to their ability to increase productivity and improve consistency in welding processes. Rental companies such as Hirebotics, Tokyo Century, and ORIX have entered the market, offering end-users a cost-effective solution for integrating robots into their manufacturing processes. These companies provide comprehensive services, including system analysis, deployment planning, programming support, maintenance, and repair. By renting robots, end-users can avoid the upfront costs of purchasing and installing the equipment and benefit from the latest technologies suitable for their industries.
- The monthly rental cost ranges from USD 1,300 to USD 1,800, making it an affordable option for businesses looking to automate their welding processes without incurring significant capital expenditures. Rental companies cover the installation expenses, simplifying the adoption process for end-users. This rental model allows businesses to focus on their core competencies while benefiting from the advantages of arc welding robots.
What challenges does the Arc Welding Robots Industry face during its growth?
- Operational challenges associated with welding robots. is a key challenge affecting the industry growth. Automated welding systems, utilizing welding robots, offer substantial returns on investment for repetitive tasks. The decision to automate welding hinges on several factors, including the nature of metal components and the desired level of repeatability.
- For applications involving small batch sizes and considerable gaps between parts, welding robots may encounter performance issues and extended welding durations. For instance, if the metal components have narrow access points, with a consistent gap of less than 0.5mm to 1mm, human operator involvement remains significant. Moreover, since welding robots are programmed for specific tasks, operators must manipulate robotic MIG guns when dealing with such access points.
Exclusive Customer Landscape
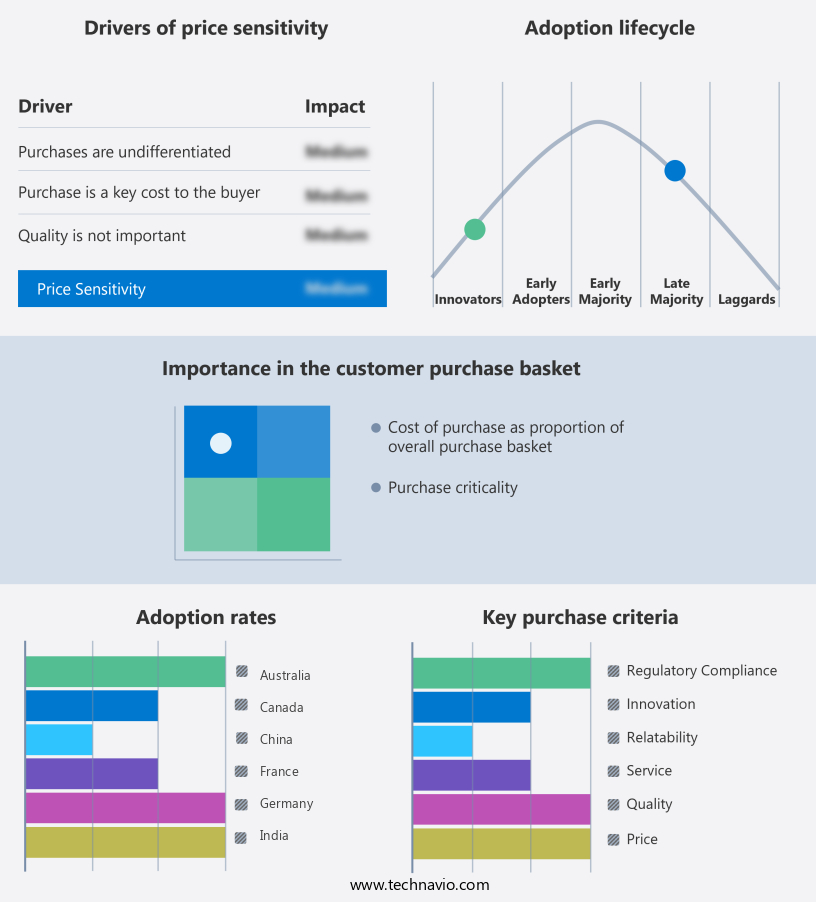
The market forecasting report includes the adoption lifecycle of the market, covering from the innovator's stage to the laggard's stage. It focuses on adoption rates in different regions based on penetration. Furthermore, the market report also includes key purchase criteria and drivers of price sensitivity to help companies evaluate and develop their market growth analysis strategies.
Customer Landscape
Key Companies & Market Insights
Companies are implementing various strategies, such as strategic alliances, market forecast, partnerships, mergers and acquisitions, geographical expansion, and product/service launches, to enhance their presence in the industry.
The industry research and growth report includes detailed analyses of the competitive landscape of the market and information about key companies, including:
- ABB Ltd.
- Arrowtek Robotic Pvt. Ltd.
- Carl Cloos Schweisstechnik GmbH
- Daihen Corp.
- FANUC Corp.
- Hyundai Motor Co.
- igm Robotersysteme AG
- Kawasaki Heavy Industries Ltd.
- Kemppi Oy
- MIDEA Group Co. Ltd.
- Miller Electric Manufacturing Co.
- NACHI FUJIKOSHI Corp.
- Panasonic Holdings Corp.
- Shanghai Genius Industrial Co. Ltd.
- SRDR Robotics
- Staubli International AG
- Stellantis NV
- Teradyne Inc.
- The Lincoln Electric Co.
- Yaskawa Electric Corp.
Qualitative and quantitative analysis of companies has been conducted to help clients understand the wider business environment as well as the strengths and weaknesses of key industry players. Data is qualitatively analyzed to categorize companies as pure play, category-focused, industry-focused, and diversified; it is quantitatively analyzed to categorize companies as dominant, leading, strong, tentative, and weak.
Research Analyst Overview
The market for welding robots has experienced significant growth in recent years, driven by the increasing adoption of Industrial IoT, cyber-physical systems, cloud robotics, and cloud computing in various industries. These technologies enable the integration of big data, zero downtime, and automation, leading to higher performance, accuracy, and repeatability in welding processes. Welding robots are finding extensive applications in automotive manufacture, construction, and general metal fabrication. Their deployment in hazardous situations and repetitive operations has resulted in increased safety and productivity. The technology's ability to produce high-quality welds with consistency and high speeds has led to higher production rates and cost savings for end-users.
Moreover, the welding industry's transition towards industrial automation and the use of industrial robotic systems is a response to the growing demand for efficient and cost-effective manufacturing processes. The industrial robot market, which includes arc welding robots, has seen a increase in installations, driven by the need to address labor costs and the shortage of skilled workers. Arc welding, a common welding process, uses an electric arc to melt metal, which is then solidified to form a weld. Two primary types of arc welding are Metal Inert Gas (MIG) and Tungsten Inert Gas (TIG) welding. MIG welding uses a consumable wire electrode, while TIG welding uses a non-consumable tungsten electrode.
Furthermore, both processes require precise control of the welding parameters to ensure consistent and high-quality welds. The integration of sensors, vision systems, and controls in welding robots has led to improved weld quality and increased productivity. These systems enable real-time monitoring of the welding process and allow for automatic adjustments to maintain optimal conditions. The adoption of welding robots is not limited to traditional industries such as automotive and transportation. Aerospace and shipbuilding are also increasingly adopting the technology to produce high-precision welds. The use of welding robots In these industries is essential due to the high value of the components being manufactured and the need for consistent quality.
In addition, the high initial investment required for the installation of welding robots and the need for significant financial resources are challenges that may hinder the adoption of the technology in emerging economies. However, the benefits of using welding robots, such as increased productivity, improved quality, and cost savings, are driving rapid industrialization In these regions. The technology's ability to produce high-quality welds with consistency, high speeds, and improved safety is driving its adoption in various industries, including automotive manufacture, construction, and general metal fabrication. Despite the high initial investment, the benefits of using welding robots are leading to increased productivity, improved quality, and cost savings for end-users.
|
Market Scope |
|
|
Report Coverage |
Details |
|
Page number |
221 |
|
Base year |
2024 |
|
Historic period |
2019-2023 |
|
Forecast period |
2025-2029 |
|
Growth momentum & CAGR |
Accelerate at a CAGR of 4.9% |
|
Market growth 2025-2029 |
USD 861.7 million |
|
Market structure |
Fragmented |
|
YoY growth 2024-2025(%) |
4.4 |
|
Key countries |
China, US, Japan, India, South Korea, Australia, UK, Germany, Canada, and France |
|
Competitive landscape |
Leading Companies, market growth and forecasting, Market Positioning of Companies, Competitive Strategies, and Industry Risks |
What are the Key Data Covered in this Market Research and Growth Report?
- CAGR of the Arc Welding Robots industry during the forecast period
- Detailed information on factors that will drive the growth and forecasting between 2025 and 2029
- Precise estimation of the size of the market and its contribution of the industry in focus to the parent market
- Accurate predictions about upcoming growth and trends and changes in consumer behaviour
- Growth of the market across APAC, Europe, North America, South America, and Middle East and Africa
- Thorough analysis of the market's competitive landscape and detailed information about companies
- Comprehensive analysis of factors that will challenge the market growth of industry companies
We can help! Our analysts can customize this market research report to meet your requirements.
 RIA -
RIA - 
