Artificial Intelligence-based Personalization Market Analysis, Size, and Forecast 2026-2030: APAC (China, Japan, and India), North America (US, Canada, and Mexico), Europe (Germany, UK, and France), South America (Brazil and Argentina), Middle East and Africa (Saudi Arabia, UAE, and South Africa), and Rest of World (ROW)

Artificial Intelligence-based Personalization Market Analysis, Size, and Forecast 2026-2030:
APAC (China, Japan, and India), North America (US, Canada, and Mexico), Europe (Germany, UK, and France), South America (Brazil and Argentina), Middle East and Africa (Saudi Arabia, UAE, and South Africa), and Rest of World (ROW)

Published: Mar 2026 309 Pages SKU: IRTNTR71852

Market Overview at a Glance

$3.71 B
Market Opportunity
19.8%
CAGR 2025 - 2030
37.1%
APAC Growth
$747.3 Mn
Website personalization segment 2024

Artificial Intelligence-based Personalization Market Size 2026-2030

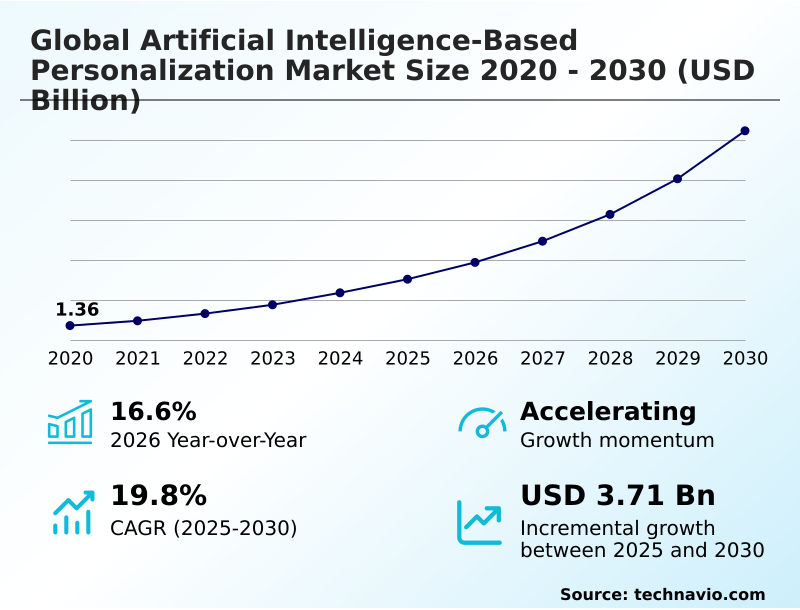
The artificial intelligence-based personalization market size is valued to increase by USD 3.71 billion, at a CAGR of 19.8% from 2025 to 2030. Growing availability of customer behavioral data will drive the artificial intelligence-based personalization market.

Major Market Trends & Insights

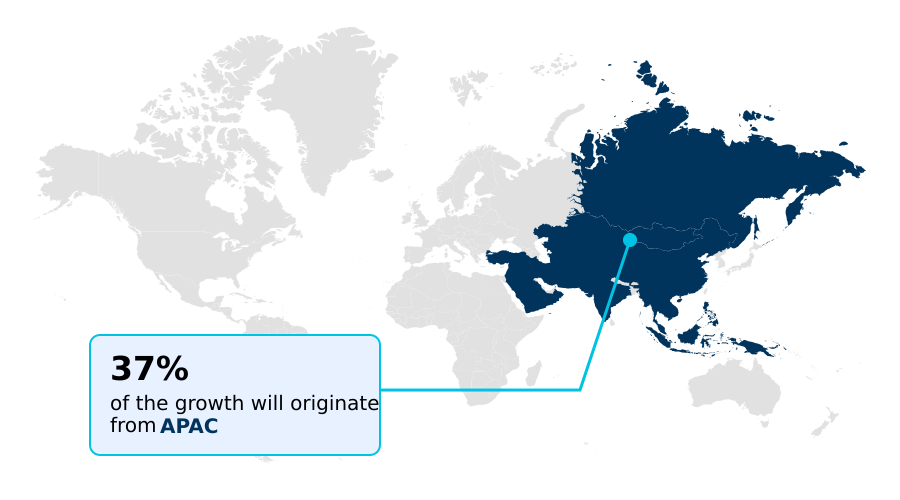
  • APAC dominated the market and accounted for a 37.1% growth during the forecast period.
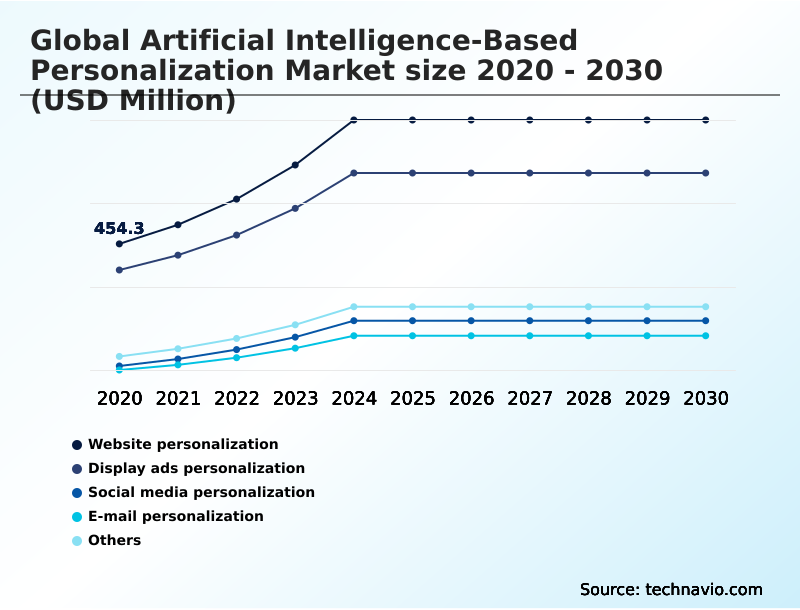
  • By Application - Website personalization segment was valued at USD 747.3 million in 2024
  • By Technology - Machine learning and deep learning segment accounted for the largest market revenue share in 2024

Market Size & Forecast

  • Market Opportunities: USD 4.87 billion
  • Market Future Opportunities: USD 3.71 billion
  • CAGR from 2025 to 2030 : 19.8%

Market Summary

  • The artificial intelligence-based personalization market is defined by its transition toward proactive, autonomous systems that anticipate user needs. This evolution is driven by the integration of sophisticated machine learning models that deliver bespoke consumer experiences at an unprecedented scale. By synthesizing vast quantities of behavioral data, organizations can now execute hyper-personalization strategies that understand intent before it is explicitly stated.
  • For instance, a retail enterprise can leverage AI to synchronize in-store inventory levels with localized social media trends and individual consumer browsing histories, allowing for hyper-localized product assortments. This reduces overhead costs associated with unsold stock and enhances operational efficiency.
  • However, the industry grapples with significant challenges related to data privacy and the potential for algorithmic bias, which can undermine consumer trust. The push for localized and secure intelligence has led to a surge in on-device processing capabilities, ensuring user privacy remains a central tenet of the personalization journey.
  • The market's trajectory suggests that the seamless integration of these technologies into everyday workflows, balanced with strong ethical governance, will remain a primary catalyst for long-term strategic growth.

What will be the Size of the Artificial Intelligence-based Personalization Market during the forecast period?

Get Key Insights on Market Forecast (PDF) Request Free Sample

How is the Artificial Intelligence-based Personalization Market Segmented?

The artificial intelligence-based personalization industry research report provides comprehensive data (region-wise segment analysis), with forecasts and estimates in "USD million" for the period 2026-2030, as well as historical data from 2020-2024 for the following segments.

  • Application
    • Website personalization
    • Display ads personalization
    • Social media personalization
    • E-mail personalization
    • Others
  • Technology
    • Machine learning and deep learning
    • Natural language processing
  • End-user
    • Enterprises
    • Individuals
  • Geography
    • APAC
      • China
      • Japan
      • India
    • North America
      • US
      • Canada
      • Mexico
    • Europe
      • Germany
      • UK
      • France
    • South America
      • Brazil
      • Argentina
    • Middle East and Africa
      • Saudi Arabia
      • UAE
      • South Africa
    • Rest of World (ROW)

By Application Insights

The website personalization segment is estimated to witness significant growth during the forecast period.

The website personalization segment is shifting toward holistic environment adaptation. Deployment of reinforcement learning models facilitates adaptive user journeys, where predictive surfacing technology anticipates needs before a user performs a search.

This is achieved through dynamic content rendering and sophisticated conversational AI agents that guide user interactions. Organizations are leveraging autonomous copywriting assistants and dynamic creative optimization to deliver bespoke landing pages, with predictive creative optimization fine-tuning visuals in real time.

These systems, often run in private cloud environments, use emotional-indexing features to tailor experiences.

The successful deployment of a neural network-based recommendation engine that synchronized cross-device data led to a reported 15% increase in average order value for a major retail entity, demonstrating the direct impact of these technologies.

Request Free Sample

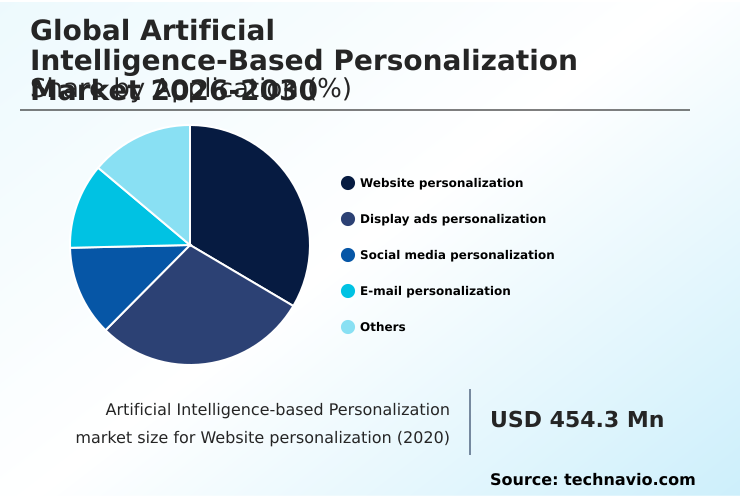
The Website personalization segment was valued at USD 747.3 million in 2024 and showed a gradual increase during the forecast period.

Request Free Sample

Regional Analysis

APAC is estimated to contribute 37.1% to the growth of the global market during the forecast period.Technavio’s analysts have elaborately explained the regional trends and drivers that shape the market during the forecast period.

See How Artificial Intelligence-based Personalization Market Demand is Rising in APAC Request Free Sample

The market's geographic landscape is characterized by distinct regional dynamics. North America continues to lead in investment, while the APAC region is the fastest-growing market, expanding at over 20% annually.

In APAC, the use of natural language processing (NLP) to support diverse local languages is critical for achieving hyper-localized product assortments and effective micro-segmentation strategies.

Enterprises in this region leverage intelligent virtual assistants and visual search AI to cater to mobile-first economies. In Europe, a focus on regulatory compliance drives the adoption of sovereign AI solutions.

Across all regions, computer vision algorithms are enhancing digital experience personalization, while autonomous bidding systems optimize advertising spend.

The deployment of customer engagement AI, alongside technologies like AI-driven menu recommendations, helps businesses secure a competitive advantage by delivering superior, tailored experiences that boost customer lifetime value by over 15%.

Market Dynamics

Our researchers analyzed the data with 2025 as the base year, along with the key drivers, trends, and challenges. A holistic analysis of drivers will help companies refine their marketing strategies to gain a competitive advantage.

  • The practical applications of advanced AI are reshaping business operations and customer interactions across multiple sectors. The use of generative AI for hyper-personalized recommendations is becoming a standard in e-commerce, driving engagement by creating unique user journeys. In parallel, the push for edge AI for faster on-device personalization is enhancing mobile experiences and strengthening data privacy.
  • This trend is complemented by multimodal personalization in augmented reality, which blends digital content with the physical world for immersive shopping. AI-driven dynamic pricing strategies are enabling retailers to respond to market conditions in real time, while natural language processing for conversational AI powers sophisticated chatbots that improve customer service.
  • Businesses are successfully reducing customer churn with predictive AI, sometimes by double-digit percentages compared to legacy methods. In finance, AI for personalized financial wellness advice is empowering consumers, just as AI for creating personalized healthcare plans is revolutionizing patient care.
  • The operational benefits are significant; AI-powered supply chain inventory optimization and AI-based predictive inventory management have been shown to reduce holding costs by more than double the rate of traditional forecasting. Other key applications include optimizing advertising spend with AI personalization, voice-activated personalization in smart homes, and real-time sentiment analysis for ad targeting.
  • The ecosystem is further supported by AI for adaptive e-learning platform content, AI-driven fraud detection and prevention, and federated learning for user data privacy. For B2B contexts, AI for B2B sales lead scoring is critical, while visual search for e-commerce product discovery and automated content generation for email marketing are transforming digital retail.
  • Even logistics benefits from personalized route planning with commute AI.

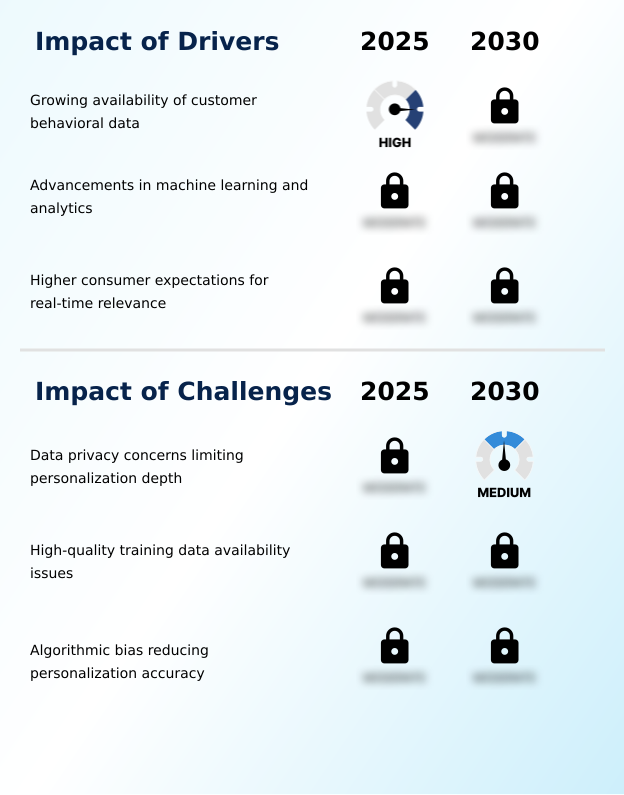
What are the key market drivers leading to the rise in the adoption of Artificial Intelligence-based Personalization Industry?

  • The growing availability of rich customer behavioral data across digital platforms is a key driver for the artificial intelligence-based personalization market.

  • Market growth is fundamentally driven by advancements in data processing and machine learning. The increasing availability of behavioral data, managed through sophisticated customer data platforms (CDP), provides the fuel for deep learning architectures and predictive modeling architectures.
  • These technologies enable real-time recommendation systems that deliver immediate, relevant content. The adoption of streaming data processing and automated feature engineering allows personalization platforms to operate at unprecedented scale and speed, improving model accuracy by over 25% in some applications.
  • This creates behavioral reinforcement loops that continuously refine outcomes. As consumers demand seamless omnichannel personalization and tailored interactions via personalized CRM experiences, businesses are investing in advanced customer intelligence solutions and individual cadence management to enhance engagement and loyalty.
  • The ability to transform vast data streams into actionable insights remains a primary catalyst for market expansion.

What are the market trends shaping the Artificial Intelligence-based Personalization Industry?

  • Hyper-personalized recommendations powered by generative AI represent a significant upcoming market trend. This evolution shifts personalization from reactive suggestions to proactive, context-aware user guidance.

  • Key market trends are centered on the shift toward more intelligent and autonomous systems. The integration of generative AI models powers hyper-personalization engines, enabling a new level of anticipatory personalization where systems predict user needs. This is complemented by the rise of agentic AI frameworks and agentic commerce platforms, which automate complex, multi-step user tasks.
  • Another significant trend is the move toward on-device personalization through edge AI deployment, which ensures faster, more secure, context-aware user experiences. This approach supports multimodal AI integration, allowing multimodal recommendation engines to process voice, text, and visual inputs for richer interactions. The use of psychographic profiling is also becoming more sophisticated, allowing for deeper user understanding.
  • These advancements are driving a market where personalization is not just reactive but proactive, with on-device processing capabilities reducing latency by up to 40%.

What challenges does the Artificial Intelligence-based Personalization Industry face during its growth?

  • Data privacy concerns and stringent regulations present a key challenge, limiting the depth of personalization achievable by restricting data collection and processing.

  • Despite strong growth drivers, the market faces significant challenges, primarily centered on data privacy and algorithmic integrity. Growing regulatory pressures necessitate privacy-aware personalization and the adoption of privacy-preserving personalization techniques, such as federated learning frameworks. Organizations are increasingly building sovereign AI solutions to maintain data control.
  • A key hurdle is the availability of high-quality training data; without it, artificial neural networks and transformer-based models can produce biased or inaccurate outcomes, undermining content discovery engines. This has led to a greater emphasis on zero-party data integration and the use of explainable AI (XAI) systems to ensure fairness and transparency.
  • The risk of flawed emotional AI analysis leading to poor user experiences remains a concern, with biased models shown to reduce engagement by up to 30%. Addressing these challenges is critical for building trust and ensuring the sustainable growth of applications like proactive wellness management.

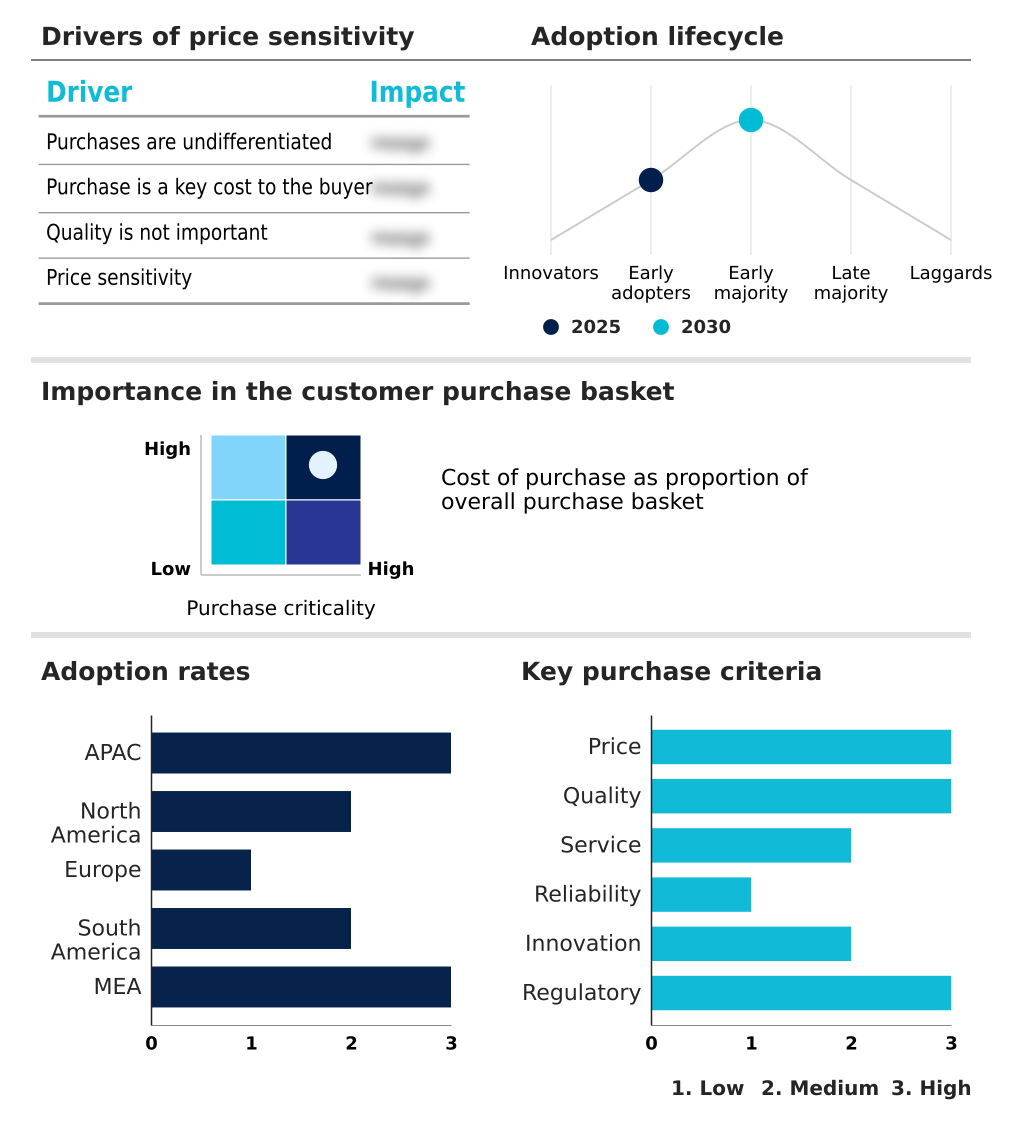
Exclusive Technavio Analysis on Customer Landscape

The artificial intelligence-based personalization market forecasting report includes the adoption lifecycle of the market, covering from the innovator’s stage to the laggard’s stage. It focuses on adoption rates in different regions based on penetration. Furthermore, the artificial intelligence-based personalization market report also includes key purchase criteria and drivers of price sensitivity to help companies evaluate and develop their market growth analysis strategies.

Customer Landscape of Artificial Intelligence-based Personalization Industry

Competitive Landscape

Companies are implementing various strategies, such as strategic alliances, artificial intelligence-based personalization market forecast, partnerships, mergers and acquisitions, geographical expansion, and product/service launches, to enhance their presence in the industry.

Accenture Plc - Key offerings focus on AI-driven customer experience solutions and advanced personalization platforms, designed to enhance user engagement and deliver tailored digital interactions.

The industry research and growth report includes detailed analyses of the competitive landscape of the market and information about key companies, including:

  • Accenture Plc
  • Adobe Inc.
  • Amazon.com Inc.
  • Apple Inc.
  • BloomReach Inc.
  • Blueshift Labs Inc.
  • Bounteous X Accolite
  • Crownpeak Technology Inc.
  • Google LLC
  • H2O.ai Inc.
  • IBM Corp.
  • Infinite Analytics Inc.
  • McDonald Corp.
  • Microsoft Corp.
  • mParticle Inc.
  • Salesforce Inc.
  • Sitecore Holding Ltd.
  • Verint Systems Inc.
  • ViSenze Pte. Ltd.
  • ZS Associates Inc.

Qualitative and quantitative analysis of companies has been conducted to help clients understand the wider business environment as well as the strengths and weaknesses of key industry players. Data is qualitatively analyzed to categorize companies as pure play, category-focused, industry-focused, and diversified; it is quantitatively analyzed to categorize companies as dominant, leading, strong, tentative, and weak.

Recent Development and News in Artificial intelligence-based personalization market

  • In May 2025, MarTech Innovators Inc. released a new suite of tools using predictive analytics to determine optimal email send times for individual subscribers, reportedly reducing unsubscribe rates.
  • In March 2025, OmniRetail Corp. reported a significant increase in average order value after deploying a neural network-based recommendation engine that synchronized cross-device browsing data.
  • In March 2025, Adobe Inc. unveiled Adobe Experience Platform Agents at its summit, integrating generative and agentic AI to automate tasks like data cleansing and real-time website optimization.
  • In February 2025, StreamVerse Platforms launched an emotional-indexing feature that adjusts content recommendations based on perceived user mood, analyzed through interaction patterns.

Dive into Technavio’s robust research methodology, blending expert interviews, extensive data synthesis, and validated models for unparalleled Artificial Intelligence-based Personalization Market insights. See full methodology.

Market Scope
Page number 309
Base year 2025
Historic period 2020-2024
Forecast period 2026-2030
Growth momentum & CAGR Accelerate at a CAGR of 19.8%
Market growth 2026-2030 USD 3707.6 million
Market structure Fragmented
YoY growth 2025-2026(%) 16.6%
Key countries China, Japan, India, South Korea, Australia, Indonesia, US, Canada, Mexico, Germany, UK, France, Italy, Spain, The Netherlands, Brazil, Argentina, Chile, Saudi Arabia, UAE, South Africa, Israel and Turkey
Competitive landscape Leading Companies, Market Positioning of Companies, Competitive Strategies, and Industry Risks

Request Free Sample

Research Analyst Overview

  • The market is rapidly maturing, moving beyond basic algorithms to implement sophisticated deep learning architectures and predictive modeling architectures. A key boardroom-level focus is the integration of agentic AI frameworks, which requires strategic decisions balancing innovation with compliance.
  • These systems leverage reinforcement learning models, generative AI models, and artificial neural networks to create hyper-personalization engines that manage adaptive user journeys and real-time recommendation systems. Technologies like natural language processing (NLP), computer vision algorithms, and emotional AI analysis are crucial components.
  • The adoption of explainable AI (XAI) systems is vital for transparency, with data showing it can accelerate regulatory approvals by up to 20% in sensitive sectors. Firms are utilizing customer data platforms (CDP) for micro-segmentation strategies, enabling dynamic content rendering and predictive surfacing technology.
  • The landscape is further shaped by edge AI deployment, multimodal AI integration, and the use of transformer-based models and federated learning frameworks. Innovations such as autonomous copywriting assistants, streaming data processing, automated feature engineering, autonomous bidding systems, and psychographic profiling are enabling more precise content discovery engines, driving the industry's evolution.

What are the Key Data Covered in this Artificial Intelligence-based Personalization Market Research and Growth Report?

  • What is the expected growth of the Artificial Intelligence-based Personalization Market between 2026 and 2030?

    • USD 3.71 billion, at a CAGR of 19.8%

  • What segmentation does the market report cover?

    • The report is segmented by Application (Website personalization, Display ads personalization, Social media personalization, E-mail personalization, and Others), Technology (Machine learning and deep learning, and Natural language processing), End-user (Enterprises, and Individuals) and Geography (APAC, North America, Europe, South America, Middle East and Africa)

  • Which regions are analyzed in the report?

    • APAC, North America, Europe, South America and Middle East and Africa

  • What are the key growth drivers and market challenges?

    • Growing availability of customer behavioral data, Data privacy concerns limiting personalization depth

  • Who are the major players in the Artificial Intelligence-based Personalization Market?

    • Accenture Plc, Adobe Inc., Amazon.com Inc., Apple Inc., BloomReach Inc., Blueshift Labs Inc., Bounteous X Accolite, Crownpeak Technology Inc., Google LLC, H2O.ai Inc., IBM Corp., Infinite Analytics Inc., McDonald Corp., Microsoft Corp., mParticle Inc., Salesforce Inc., Sitecore Holding Ltd., Verint Systems Inc., ViSenze Pte. Ltd. and ZS Associates Inc.

Market Research Insights

  • The market's momentum is tied to measurable business outcomes derived from advanced personalization strategies. The adoption of anticipatory personalization is enabling firms to achieve conversion rate increases of up to 20%. Similarly, implementing omnichannel personalization creates seamless user experiences, contributing to a 25% improvement in customer retention.
  • The focus on proactive wellness management in health-tech and privacy-preserving personalization in finance demonstrates the diverse applications of these technologies. Through intelligent virtual assistants and agentic commerce platforms, businesses are automating complex interactions, while zero-party data integration enriches customer profiles.
  • This strategic application of context-aware user experiences, enhanced by emotional-indexing features and individual cadence management, ensures that digital engagement remains relevant and effective, ultimately driving higher return on investment.

We can help! Our analysts can customize this artificial intelligence-based personalization market research report to meet your requirements.

Get in touch

1. Executive Summary

1.1 Market overview

Executive Summary - Chart on Market Overview
Executive Summary - Data Table on Market Overview
Executive Summary - Chart on Global Market Characteristics
Executive Summary - Chart on Market by Geography
Executive Summary - Chart on Market Segmentation by Application
Executive Summary - Chart on Market Segmentation by Technology
Executive Summary - Chart on Market Segmentation by End-user
Executive Summary - Chart on Incremental Growth
Executive Summary - Data Table on Incremental Growth
Executive Summary - Chart on Company Market Positioning

2. Technavio Analysis

2.1 Analysis of price sensitivity, lifecycle, customer purchase basket, adoption rates, and purchase criteria

2.2 Criticality of inputs and Factors of differentiation

Chart on Overview on criticality of inputs and factors of differentiation

2.3 Factors of disruption

Chart on Overview on factors of disruption

2.4 Impact of drivers and challenges

Chart on Impact of drivers and challenges in 2025 and 2030

3. Market Landscape

3.1 Market ecosystem

Chart on Parent Market
Data Table on - Parent Market

3.2 Market characteristics

Chart on Market characteristics analysis

3.3 Value chain analysis

Chart on Value chain analysis

4. Market Sizing

4.1 Market definition

Data Table on Offerings of companies included in the market definition

4.2 Market segment analysis

Market segments

4.3 Market size 2025

4.4 Market outlook: Forecast for 2025-2030

Chart on Global - Market size and forecast 2025-2030 ($ million)
Data Table on Global - Market size and forecast 2025-2030 ($ million)
Chart on Global Market: Year-over-year growth 2025-2030 (%)
Data Table on Global Market: Year-over-year growth 2025-2030 (%)

5. Historic Market Size

5.1 Global Artificial Intelligence-Based Personalization Market 2020 - 2024

Historic Market Size - Data Table on Global Artificial Intelligence-Based Personalization Market 2020 - 2024 ($ million)

5.2 Application segment analysis 2020 - 2024

Historic Market Size - Application Segment 2020 - 2024 ($ million)

5.3 Technology segment analysis 2020 - 2024

Historic Market Size - Technology Segment 2020 - 2024 ($ million)

5.4 End-user segment analysis 2020 - 2024

Historic Market Size - End-user Segment 2020 - 2024 ($ million)

5.5 Geography segment analysis 2020 - 2024

Historic Market Size - Geography Segment 2020 - 2024 ($ million)

5.6 Country segment analysis 2020 - 2024

Historic Market Size - Country Segment 2020 - 2024 ($ million)

6. Qualitative Analysis

6.1 AI Impact on Global Artificial Intelligence-Based Personalization Market

6.2 Impact of Geopolitical Conflicts on Global Artificial Intelligence-Based Personalization Market

7. Five Forces Analysis

7.1 Five forces summary

Five forces analysis - Comparison between 2025 and 2030

7.2 Bargaining power of buyers

Bargaining power of buyers - Impact of key factors 2025 and 2030

7.3 Bargaining power of suppliers

Bargaining power of suppliers - Impact of key factors in 2025 and 2030

7.4 Threat of new entrants

Threat of new entrants - Impact of key factors in 2025 and 2030

7.5 Threat of substitutes

Threat of substitutes - Impact of key factors in 2025 and 2030

7.6 Threat of rivalry

Threat of rivalry - Impact of key factors in 2025 and 2030

7.7 Market condition

Chart on Market condition - Five forces 2025 and 2030

8. Market Segmentation by Application

8.1 Market segments

Chart on Application - Market share 2025-2030 (%)
Data Table on Application - Market share 2025-2030 (%)

8.2 Comparison by Application

Chart on Comparison by Application
Data Table on Comparison by Application

8.3 Website personalization - Market size and forecast 2025-2030

Chart on Website personalization - Market size and forecast 2025-2030 ($ million)
Data Table on Website personalization - Market size and forecast 2025-2030 ($ million)
Chart on Website personalization - Year-over-year growth 2025-2030 (%)
Data Table on Website personalization - Year-over-year growth 2025-2030 (%)

8.4 Display ads personalization - Market size and forecast 2025-2030

Chart on Display ads personalization - Market size and forecast 2025-2030 ($ million)
Data Table on Display ads personalization - Market size and forecast 2025-2030 ($ million)
Chart on Display ads personalization - Year-over-year growth 2025-2030 (%)
Data Table on Display ads personalization - Year-over-year growth 2025-2030 (%)

8.5 Social media personalization - Market size and forecast 2025-2030

Chart on Social media personalization - Market size and forecast 2025-2030 ($ million)
Data Table on Social media personalization - Market size and forecast 2025-2030 ($ million)
Chart on Social media personalization - Year-over-year growth 2025-2030 (%)
Data Table on Social media personalization - Year-over-year growth 2025-2030 (%)

8.6 E-mail personalization - Market size and forecast 2025-2030

Chart on E-mail personalization - Market size and forecast 2025-2030 ($ million)
Data Table on E-mail personalization - Market size and forecast 2025-2030 ($ million)
Chart on E-mail personalization - Year-over-year growth 2025-2030 (%)
Data Table on E-mail personalization - Year-over-year growth 2025-2030 (%)

8.7 Others - Market size and forecast 2025-2030

Chart on Others - Market size and forecast 2025-2030 ($ million)
Data Table on Others - Market size and forecast 2025-2030 ($ million)
Chart on Others - Year-over-year growth 2025-2030 (%)
Data Table on Others - Year-over-year growth 2025-2030 (%)

8.8 Market opportunity by Application

Market opportunity by Application ($ million)
Data Table on Market opportunity by Application ($ million)

9. Market Segmentation by Technology

9.1 Market segments

Chart on Technology - Market share 2025-2030 (%)
Data Table on Technology - Market share 2025-2030 (%)

9.2 Comparison by Technology

Chart on Comparison by Technology
Data Table on Comparison by Technology

9.3 Machine learning and deep learning - Market size and forecast 2025-2030

Chart on Machine learning and deep learning - Market size and forecast 2025-2030 ($ million)
Data Table on Machine learning and deep learning - Market size and forecast 2025-2030 ($ million)
Chart on Machine learning and deep learning - Year-over-year growth 2025-2030 (%)
Data Table on Machine learning and deep learning - Year-over-year growth 2025-2030 (%)

9.4 Natural language processing - Market size and forecast 2025-2030

Chart on Natural language processing - Market size and forecast 2025-2030 ($ million)
Data Table on Natural language processing - Market size and forecast 2025-2030 ($ million)
Chart on Natural language processing - Year-over-year growth 2025-2030 (%)
Data Table on Natural language processing - Year-over-year growth 2025-2030 (%)

9.5 Market opportunity by Technology

Market opportunity by Technology ($ million)
Data Table on Market opportunity by Technology ($ million)

10. Market Segmentation by End-user

10.1 Market segments

Chart on End-user - Market share 2025-2030 (%)
Data Table on End-user - Market share 2025-2030 (%)

10.2 Comparison by End-user

Chart on Comparison by End-user
Data Table on Comparison by End-user

10.3 Enterprises - Market size and forecast 2025-2030

Chart on Enterprises - Market size and forecast 2025-2030 ($ million)
Data Table on Enterprises - Market size and forecast 2025-2030 ($ million)
Chart on Enterprises - Year-over-year growth 2025-2030 (%)
Data Table on Enterprises - Year-over-year growth 2025-2030 (%)

10.4 Individuals - Market size and forecast 2025-2030

Chart on Individuals - Market size and forecast 2025-2030 ($ million)
Data Table on Individuals - Market size and forecast 2025-2030 ($ million)
Chart on Individuals - Year-over-year growth 2025-2030 (%)
Data Table on Individuals - Year-over-year growth 2025-2030 (%)

10.5 Market opportunity by End-user

Market opportunity by End-user ($ million)
Data Table on Market opportunity by End-user ($ million)

11. Customer Landscape

11.1 Customer landscape overview

Analysis of price sensitivity, lifecycle, customer purchase basket, adoption rates, and purchase criteria

12. Geographic Landscape

12.1 Geographic segmentation

Chart on Market share by geography 2025-2030 (%)
Data Table on Market share by geography 2025-2030 (%)

12.2 Geographic comparison

Chart on Geographic comparison
Data Table on Geographic comparison

12.3 APAC - Market size and forecast 2025-2030

Chart on APAC - Market size and forecast 2025-2030 ($ million)
Data Table on APAC - Market size and forecast 2025-2030 ($ million)
Chart on APAC - Year-over-year growth 2025-2030 (%)
Data Table on APAC - Year-over-year growth 2025-2030 (%)
Chart on Regional Comparison - APAC
Data Table on Regional Comparison - APAC

12.3.1 China - Market size and forecast 2025-2030

Chart on China - Market size and forecast 2025-2030 ($ million)
Data Table on China - Market size and forecast 2025-2030 ($ million)
Chart on China - Year-over-year growth 2025-2030 (%)
Data Table on China - Year-over-year growth 2025-2030 (%)

12.3.2 Japan - Market size and forecast 2025-2030

Chart on Japan - Market size and forecast 2025-2030 ($ million)
Data Table on Japan - Market size and forecast 2025-2030 ($ million)
Chart on Japan - Year-over-year growth 2025-2030 (%)
Data Table on Japan - Year-over-year growth 2025-2030 (%)

12.3.3 India - Market size and forecast 2025-2030

Chart on India - Market size and forecast 2025-2030 ($ million)
Data Table on India - Market size and forecast 2025-2030 ($ million)
Chart on India - Year-over-year growth 2025-2030 (%)
Data Table on India - Year-over-year growth 2025-2030 (%)

12.3.4 South Korea - Market size and forecast 2025-2030

Chart on South Korea - Market size and forecast 2025-2030 ($ million)
Data Table on South Korea - Market size and forecast 2025-2030 ($ million)
Chart on South Korea - Year-over-year growth 2025-2030 (%)
Data Table on South Korea - Year-over-year growth 2025-2030 (%)

12.3.5 Australia - Market size and forecast 2025-2030

Chart on Australia - Market size and forecast 2025-2030 ($ million)
Data Table on Australia - Market size and forecast 2025-2030 ($ million)
Chart on Australia - Year-over-year growth 2025-2030 (%)
Data Table on Australia - Year-over-year growth 2025-2030 (%)

12.3.6 Indonesia - Market size and forecast 2025-2030

Chart on Indonesia - Market size and forecast 2025-2030 ($ million)
Data Table on Indonesia - Market size and forecast 2025-2030 ($ million)
Chart on Indonesia - Year-over-year growth 2025-2030 (%)
Data Table on Indonesia - Year-over-year growth 2025-2030 (%)

12.4 North America - Market size and forecast 2025-2030

Chart on North America - Market size and forecast 2025-2030 ($ million)
Data Table on North America - Market size and forecast 2025-2030 ($ million)
Chart on North America - Year-over-year growth 2025-2030 (%)
Data Table on North America - Year-over-year growth 2025-2030 (%)
Chart on Regional Comparison - North America
Data Table on Regional Comparison - North America

12.4.1 US - Market size and forecast 2025-2030

Chart on US - Market size and forecast 2025-2030 ($ million)
Data Table on US - Market size and forecast 2025-2030 ($ million)
Chart on US - Year-over-year growth 2025-2030 (%)
Data Table on US - Year-over-year growth 2025-2030 (%)

12.4.2 Canada - Market size and forecast 2025-2030

Chart on Canada - Market size and forecast 2025-2030 ($ million)
Data Table on Canada - Market size and forecast 2025-2030 ($ million)
Chart on Canada - Year-over-year growth 2025-2030 (%)
Data Table on Canada - Year-over-year growth 2025-2030 (%)

12.4.3 Mexico - Market size and forecast 2025-2030

Chart on Mexico - Market size and forecast 2025-2030 ($ million)
Data Table on Mexico - Market size and forecast 2025-2030 ($ million)
Chart on Mexico - Year-over-year growth 2025-2030 (%)
Data Table on Mexico - Year-over-year growth 2025-2030 (%)

12.5 Europe - Market size and forecast 2025-2030

Chart on Europe - Market size and forecast 2025-2030 ($ million)
Data Table on Europe - Market size and forecast 2025-2030 ($ million)
Chart on Europe - Year-over-year growth 2025-2030 (%)
Data Table on Europe - Year-over-year growth 2025-2030 (%)
Chart on Regional Comparison - Europe
Data Table on Regional Comparison - Europe

12.5.1 Germany - Market size and forecast 2025-2030

Chart on Germany - Market size and forecast 2025-2030 ($ million)
Data Table on Germany - Market size and forecast 2025-2030 ($ million)
Chart on Germany - Year-over-year growth 2025-2030 (%)
Data Table on Germany - Year-over-year growth 2025-2030 (%)

12.5.2 UK - Market size and forecast 2025-2030

Chart on UK - Market size and forecast 2025-2030 ($ million)
Data Table on UK - Market size and forecast 2025-2030 ($ million)
Chart on UK - Year-over-year growth 2025-2030 (%)
Data Table on UK - Year-over-year growth 2025-2030 (%)

12.5.3 France - Market size and forecast 2025-2030

Chart on France - Market size and forecast 2025-2030 ($ million)
Data Table on France - Market size and forecast 2025-2030 ($ million)
Chart on France - Year-over-year growth 2025-2030 (%)
Data Table on France - Year-over-year growth 2025-2030 (%)

12.5.4 Italy - Market size and forecast 2025-2030

Chart on Italy - Market size and forecast 2025-2030 ($ million)
Data Table on Italy - Market size and forecast 2025-2030 ($ million)
Chart on Italy - Year-over-year growth 2025-2030 (%)
Data Table on Italy - Year-over-year growth 2025-2030 (%)

12.5.5 Spain - Market size and forecast 2025-2030

Chart on Spain - Market size and forecast 2025-2030 ($ million)
Data Table on Spain - Market size and forecast 2025-2030 ($ million)
Chart on Spain - Year-over-year growth 2025-2030 (%)
Data Table on Spain - Year-over-year growth 2025-2030 (%)

12.5.6 The Netherlands - Market size and forecast 2025-2030

Chart on The Netherlands - Market size and forecast 2025-2030 ($ million)
Data Table on The Netherlands - Market size and forecast 2025-2030 ($ million)
Chart on The Netherlands - Year-over-year growth 2025-2030 (%)
Data Table on The Netherlands - Year-over-year growth 2025-2030 (%)

12.6 South America - Market size and forecast 2025-2030

Chart on South America - Market size and forecast 2025-2030 ($ million)
Data Table on South America - Market size and forecast 2025-2030 ($ million)
Chart on South America - Year-over-year growth 2025-2030 (%)
Data Table on South America - Year-over-year growth 2025-2030 (%)
Chart on Regional Comparison - South America
Data Table on Regional Comparison - South America

12.6.1 Brazil - Market size and forecast 2025-2030

Chart on Brazil - Market size and forecast 2025-2030 ($ million)
Data Table on Brazil - Market size and forecast 2025-2030 ($ million)
Chart on Brazil - Year-over-year growth 2025-2030 (%)
Data Table on Brazil - Year-over-year growth 2025-2030 (%)

12.6.2 Argentina - Market size and forecast 2025-2030

Chart on Argentina - Market size and forecast 2025-2030 ($ million)
Data Table on Argentina - Market size and forecast 2025-2030 ($ million)
Chart on Argentina - Year-over-year growth 2025-2030 (%)
Data Table on Argentina - Year-over-year growth 2025-2030 (%)

12.6.3 Chile - Market size and forecast 2025-2030

Chart on Chile - Market size and forecast 2025-2030 ($ million)
Data Table on Chile - Market size and forecast 2025-2030 ($ million)
Chart on Chile - Year-over-year growth 2025-2030 (%)
Data Table on Chile - Year-over-year growth 2025-2030 (%)

12.7 Middle East and Africa - Market size and forecast 2025-2030

Chart on Middle East and Africa - Market size and forecast 2025-2030 ($ million)
Data Table on Middle East and Africa - Market size and forecast 2025-2030 ($ million)
Chart on Middle East and Africa - Year-over-year growth 2025-2030 (%)
Data Table on Middle East and Africa - Year-over-year growth 2025-2030 (%)
Chart on Regional Comparison - Middle East and Africa
Data Table on Regional Comparison - Middle East and Africa

12.7.1 Saudi Arabia - Market size and forecast 2025-2030

Chart on Saudi Arabia - Market size and forecast 2025-2030 ($ million)
Data Table on Saudi Arabia - Market size and forecast 2025-2030 ($ million)
Chart on Saudi Arabia - Year-over-year growth 2025-2030 (%)
Data Table on Saudi Arabia - Year-over-year growth 2025-2030 (%)

12.7.2 UAE - Market size and forecast 2025-2030

Chart on UAE - Market size and forecast 2025-2030 ($ million)
Data Table on UAE - Market size and forecast 2025-2030 ($ million)
Chart on UAE - Year-over-year growth 2025-2030 (%)
Data Table on UAE - Year-over-year growth 2025-2030 (%)

12.7.3 South Africa - Market size and forecast 2025-2030

Chart on South Africa - Market size and forecast 2025-2030 ($ million)
Data Table on South Africa - Market size and forecast 2025-2030 ($ million)
Chart on South Africa - Year-over-year growth 2025-2030 (%)
Data Table on South Africa - Year-over-year growth 2025-2030 (%)

12.7.4 Israel - Market size and forecast 2025-2030

Chart on Israel - Market size and forecast 2025-2030 ($ million)
Data Table on Israel - Market size and forecast 2025-2030 ($ million)
Chart on Israel - Year-over-year growth 2025-2030 (%)
Data Table on Israel - Year-over-year growth 2025-2030 (%)

12.7.5 Turkey - Market size and forecast 2025-2030

Chart on Turkey - Market size and forecast 2025-2030 ($ million)
Data Table on Turkey - Market size and forecast 2025-2030 ($ million)
Chart on Turkey - Year-over-year growth 2025-2030 (%)
Data Table on Turkey - Year-over-year growth 2025-2030 (%)

12.8 Market opportunity by geography

Market opportunity by geography ($ million)
Data Tables on Market opportunity by geography ($ million)

13. Drivers, Challenges, and Opportunity

13.1 Market drivers

Growing availability of customer behavioral data
Advancements in machine learning and analytics
Higher consumer expectations for real‑time relevance

13.2 Market challenges

Data privacy concerns limiting personalization depth
High-quality training data availability issues
Algorithmic bias reducing personalization accuracy

13.3 Impact of drivers and challenges

Impact of drivers and challenges in 2025 and 2030

13.4 Market opportunities

Hyper‑personalized recommendations powered by generative AI
Multimodal personalization across voice, text, and vision
Edge AI enabling faster on‑device personalization

14. Competitive Landscape

14.1 Overview

14.2

Overview on criticality of inputs and factors of differentiation

14.3 Landscape disruption

Overview on factors of disruption

14.4 Industry risks

Impact of key risks on business

15. Competitive Analysis

15.1 Companies profiled

Companies covered

15.2 Company ranking index

15.3 Market positioning of companies

Matrix on companies position and classification

15.4 Accenture Plc

Accenture Plc - Overview
Accenture Plc - Business segments
Accenture Plc - Key news
Accenture Plc - Key offerings
Accenture Plc - Segment focus
SWOT

15.5 Adobe Inc.

Adobe Inc. - Overview
Adobe Inc. - Business segments
Adobe Inc. - Key news
Adobe Inc. - Key offerings
Adobe Inc. - Segment focus
SWOT

15.6 Amazon.com Inc.

Amazon.com Inc. - Overview
Amazon.com Inc. - Business segments
Amazon.com Inc. - Key news
Amazon.com Inc. - Key offerings
Amazon.com Inc. - Segment focus
SWOT

15.7 Apple Inc.

Apple Inc. - Overview
Apple Inc. - Business segments
Apple Inc. - Key news
Apple Inc. - Key offerings
Apple Inc. - Segment focus
SWOT

15.8 Google LLC

Google LLC - Overview
Google LLC - Product / Service
Google LLC - Key offerings
SWOT

15.9 H2O.ai Inc.

H2O.ai Inc. - Overview
H2O.ai Inc. - Product / Service
H2O.ai Inc. - Key offerings
SWOT

15.10 IBM Corp.

IBM Corp. - Overview
IBM Corp. - Business segments
IBM Corp. - Key offerings
IBM Corp. - Segment focus
SWOT

15.11 McDonald Corp.

McDonald Corp. - Overview
McDonald Corp. - Business segments
McDonald Corp. - Key offerings
McDonald Corp. - Segment focus
SWOT

15.12 Microsoft Corp.

Microsoft Corp. - Overview
Microsoft Corp. - Business segments
Microsoft Corp. - Key news
Microsoft Corp. - Key offerings
Microsoft Corp. - Segment focus
SWOT

15.13 mParticle Inc.

mParticle Inc. - Overview
mParticle Inc. - Product / Service
mParticle Inc. - Key offerings
SWOT

15.14 Salesforce Inc.

Salesforce Inc. - Overview
Salesforce Inc. - Business segments
Salesforce Inc. - Key news
Salesforce Inc. - Key offerings
Salesforce Inc. - Segment focus
SWOT

15.15 Sitecore Holding Ltd.

Sitecore Holding Ltd. - Overview
Sitecore Holding Ltd. - Product / Service
Sitecore Holding Ltd. - Key news
Sitecore Holding Ltd. - Key offerings
SWOT

15.16 Verint Systems Inc.

Verint Systems Inc. - Overview
Verint Systems Inc. - Product / Service
Verint Systems Inc. - Key offerings
SWOT

15.17 ViSenze Pte. Ltd.

ViSenze Pte. Ltd. - Overview
ViSenze Pte. Ltd. - Product / Service
ViSenze Pte. Ltd. - Key offerings
SWOT

15.18 ZS Associates Inc.

ZS Associates Inc. - Overview
ZS Associates Inc. - Product / Service
ZS Associates Inc. - Key offerings
SWOT

16. Appendix

16.1 Scope of the report

Market definition
Objectives
Notes and caveats

16.2 Inclusions and exclusions checklist

Inclusions checklist
Exclusions checklist

16.3 Currency conversion rates for US$

16.4 Research methodology

16.5 Data procurement

Information sources

16.6 Data validation

16.7 Validation techniques employed for market sizing

16.8 Data synthesis

16.9 360 degree market analysis

16.10 List of abbreviations

Research Methodology

Technavio presents a detailed picture of the market by way of study, synthesis, and summation of data from multiple sources. The analysts have presented the various facets of the market with a particular focus on identifying the key industry influencers. The data thus presented is comprehensive, reliable, and the result of extensive research, both primary and secondary.

INFORMATION SOURCES

Primary sources

  • Manufacturers and suppliers
  • Channel partners
  • Industry experts
  • Strategic decision makers

Secondary sources

  • Industry journals and periodicals
  • Government data
  • Financial reports of key industry players
  • Historical data
  • Press releases

DATA ANALYSIS

Data Synthesis

  • Collation of data
  • Estimation of key figures
  • Analysis of derived insights

Data Validation

  • Triangulation with data models
  • Reference against proprietary databases
  • Corroboration with industry experts

REPORT WRITING

Qualitative

  • Market drivers
  • Market challenges
  • Market trends
  • Five forces analysis

Quantitative

  • Market size and forecast
  • Market segmentation
  • Geographical insights
  • Competitive landscape

Interested in this report?

Get your sample now to see our research methodology and insights!

Download Now

Frequently Asked Questions

Artificial Intelligence-based Personalization market growth will increase by USD 3707.6 million during 2026-2030.

The Artificial Intelligence-based Personalization market is expected to grow at a CAGR of 19.8% during 2026-2030.

Artificial Intelligence-based Personalization market is segmented by Application (Website personalization, Display ads personalization, Social media personalization, E-mail personalization, Others) Technology (Machine learning and deep learning, Natural language processing) End-user (Enterprises, Individuals)

Accenture Plc, Adobe Inc., Amazon.com Inc., Apple Inc., BloomReach Inc., Blueshift Labs Inc., Bounteous X Accolite, Crownpeak Technology Inc., Google LLC, H2O.ai Inc., IBM Corp., Infinite Analytics Inc., McDonald Corp., Microsoft Corp., mParticle Inc., Salesforce Inc., Sitecore Holding Ltd., Verint Systems Inc., ViSenze Pte. Ltd., ZS Associates Inc. are a few of the key vendors in the Artificial Intelligence-based Personalization market.

APAC will register the highest growth rate of 37.1% among the other regions. Therefore, the Artificial Intelligence-based Personalization market in APAC is expected to garner significant business opportunities for the vendors during the forecast period.

China, Japan, India, South Korea, Australia, Indonesia, US, Canada, Mexico, Germany, UK, France, Italy, Spain, The Netherlands, Brazil, Argentina, Chile, Saudi Arabia, UAE, South Africa, Israel, Turkey

  • Growing availability of customer behavioral data is the driving factor this market.

The Artificial Intelligence-based Personalization market vendors should focus on grabbing business opportunities from the Application segment as it accounted for the largest market share in the base year.
RIA - Research AI Assistant
Ask RIA