
Artificial Intelligence (AI) In Education Sector Market Size 2026-2030
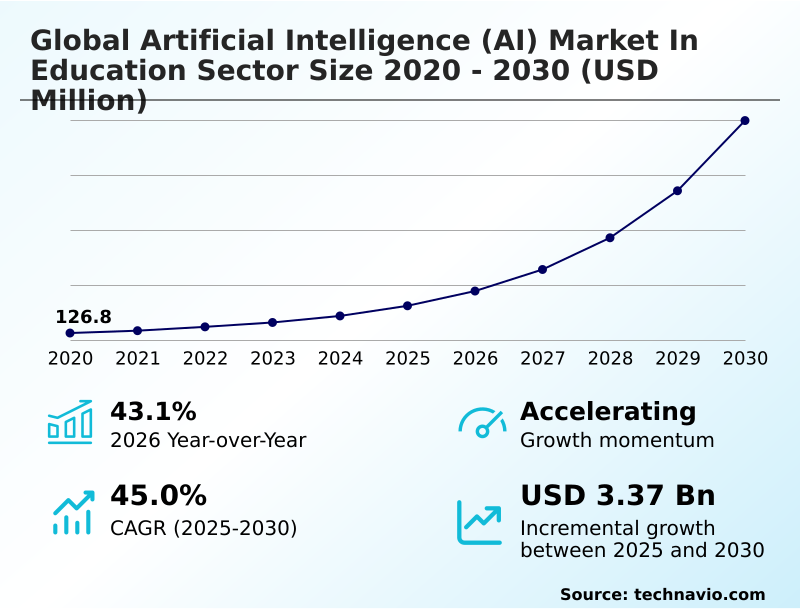
The artificial intelligence (ai) in education sector market size is valued to increase by USD 3.37 billion, at a CAGR of 45% from 2025 to 2030. Escalating demand for personalized and adaptive learning experiences will drive the artificial intelligence (ai) in education sector market.
Major Market Trends & Insights
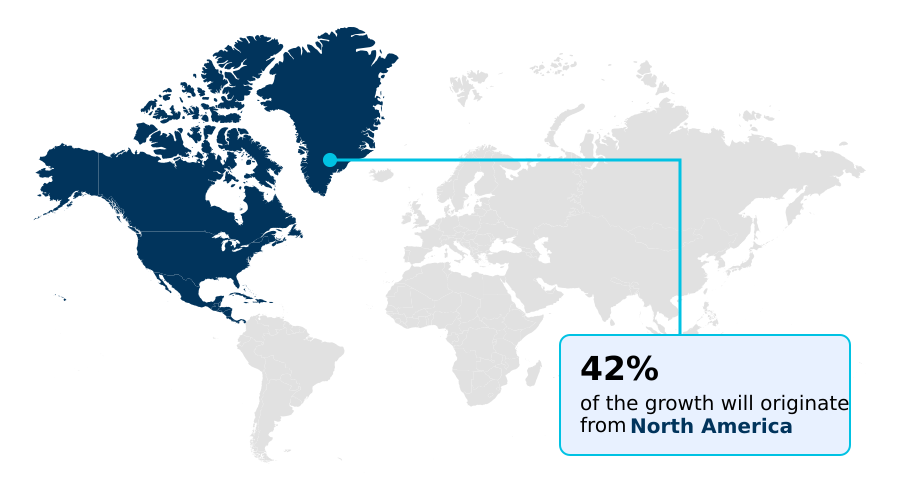
- North America dominated the market and accounted for a 41.7% growth during the forecast period.
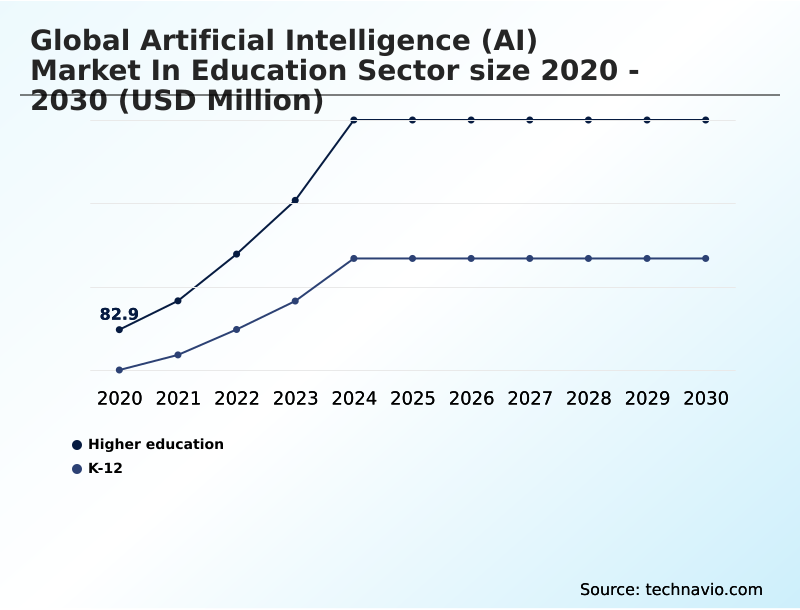
- By End-user - Higher education segment was valued at USD 285.7 million in 2024
- By Learning Method - Learner model segment accounted for the largest market revenue share in 2024
Market Size & Forecast
- Market Opportunities: USD 3.86 billion
- Market Future Opportunities: USD 3.37 billion
- CAGR from 2025 to 2030 : 45%
Market Summary
- The artificial intelligence in education sector is experiencing profound expansion as institutions pivot toward intelligent infrastructure to enhance scalability and engagement. A key driver is the move from standardized instruction to hyper-personalized education, where machine learning algorithms and natural language processing create adaptive learning environments. This transition is supported by the broad adoption of cloud-based platforms, which facilitate data-driven instruction.
- A significant trend is the evolution from basic generative models to sophisticated agentic AI workflows that automate administrative tasks like grading and scheduling, allowing educators to focus on mentorship. For instance, a university system can deploy predictive analytics to analyze student performance metrics, identifying at-risk individuals and enabling timely interventions to reduce dropout rates.
- However, challenges such as data sovereignty and the need for robust AI ethics frameworks persist, requiring careful management to ensure equitable and secure implementation across diverse educational settings.
What will be the Size of the Artificial Intelligence (AI) In Education Sector Market during the forecast period?
Get Key Insights on Market Forecast (PDF) Get Free Sample
How is the Artificial Intelligence (AI) In Education Sector Market Segmented?
The artificial intelligence (ai) in education sector industry research report provides comprehensive data (region-wise segment analysis), with forecasts and estimates in "USD million" for the period 2026-2030, as well as historical data from 2020-2024 for the following segments.
- End-user
- Higher education
- K-12
- Learning method
- Learner model
- Pedagogical model
- Domain model
- Component
- Solutions
- Services
- Application
- Learning platform and virtual facilitators
- Intelligent tutoring system (ITS)
- Smart content
- Fraud and risk management
- Others
- Geography
- North America
- US
- Canada
- Mexico
- Europe
- Germany
- UK
- France
- APAC
- China
- India
- Japan
- South America
- Brazil
- Argentina
- Middle East and Africa
- Saudi Arabia
- UAE
- South Africa
- Rest of World (ROW)
- North America
By End-user Insights
The higher education segment is estimated to witness significant growth during the forecast period.
The higher education segment is at the forefront of the artificial intelligence in education sector, driven by strategic integration across all operational facets.
A notable shift from pilot programs to systemic adoption is evident, with institution-wide implementation of AI surging to 66%. Universities are leveraging generative models and AI-powered course recommendations to develop specialized teaching materials and intelligent tutoring systems.
The use of digital twin learners and predictive analytics has become central to institutional strategy, enabling proactive student interventions.
This move is supported by advanced curriculum architecture and sophisticated pedagogical models that cater to a diverse student body, focusing on AI-driven skill mapping to prepare graduates for a landscape dominated by automated systems and machine learning algorithms, which is a part of digital transformation in education.
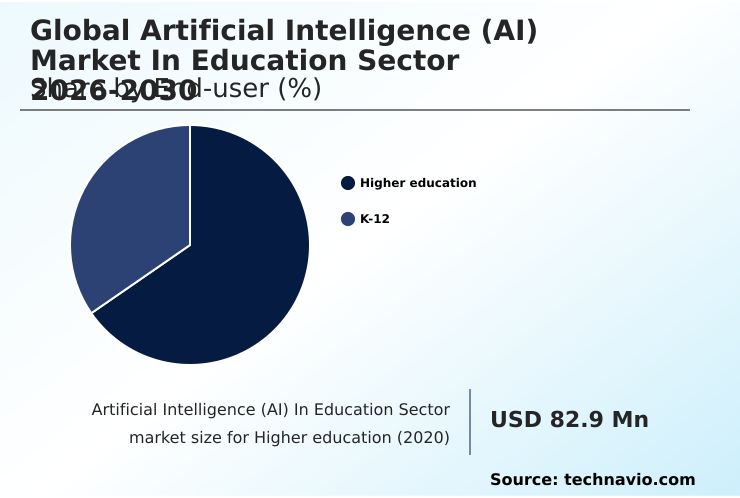
The Higher education segment was valued at USD 285.7 million in 2024 and showed a gradual increase during the forecast period.
Regional Analysis
North America is estimated to contribute 41.7% to the growth of the global market during the forecast period.Technavio’s analysts have elaborately explained the regional trends and drivers that shape the market during the forecast period.
See How Artificial Intelligence (AI) In Education Sector Market Demand is Rising in North America Get Free Sample
The geographic landscape of the artificial intelligence in education sector is led by North America, where 86% of educational organizations have adopted generative artificial intelligence for administrative and instructional enhancement.
This region's dominance is supported by a mature technological infrastructure and substantial private sector investment in AI-enhanced simulations and qualitative assessment tools.
In contrast, the APAC region is the fastest-growing market, with a growth rate of 48%, driven by government mandates for AI literacy programs and the deployment of multilingual AI tutors.
This hyper-localization trend, using AI-powered language instruction to address shortages of qualified instructors, is making high-quality education accessible across diverse linguistic contexts.
The integration of AI with learning management systems is a global phenomenon, but regional priorities dictate the focus, from workforce alignment in Europe to bridging the digital divide in South America.
Market Dynamics
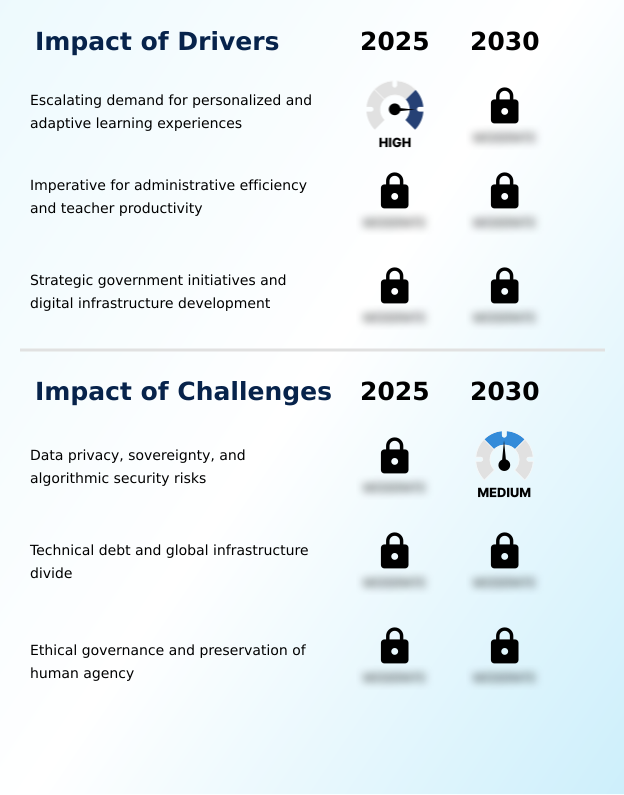
Our researchers analyzed the data with 2025 as the base year, along with the key drivers, trends, and challenges. A holistic analysis of drivers will help companies refine their marketing strategies to gain a competitive advantage.
- The strategic implementation of artificial intelligence is reshaping education, with generative AI for lesson planning and AI-powered personalized learning paths becoming central to modern pedagogy. The use of adaptive assessment using machine learning allows for a more nuanced evaluation of student progress than traditional methods. In STEM fields, intelligent tutoring systems for STEM are providing scalable, one-on-one support.
- However, this transition raises significant ethical implications of AI in education that require careful consideration. The role of AI in administrative efficiency is undeniable, with AI for corporate upskilling programs showing how targeted training can be optimized. AI-driven student performance prediction is enabling early interventions, while natural language processing for feedback automates and personalizes student evaluations.
- A core challenge remains data privacy in AI education platforms, especially when using AI for special needs students. The debate over AI tutors versus human instructors continues, highlighting the irreplaceable value of human connection. Successful AI integration with learning management systems is critical for seamless deployment. Meanwhile, the impact of AI on academic integrity requires new policies and technologies.
- As institutions focus on developing AI literacy in K-12, the market for AI-based language learning applications is also expanding rapidly, alongside hyper-personalization in higher education AI.
- Ultimately, AI-driven career mapping for students and gamification of AI learning modules are proving effective in boosting engagement and reducing teacher workload, with AI-driven approaches improving operational planning efficiency by over 25% compared to legacy manual processes.
What are the key market drivers leading to the rise in the adoption of Artificial Intelligence (AI) In Education Sector Industry?
- The escalating demand for personalized and adaptive learning experiences, tailored to individual student needs, is a key driver for the market's growth.
- The escalating demand for personalized learning and administrative efficiency is a primary driver for the artificial intelligence in education sector. AI-powered student engagement is critical, as institutions use machine learning to adjust content and pacing in real time.
- This demand for adaptive learning engines has surged, with 86% of educational organizations integrating generative AI for student interactions.
- The need for operational efficiency is also paramount, with administrative automation solutions becoming standard in higher education to manage enrollment and financial aid. AI-powered lesson planning assistants help educators by suggesting pedagogical strategies.
- This focus on efficiency addresses global teacher shortages, allowing faculty to manage larger cohorts without compromising educational quality and driving the digital transformation in education.
What are the market trends shaping the Artificial Intelligence (AI) In Education Sector Industry?
- The market is shifting from experimental applications of generative AI to the strategic deployment of autonomous agentic workflows designed to manage complex educational tasks.
- The market is rapidly evolving from generative experimentation to the deployment of agentic educational workflows, a trend reshaping instructional delivery. Agentic AI workflows are increasingly integrated into learning management systems to automate complex tasks, from student onboarding to curriculum gap identification.
- This transition is evident in higher education, where digital twins of courses allow for infinite variations of practice and assessment. Institutions are adopting AI-powered homework assistance and AI writing assistance to provide 24/7 support. This shift reflects a move beyond simple chatbots toward integrated systems, with some institutions reporting a 30% increase in student engagement after implementation.
- The focus is now on proactive, autonomous systems that enhance, rather than just supplement, the learning experience.
What challenges does the Artificial Intelligence (AI) In Education Sector Industry face during its growth?
- Concerns over data privacy, sovereignty, and the security risks associated with algorithmic models represent a key challenge to industry growth and adoption.
- A foremost challenge is managing data privacy and algorithmic security, as AI systems collect extensive behavioral and biometric data. The legal ambiguity over data ownership creates significant hurdles, with predictive data security models struggling to keep pace with new encryption requirements.
- A profound disparity in technical infrastructure and the high cost of adaptive learning platforms create a global digital divide, limiting democratization. This is compounded by ethical concerns over the loss of human agency, as over-reliance on AI can lead to metacognitive laziness.
- With 72% of teachers expressing concern about AI's impact on academic integrity, establishing ethical governance and preserving human-centric learning models remains a critical restraint for the market.
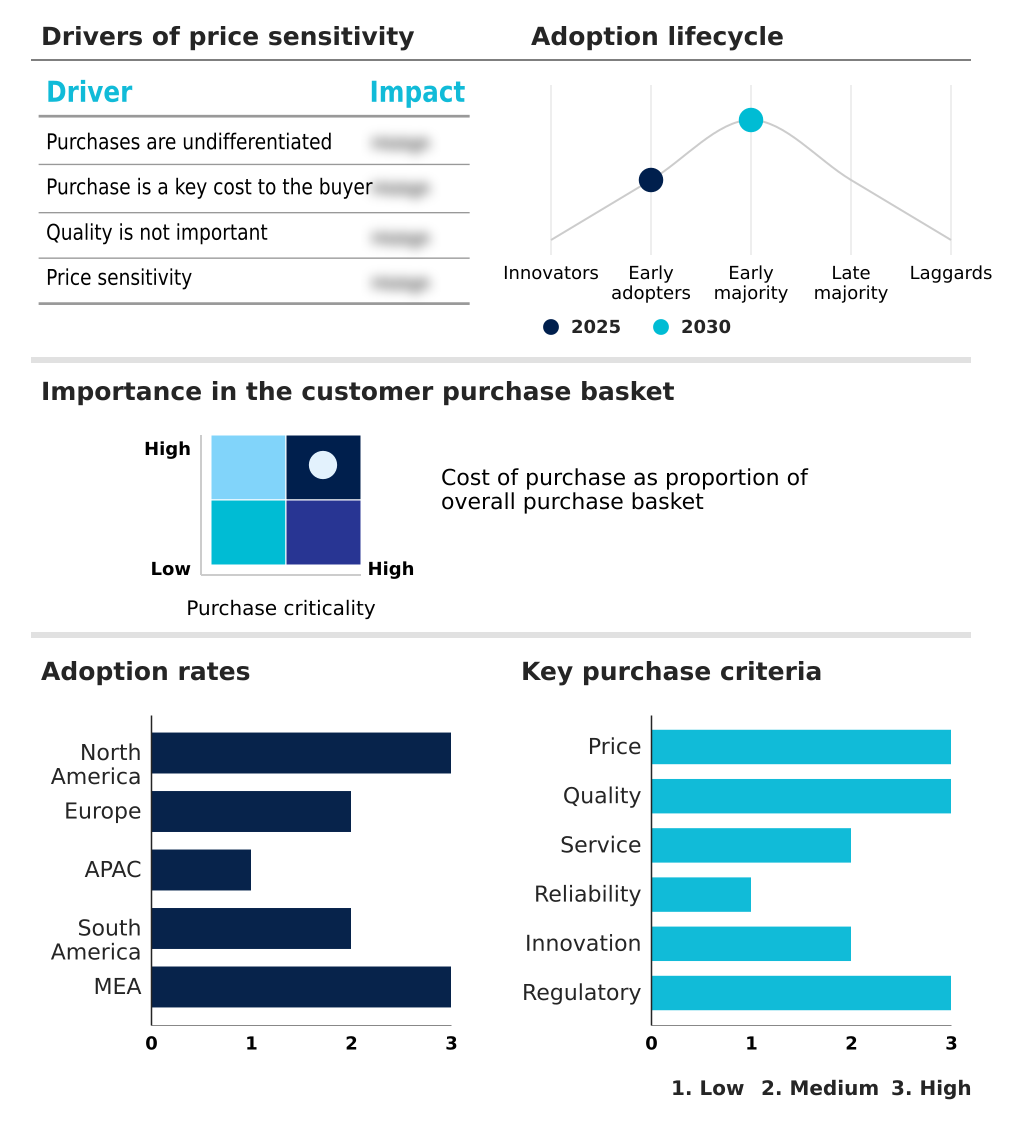
Exclusive Technavio Analysis on Customer Landscape
The artificial intelligence (ai) in education sector market forecasting report includes the adoption lifecycle of the market, covering from the innovator’s stage to the laggard’s stage. It focuses on adoption rates in different regions based on penetration. Furthermore, the artificial intelligence (ai) in education sector market report also includes key purchase criteria and drivers of price sensitivity to help companies evaluate and develop their market growth analysis strategies.
Customer Landscape of Artificial Intelligence (AI) In Education Sector Industry
Competitive Landscape
Companies are implementing various strategies, such as strategic alliances, artificial intelligence (ai) in education sector market forecast, partnerships, mergers and acquisitions, geographical expansion, and product/service launches, to enhance their presence in the industry.
Anthology Inc. - Delivers AI-powered student engagement tools and advanced learning management systems designed to transform educational outcomes through personalized instruction and enhanced institutional effectiveness.
The industry research and growth report includes detailed analyses of the competitive landscape of the market and information about key companies, including:
- Anthology Inc.
- Brainly
- Carnegie Learning Inc.
- Chegg Inc.
- Cognii Inc.
- Coursera Inc.
- Duolingo Inc.
- Edmentum Inc.
- Google LLC
- Grammarly Inc.
- Instructure Holdings Inc.
- Kahoot AS
- Khan Academy Inc.
- Magic School Inc.
- McGraw Hill LLC
- Microsoft Corp.
- OpenAI
- Pearson Plc
- Quizlet Inc.
- Turnitin LLC
Qualitative and quantitative analysis of companies has been conducted to help clients understand the wider business environment as well as the strengths and weaknesses of key industry players. Data is qualitatively analyzed to categorize companies as pure play, category-focused, industry-focused, and diversified; it is quantitatively analyzed to categorize companies as dominant, leading, strong, tentative, and weak.
Recent Development and News in Artificial intelligence (ai) in education sector market
- In August 2025, Google LLC expanded its Gemini for Education deployment across more than one thousand colleges and universities in the United States to support academic and administrative workflows.
- In March 2026, Amazon Web Services expanded its AWS AI and Machine Learning Scholars initiative, designed to provide one hundred thousand learners globally with training in AI and machine learning.
- In April 2026, Microsoft Corp. updated its Education AI Toolkit to include agentic artificial intelligence capabilities, enabling institutions to automate multi-step administrative workflows and provide tutoring support at scale.
- In June 2025, Michigan Virtual University collaborated with the Artificial Intelligence Education Project to promote AI literacy across the state’s K-12 system, signaling a trend toward comprehensive regional training.
Dive into Technavio’s robust research methodology, blending expert interviews, extensive data synthesis, and validated models for unparalleled Artificial Intelligence (AI) In Education Sector Market insights. See full methodology.
| Market Scope | |
|---|---|
| Page number | 313 |
| Base year | 2025 |
| Historic period | 2020-2024 |
| Forecast period | 2026-2030 |
| Growth momentum & CAGR | Accelerate at a CAGR of 45% |
| Market growth 2026-2030 | USD 3367.8 million |
| Market structure | Fragmented |
| YoY growth 2025-2026(%) | 43.1% |
| Key countries | US, Canada, Mexico, Germany, UK, France, Italy, Spain, The Netherlands, China, India, Japan, South Korea, Australia, Singapore, Brazil, Chile, Argentina, Saudi Arabia, UAE, South Africa, Egypt and Qatar |
| Competitive landscape | Leading Companies, Market Positioning of Companies, Competitive Strategies, and Industry Risks |
Research Analyst Overview
- The artificial intelligence in education sector is fundamentally reconfiguring instructional and administrative paradigms through the deployment of advanced computational technologies. At the core of this transformation are machine learning algorithms and generative models, which power adaptive learning platforms and intelligent tutoring systems.
- These systems utilize student performance metrics and emotional state analysis to enable cognitive mapping and provide real-time feedback mechanisms. This shift is driving demand for sophisticated pedagogical models and learner models, which rely on a well-defined curriculum architecture and knowledge graphs. The market is moving toward agentic AI workflows and the creation of digital twin learners for hyper-personalization.
- However, ensuring ethical implementation requires robust AI ethics frameworks and data privacy protocols to mitigate algorithmic bias and protect data sovereignty. Following the implementation of AI-driven platforms, institutions reported a thirty percent increase in student engagement, underscoring the technology's impact on educational outcomes.
What are the Key Data Covered in this Artificial Intelligence (AI) In Education Sector Market Research and Growth Report?
-
What is the expected growth of the Artificial Intelligence (AI) In Education Sector Market between 2026 and 2030?
-
USD 3.37 billion, at a CAGR of 45%
-
-
What segmentation does the market report cover?
-
The report is segmented by End-user (Higher education, and K-12), Learning Method (Learner model, Pedagogical model, and Domain model), Component (Solutions, and Services), Application (Learning platform and virtual facilitators, Intelligent tutoring system (ITS), Smart content, Fraud and risk management, and Others) and Geography (North America, Europe, APAC, South America, Middle East and Africa)
-
-
Which regions are analyzed in the report?
-
North America, Europe, APAC, South America and Middle East and Africa
-
-
What are the key growth drivers and market challenges?
-
Escalating demand for personalized and adaptive learning experiences, Data privacy, sovereignty, and algorithmic security risks
-
-
Who are the major players in the Artificial Intelligence (AI) In Education Sector Market?
-
Anthology Inc., Brainly, Carnegie Learning Inc., Chegg Inc., Cognii Inc., Coursera Inc., Duolingo Inc., Edmentum Inc., Google LLC, Grammarly Inc., Instructure Holdings Inc., Kahoot AS, Khan Academy Inc., Magic School Inc., McGraw Hill LLC, Microsoft Corp., OpenAI, Pearson Plc, Quizlet Inc. and Turnitin LLC
-
Market Research Insights
- Market dynamics are shaped by a strategic pivot toward proactive student interventions and career-connected learning. The implementation of AI-driven curriculum development has led to a thirty percent increase in student engagement across several higher education institutions. This focus on AI for workforce readiness is creating a demand for adaptive assessment tools that align academic outcomes with industry needs.
- Virtual learning assistants are becoming standard, managing complex enrollment and financial aid inquiries without human intervention. The integration of AI-powered lesson planning tools suggests pedagogical strategies based on real-time classroom data, optimizing the educational experience. These advancements reflect a move beyond simple automation toward creating integrated, AI-mediated environments that deliver measurable improvements in student retention and success.
We can help! Our analysts can customize this artificial intelligence (ai) in education sector market research report to meet your requirements.
 RIA -
RIA - 
