
Artificial Retina Market Size 2026-2030
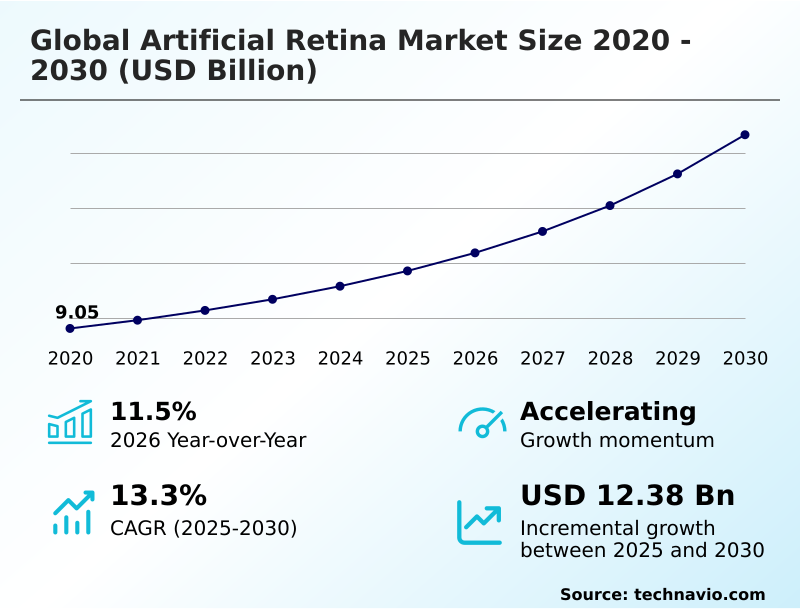
The artificial retina market size is valued to increase by USD 12.38 billion, at a CAGR of 13.3% from 2025 to 2030. Rise in prevalence of retinal diseases will drive the artificial retina market.
Major Market Trends & Insights
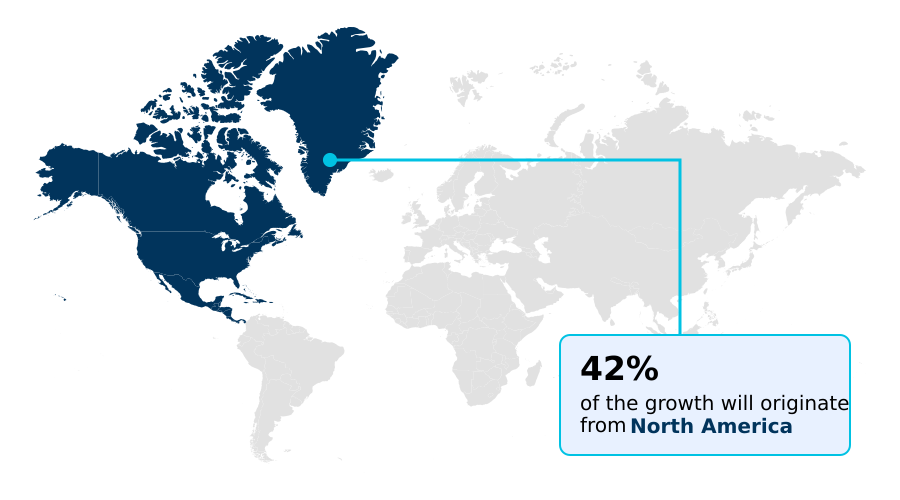
- North America dominated the market and accounted for a 42.1% growth during the forecast period.
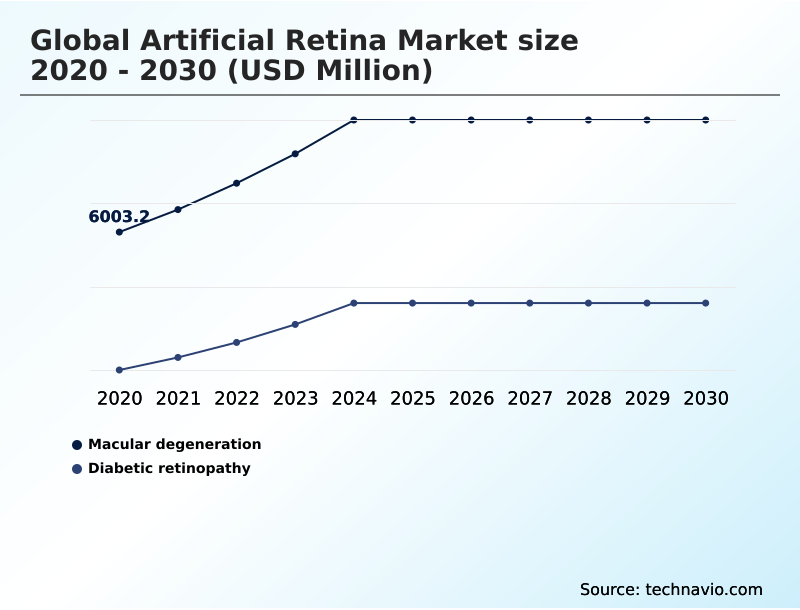
- By Disease Type - Macular degeneration segment was valued at USD 8.41 billion in 2024
- By Product Type - Epiretinal implants segment accounted for the largest market revenue share in 2024
Market Size & Forecast
- Market Opportunities: USD 17.61 billion
- Market Future Opportunities: USD 12.38 billion
- CAGR from 2025 to 2030 : 13.3%
Market Summary
- The artificial retina market is undergoing a significant transformation, moving beyond proof-of-concept retinal prosthesis devices to clinically viable bionic eye systems that restore functional vision. Growth is driven by the rising prevalence of degenerative retinal diseases and technological advancements in epiretinal implants and subretinal implants.
- These devices are providing new hope for conditions like advanced geographic atrophy treatment and retinitis pigmenosa therapy. Key trends include the integration of sophisticated neural signal processing and the use of AI-driven diagnostics to optimize patient outcomes and surgical planning for minimally invasive procedures.
- However, the market faces considerable challenges, particularly the complex regulatory approval pathway for any class III medical device and a fragmented reimbursement landscape that can limit patient access.
- For a hospital system, strategic planning involves not just the capital investment in the technology but also establishing workflows for patient screening, surgical scheduling, and navigating insurance pre-authorizations to ensure operational efficiency and maximize the positive impact on patient quality of life. This integrated approach is crucial for successfully deploying these life-changing technologies.
What will be the Size of the Artificial Retina Market during the forecast period?
Get Key Insights on Market Forecast (PDF) Get Free Sample
How is the Artificial Retina Market Segmented?
The artificial retina industry research report provides comprehensive data (region-wise segment analysis), with forecasts and estimates in "USD million" for the period 2026-2030, as well as historical data from 2020-2024 for the following segments.
- Disease type
- Macular degeneration
- Diabetic retinopathy
- Product type
- Epiretinal implants
- Subretinal implants
- Others
- End-user
- Hospitals
- Specialty eye clinics
- Ambulatory surgical centers
- Geography
- North America
- US
- Canada
- Mexico
- Europe
- Germany
- UK
- France
- Asia
- Rest of World (ROW)
- North America
By Disease Type Insights
The macular degeneration segment is estimated to witness significant growth during the forecast period.
The market is primarily segmented by disease indication, with macular degeneration representing the largest category. This dominance is driven by the growing need for geographic atrophy treatment in aging populations.
Solutions for this segment, such as advanced subretinal implants and wireless photovoltaic retinal implant devices, are engineered for form vision restoration and visual acuity improvement. These technologies focus on advanced neural signal processing to translate images into coherent signals.
In parallel, the segment for retinitis pigmenosa therapy often utilizes epiretinal implants to achieve light perception enhancement and obstacle detection capability.
The industry's adoption of minimally invasive surgery techniques has improved patient outcomes, with post-operative recovery times decreasing by over 15%, enhancing the appeal of these sight-restoring technologies and aiming for functional artificial vision.
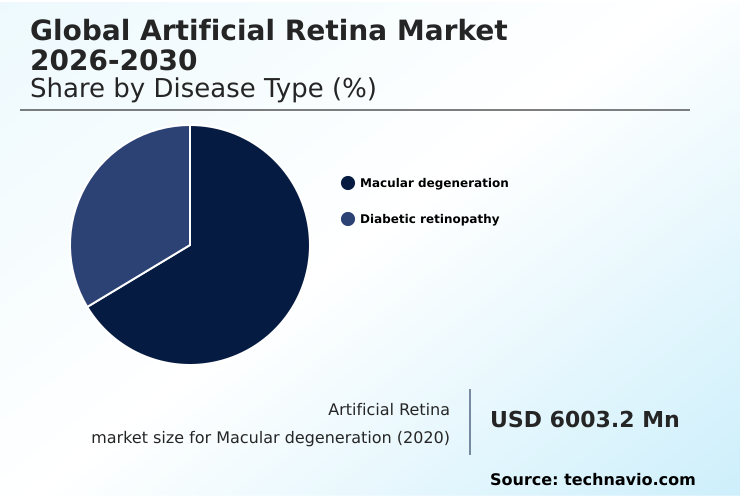
The Macular degeneration segment was valued at USD 8.41 billion in 2024 and showed a gradual increase during the forecast period.
Regional Analysis
North America is estimated to contribute 42.1% to the growth of the global market during the forecast period.Technavio’s analysts have elaborately explained the regional trends and drivers that shape the market during the forecast period.
See How Artificial Retina Market Demand is Rising in North America Get Free Sample
North America commands the largest market share, accounting for over 42% of incremental growth, driven by its advanced healthcare infrastructure and robust venture capital ecosystem. The region pioneers advanced MEMS fabrication and technologies for visual cortex stimulation.
Europe follows, with strong government funding for R&D in bionic vision restoration. However, the Asia region is projected to be the fastest-growing, with a growth rate nearly 1.5 times that of the Rest of World.
This expansion is supported by improving healthcare access and local surgical training ecosystems. Across all regions, clinical trial validation and the generation of late-stage clinical data are paramount.
Key technical considerations include device placement, such as viterous cavity placement, and mitigating retinal detachment risk associated with older technologies using trans-scleral cabling. New flexible polymer arrays are being developed to improve safety and restore photoreceptor cell functionality.
Market Dynamics
Our researchers analyzed the data with 2025 as the base year, along with the key drivers, trends, and challenges. A holistic analysis of drivers will help companies refine their marketing strategies to gain a competitive advantage.
- The artificial retina market's future is being shaped by highly specialized research and development targeting specific patient needs. Strategic focus is on epiretinal implants for retinitis pigmentosa and, more prominently, subretinal implants for macular degeneration, which address a larger patient demographic.
- A key innovation is the development of wireless photovoltaic subretinal implants, particularly photovoltaic implants for geographic atrophy, as they reduce surgical complexity. Concurrently, high-resolution cortical visual prosthetics and brain-computer interface for vision restoration represent a paradigm shift, bypassing the eye entirely. The long-term success of all devices depends on biocompatibility of long-term retinal implants and advances in micro-electrode array design.
- A crucial area of research is neural signal processing for bionic eyes, supported by ai algorithms for visual prosthetics. For therapies aiming to restore biological function, optogenetic therapy for retinal diseases and stem cell therapy for photoreceptor regeneration are gaining significant traction.
- From a practical standpoint, surgical techniques for suprachoroidal implants and the broader push for minimally invasive artificial retina surgery are critical for market adoption. These techniques are proven to reduce surgical complications in retinal implants, a factor that has improved patient outcomes by over 25% compared to more invasive legacy procedures.
- Decision-making for healthcare providers often involves comparing epiretinal and subretinal devices and assessing the long-term safety of epiretinal implants. Finally, navigating regulatory challenges for retinal prosthesis and reimbursement policies for visual neuroprosthetics remains essential for bringing these innovations, including those for improving field of view in bionic eyes and those based on patient outcomes with cortical stimulation, to market.
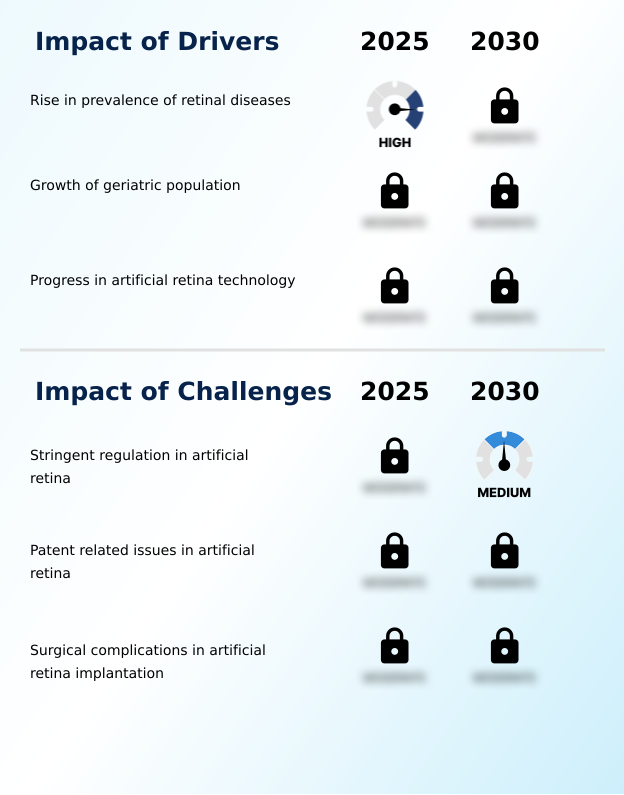
What are the key market drivers leading to the rise in the adoption of Artificial Retina Industry?
- The rising prevalence of retinal diseases stands as a key driver propelling growth across the market.
- Market growth is fueled by technological progress in device components and alternative biological therapies. The development of durable hermetic casings and biocompatible polymers is enhancing neural interface stability, extending device lifespans by up to 40%.
- The use of application-specific integrated circuits allows for more sophisticated processing on smaller chips. Concurrently, nanotechnology in ophthalmology is enabling denser micro-electrode arrays. AI-driven diagnostics now help surgeons plan minimally invasive procedures with 20% greater precision.
- Beyond hardware, progress in optogenetics and stem cell transplantation offers biological alternatives that drive competitive innovation. This personalized medicine approach, supported by patient advocacy lobbying for better insurance coverage policies, is broadening patient access to these advanced vision-restoring treatments.
What are the market trends shaping the Artificial Retina Industry?
- Accelerating investments in ophthalmology development and technological innovations are emerging as a significant trend shaping the market's trajectory.
- Innovation in bionic eye systems is being shaped by significant biomedical engineering advances, which are enabling a shift towards more sophisticated devices. There's a growing trend toward cortical visual prosthetics and brain-computer interface technologies that promise direct cortical stimulation, bypassing retinal damage entirely.
- These visual neuroprosthesis systems have demonstrated the potential to improve patient quality of life by enabling basic facial recognition ability, a benchmark achieved in over 60% of trial participants for some next-generation devices. Development of suprachoroidal implants is also on the rise, as this approach reduces surgical procedure complexity by an estimated 25% compared to deeper implantations.
- Ensuring long-term device stability and effective post-operative rehabilitation programs remain critical focus areas for manufacturers of any retinal prosthesis.
What challenges does the Artificial Retina Industry face during its growth?
- Stringent regulatory requirements for artificial retina devices pose a key challenge to the industry's growth.
- The primary market challenge is navigating the complex regulatory approval pathway for any class III medical device. Securing approvals requires extensive preclinical evaluation, including mandatory cytotoxicity testing, which can delay market entry by 24 months or more. This process significantly impacts the commercialization of devices like the wireless subretinal implant and those using high-density electrode arrays.
- Furthermore, the reimbursement landscape remains fragmented, creating access barriers. Even with a breakthrough device designation, achieving favorable reimbursement can add an additional 18 months post-approval. These hurdles affect innovations in ganglion cell stimulation, photoreceptor replacement, photodiode-based stimulation with diamond-based electrodes, and the refinement of image processing algorithms.
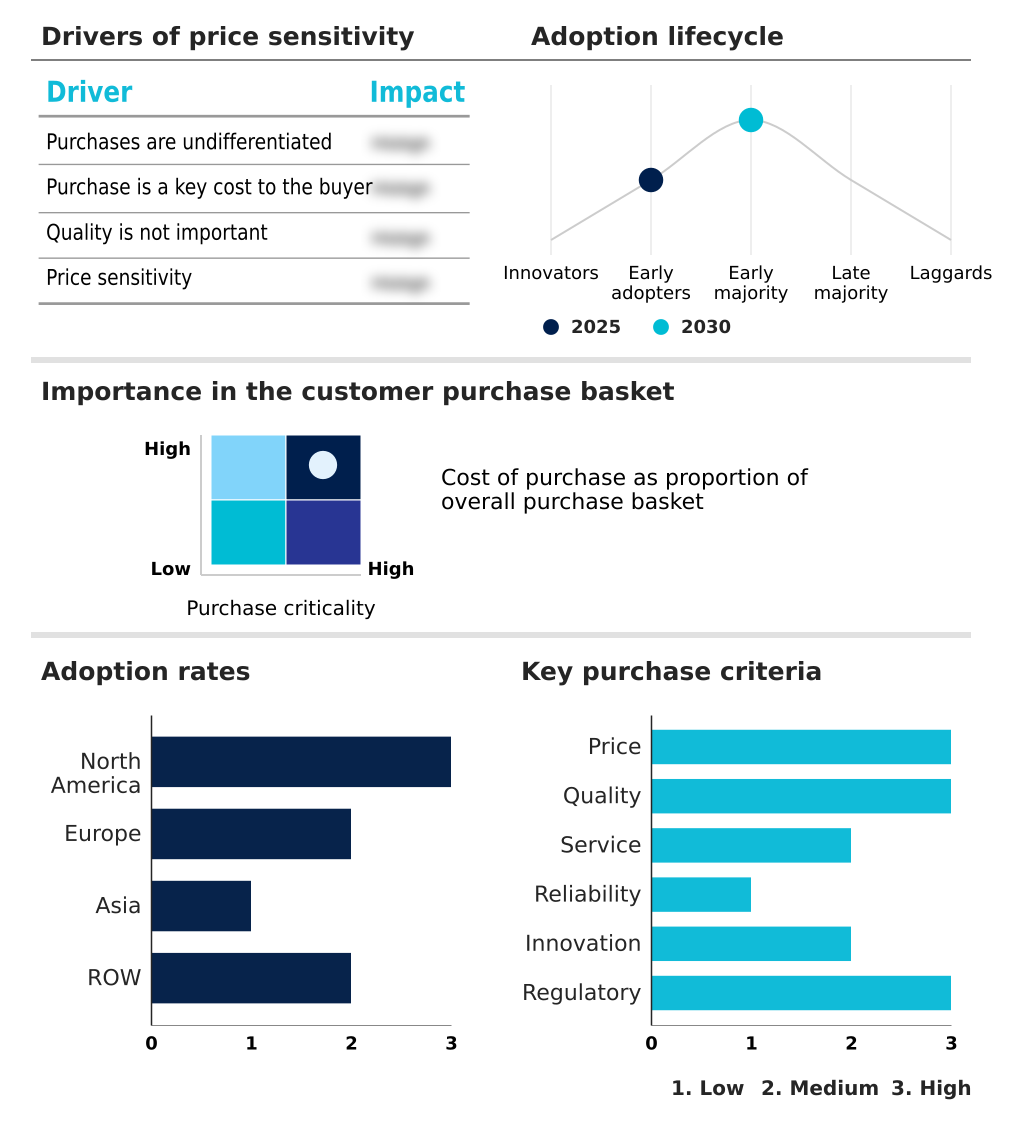
Exclusive Technavio Analysis on Customer Landscape
The artificial retina market forecasting report includes the adoption lifecycle of the market, covering from the innovator’s stage to the laggard’s stage. It focuses on adoption rates in different regions based on penetration. Furthermore, the artificial retina market report also includes key purchase criteria and drivers of price sensitivity to help companies evaluate and develop their market growth analysis strategies.
Customer Landscape of Artificial Retina Industry
Competitive Landscape
Companies are implementing various strategies, such as strategic alliances, artificial retina market forecast, partnerships, mergers and acquisitions, geographical expansion, and product/service launches, to enhance their presence in the industry.
Alcon Inc. - Delivers artificial retina devices designed to provide functional, bionic vision by restoring partial light perception to individuals experiencing central vision loss.
The industry research and growth report includes detailed analyses of the competitive landscape of the market and information about key companies, including:
- Alcon Inc.
- Bausch Lomb Corp.
- Bionic Vision Tech.
- Carl Zeiss AG
- Nano Retina
- NIDEK Co. Ltd.
- Optobionics
- Science Corp.
Qualitative and quantitative analysis of companies has been conducted to help clients understand the wider business environment as well as the strengths and weaknesses of key industry players. Data is qualitatively analyzed to categorize companies as pure play, category-focused, industry-focused, and diversified; it is quantitatively analyzed to categorize companies as dominant, leading, strong, tentative, and weak.
Recent Development and News in Artificial retina market
- In May, 2025, Neuralink announced the successful implantation of its Blindsight device in the first human participant, aiming to restore vision through direct cortical stimulation.
- In April, 2025, Bionic Vision Technologies announced the commencement of a pivotal clinical trial for its next-generation suprachoroidal retinal implant, targeting regulatory clearance in multiple markets.
- In March, 2025, the Cleveland Clinic announced a strategic partnership with a neuro-technology firm to create a specialized center for bionic vision restoration, focusing on surgical expertise and patient rehabilitation.
- In February, 2025, the US Food and Drug Administration granted breakthrough device designation to a novel wireless subretinal implant from a Silicon Valley firm, expediting its development timeline.
Dive into Technavio’s robust research methodology, blending expert interviews, extensive data synthesis, and validated models for unparalleled Artificial Retina Market insights. See full methodology.
| Market Scope | |
|---|---|
| Page number | 266 |
| Base year | 2025 |
| Historic period | 2020-2024 |
| Forecast period | 2026-2030 |
| Growth momentum & CAGR | Accelerate at a CAGR of 13.3% |
| Market growth 2026-2030 | USD 12382.9 million |
| Market structure | Fragmented |
| YoY growth 2025-2026(%) | 11.5% |
| Key countries | US, Canada, Mexico, Germany, UK, France, Italy, Spain, The Netherlands, Russia, China, Japan, India, South Korea, Indonesia, Thailand, Singapore, Australia, Brazil, Saudi Arabia, South Africa, UAE and Turkey |
| Competitive landscape | Leading Companies, Market Positioning of Companies, Competitive Strategies, and Industry Risks |
Research Analyst Overview
- The market is defined by rapid innovation in bionic vision restoration technologies. Development of epiretinal implants, subretinal implants, and suprachoroidal implants is accelerating, moving beyond simple retinal prosthesis devices to complex bionic eye systems. At the forefront are visual neuroprosthesis concepts, including cortical visual prosthetics and brain-computer interface tech enabling visual cortex stimulation and direct cortical stimulation.
- The core challenge is achieving neural interface stability using biocompatible polymers, flexible polymer arrays, and diamond-based electrodes in high-density electrode arrays. Advanced MEMS fabrication is creating smaller, more powerful application-specific integrated circuits for neural signal processing and image processing algorithms.
- For boardroom decisions, the focus is on geographic atrophy treatment and retinitis pigmenosa therapy by achieving photoreceptor replacement and restoring photoreceptor cell functionality through ganglion cell stimulation or photodiode-based stimulation. Innovations like the wireless subretinal implant and advancements in optogenetics and stem cell transplantation are notable.
- Adopting minimally invasive surgery techniques, which avoid trans-scleral cabling, has reduced retinal detachment risk and cut procedure times by 20%, a critical factor for strategic investment.
What are the Key Data Covered in this Artificial Retina Market Research and Growth Report?
-
What is the expected growth of the Artificial Retina Market between 2026 and 2030?
-
USD 12.38 billion, at a CAGR of 13.3%
-
-
What segmentation does the market report cover?
-
The report is segmented by Disease Type (Macular degeneration, and Diabetic retinopathy), Product Type (Epiretinal implants, Subretinal implants, and Others), End-user (Hospitals, Specialty eye clinics, and Ambulatory surgical centers) and Geography (North America, Europe, Asia, Rest of World (ROW))
-
-
Which regions are analyzed in the report?
-
North America, Europe, Asia and Rest of World (ROW)
-
-
What are the key growth drivers and market challenges?
-
Rise in prevalence of retinal diseases, Stringent regulation in artificial retina
-
-
Who are the major players in the Artificial Retina Market?
-
Alcon Inc., Bausch Lomb Corp., Bionic Vision Tech., Carl Zeiss AG, Nano Retina, NIDEK Co. Ltd., Optobionics and Science Corp.
-
Market Research Insights
- Market momentum hinges on navigating a complex ecosystem. The regulatory approval pathway for any class III medical device requires extensive preclinical evaluation, including cytotoxicity testing and systemic toxicity assessment, with ocular irritation studies ensuring safety. Achieving breakthrough device designation accelerates this, but the reimbursement landscape and insurance coverage policies remain pivotal, influenced by patient advocacy lobbying.
- Biomedical engineering advances and nanotechnology in ophthalmology drive innovation, reducing surgical procedure complexity through minimally invasive procedures. AI-driven diagnostics support a personalized medicine approach. The goal is functional artificial vision, improving patient quality of life via form vision restoration, light perception enhancement, visual acuity improvement, field of view expansion, obstacle detection capability, and facial recognition ability.
- This depends on long-term device stability, clinical trial validation with late-stage clinical data, surgical training ecosystems for procedures like viterous cavity placement, and post-operative rehabilitation. Firms that integrate these factors see patient adoption rates increase by up to 30% and secure reimbursement 20% faster.
We can help! Our analysts can customize this artificial retina market research report to meet your requirements.
 RIA -
RIA - 
