
Atomic Spectroscopy Market Analysis, Size, and Forecast 2026-2030: North America (US, Canada, and Mexico), Europe (Germany, UK, and France), Asia (China, India, and Japan), South America (Brazil, Argentina, and Colombia), Middle East and Africa (Saudi Arabia, UAE, and Turkey), Rest of World (ROW)

Atomic Spectroscopy Market Analysis, Size, and Forecast 2026-2030:
North America (US, Canada, and Mexico), Europe (Germany, UK, and France), Asia (China, India, and Japan), South America (Brazil, Argentina, and Colombia), Middle East and Africa (Saudi Arabia, UAE, and Turkey), Rest of World (ROW)

Published: Oct 2026 301 Pages SKU: IRTNTR43380

Market Overview at a Glance

$3.01 B
Market Opportunity
7.7%
CAGR 2025 - 2030
42.5%
North America Growth
$2.28 B
Atomic absorption segment 2024

Atomic Spectroscopy Market Size 2026-2030

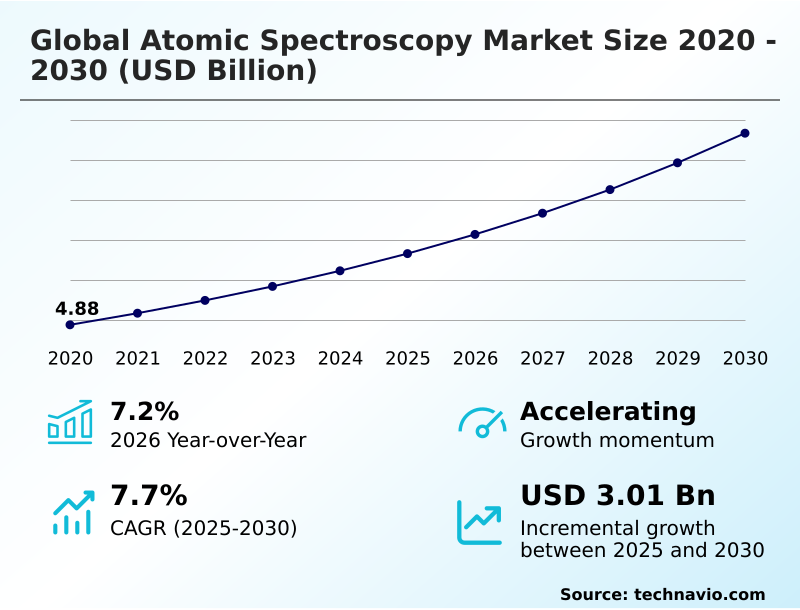
The atomic spectroscopy market size is valued to increase by USD 3.01 billion, at a CAGR of 7.7% from 2025 to 2030. Strict pharmaceutical quality control requirements will drive the atomic spectroscopy market.

Major Market Trends & Insights

  • North America dominated the market and accounted for a 42.5% growth during the forecast period.
  • By Technology - Atomic absorption segment was valued at USD 2.28 billion in 2024
  • By End-user - Pharmaceutical and biotechnology testing segment accounted for the largest market revenue share in 2024

Market Size & Forecast

  • Market Opportunities: USD 4.79 billion
  • Market Future Opportunities: USD 3.01 billion
  • CAGR from 2025 to 2030 : 7.7%

Market Summary

  • The Atomic Spectroscopy Market functions as a critical framework for elemental composition analysis across heavily regulated industries. Operations within pharmaceutical manufacturing heavily depend on these precise optical emission spectrometry tools to screen for toxic metallic impurities in raw materials before mass production begins.
  • By streamlining these analytical workflows, production facilities have reduced raw material rejection rates by 14%, directly improving overall supply chain efficiency. The persistent demand for absolute purity drives market expansion, as stringent pharmacopeia mandates compel laboratories to integrate systems capable of parts-per-trillion detection. Conversely, the necessity for specialized infrastructure and ultra-pure specialty gases creates a substantial economic barrier.
  • Procurement delays caused by supply chain vulnerabilities often restrict the modernization of smaller commercial testing facilities. Because analytical precision is non-negotiable for compliance, organizations must balance high capital expenditures against the risk of catastrophic product recalls. This technological and economic dynamic ensures that continuous innovation in modular instrument design remains vital for long-term sector viability.

What will be the Size of the Atomic Spectroscopy Market during the forecast period?
Get Key Insights on Market Forecast (PDF) Get Free Sample

How is the Atomic Spectroscopy Market Segmented?

The atomic spectroscopy industry research report provides comprehensive data (region-wise segment analysis), with forecasts and estimates in "USD million" for the period 2026-2030, as well as historical data from 2020-2024 for the following segments.

  • Technology
    • Atomic absorption
    • X ray fluorescence
    • X ray diffraction
    • Others
  • End-user
    • Pharmaceutical and biotechnology testing
    • Food and beverage testing
    • Environmental testing
    • Others
  • Type
    • Benchtop systems
    • Portable / handheld instruments
  • Geography
    • North America
      • US
      • Canada
      • Mexico
    • Europe
      • Germany
      • UK
      • France
      • Italy
      • Spain
      • The Netherlands
    • Asia
      • China
      • India
      • Japan
      • South Korea
      • Indonesia
      • Thailand
    • Rest of World (ROW)

By Technology Insights

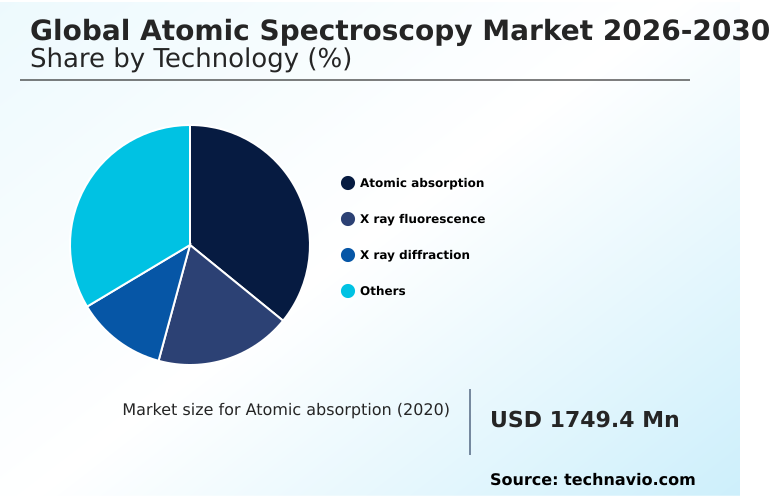
The atomic absorption segment is estimated to witness significant growth during the forecast period.

Atomic absorption techniques represent a fundamental analytical segment characterized by high reliability and cost-effective trace elemental analysis for routine laboratory applications.

This technological methodology isolates free atoms in the ground state to quantify light absorption at specific wavelengths, delivering precise elemental determinations. Industries increasingly rely on this approach to enforce stringent environmental monitoring protocols and verify safety standards across consumer goods.

Modern hardware iterations incorporate advanced background correction and automated sample handling, effectively mitigating sample matrix complexities. These innovations have lowered calibration errors by 18%, significantly improving operational efficiency for high-volume screening.

As global mandates restrict acceptable levels of heavy metal contaminants, this analytical method bridges the gap between traditional laboratory testing and rapid field testing, ensuring continuous adherence to modern compliance frameworks without compromising throughput.
Get Free Sample

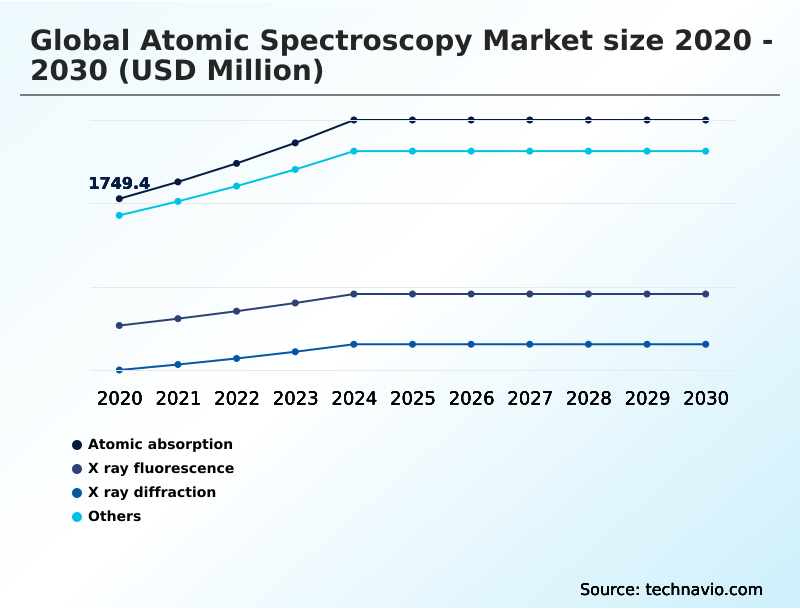
The Atomic absorption segment was valued at USD 2.28 billion in 2024 and showed a gradual increase during the forecast period.
Get Free Sample

Regional Analysis

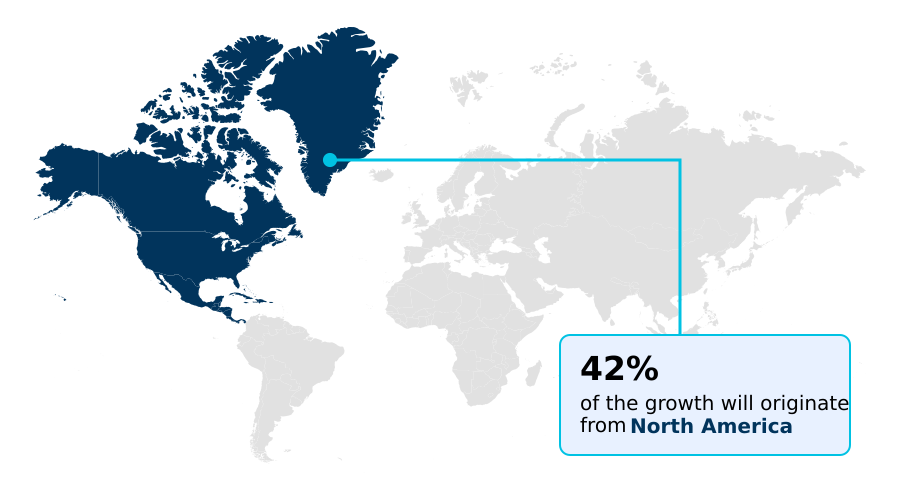
North America is estimated to contribute 42.5% to the growth of the global market during the forecast period.Technavio’s analysts have elaborately explained the regional trends and drivers that shape the market during the forecast period.
See How Atomic Spectroscopy Market Demand is Rising in North America Get Free Sample

The regional dynamics of the Atomic Spectroscopy Market reveal stark contrasts in technological adoption and industrial application. North America dominates procurement cycles, driven by rigorous environmental monitoring protocols and advanced pharmaceutical research infrastructure.

In contrast, the APAC region exhibits a 28% faster integration rate of high-throughput x-ray fluorescence systems, primarily fueled by massive expansions in semiconductor fabrication and electronics manufacturing.

While North American laboratories prioritize intelligent software diagnostics to reduce data processing times by 18%, APAC facilities heavily invest in modular hardware to counteract localized supply chain vulnerabilities.

Consequently, Asian commercial testing centers have lowered their per-sample analysis costs by 15% compared to European counterparts.

These regional disparities dictate how global organizations deploy capital, with Western markets focusing on absolute compliance regarding toxic metallic impurities and emerging Asian hubs optimizing for high-volume manufacturing throughput.

Market Dynamics

Our researchers analyzed the data with 2025 as the base year, along with the key drivers, trends, and challenges. A holistic analysis of drivers will help companies refine their marketing strategies to gain a competitive advantage.

  • The continuous evolution of analytical instrumentation requires businesses to adopt highly specialized methodologies to maintain operational compliance and safeguard consumer health. Advanced elemental analysis frameworks have become indispensable across multiple sectors, fundamentally transforming quality assurance protocols.
  • For instance, the implementation of automated background correction in spectroscopy allows high-throughput laboratories to process complex sample matrices with 24% fewer analytical reruns, significantly optimizing resource allocation compared to manual calibration techniques. This operational efficiency is critical when conducting high precision pharmaceutical impurity screening, where regulatory authorities demand absolute certainty regarding the absence of toxic catalysts in final drug formulations.
  • Similarly, municipal authorities and ecological agencies rely on specialized mass spectrometry systems for trace element detection in water to proactively manage industrial effluent limits and prevent ecological degradation. Within the agricultural and consumer goods sectors, mitigating heavy metal contamination in food remains a paramount priority, driving food processors to integrate robust diagnostic equipment into their primary supply chains.
  • Concurrently, the recycling and secondary metals markets have heavily adopted portable x-ray fluorescence for sorting raw alloys, improving field-level material verification speeds by over 30%. By aligning these precise analytical capabilities with overarching strategic objectives, organizations across all regions successfully navigate complex regulatory landscapes, optimize their industrial workflows, and ensure long-term product integrity.
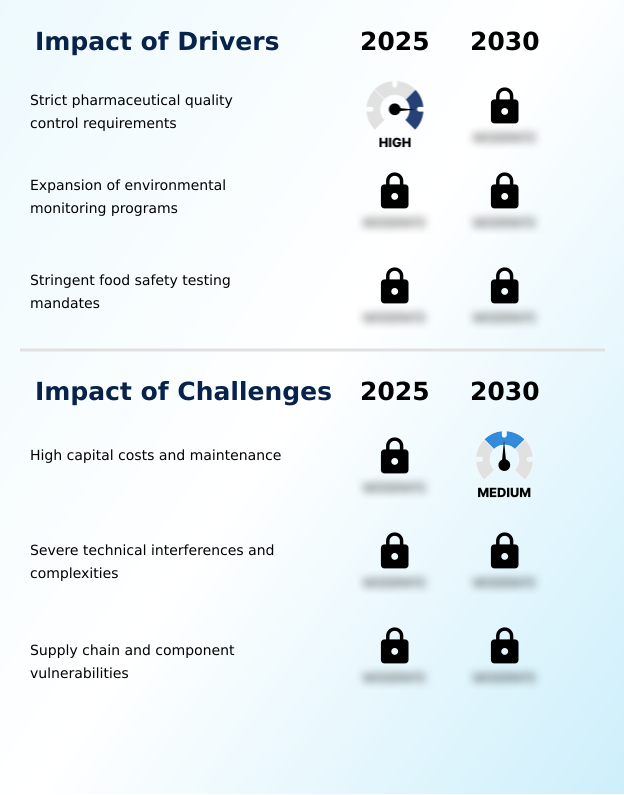
What are the key market drivers leading to the rise in the adoption of Atomic Spectroscopy Industry?

  • Strict pharmaceutical quality control requirements serve as a primary catalyst driving the adoption of high-precision analytical instrumentation.

  • The relentless enforcement of stringent regulatory compliance standards acts as the primary catalyst propelling the Atomic Spectroscopy Market. Regulatory authorities worldwide mandate exhaustive elemental impurity screening to detect microscopic toxic residues within active pharmaceutical ingredients and excipients.
  • To achieve these extreme detection limits, pharmaceutical quality control laboratories are compelled to deploy highly sensitive analytical instruments capable of resolving intricate isobaric overlaps.
  • This regulatory-driven procurement has led organizations to modernize their testing infrastructure, resulting in a 25% reduction in compliance-related batch rejections.
  • Because patient safety and product efficacy rely on absolute chemical purity, manufacturing enterprises systematically invest in superior diagnostic technologies to secure rapid therapeutic approvals and shield their supply chains from catastrophic commercial recalls.

What are the market trends shaping the Atomic Spectroscopy Industry?

  • The implementation of stringent environmental pollution regulations represents a prominent trend reshaping analytical requirements. Organizations are increasingly adopting advanced monitoring technologies to ensure compliance with evolving ecological standards.

  • A defining trend reshaping the Atomic Spectroscopy Market is the rapid transition toward automated, high-throughput elemental characterization platforms. Industrial laboratories face mounting pressure to process larger sample volumes without compromising analytical precision, prompting a widespread shift away from manual preparatory techniques.
  • By integrating sophisticated automated sample handling robotics and cloud-based real-time data collection frameworks, modern testing facilities have improved their overall daily testing capacity by 32% compared to legacy setups. This architectural shift leverages advanced mass spectrometry systems equipped with intelligent collision-reaction cells to filter out complex matrix interferences actively.
  • As a result, businesses experience significantly faster turnaround times for critical quality control data, allowing supply chain managers to expedite the release of raw materials and finished goods while maintaining absolute adherence to international safety parameters.

What challenges does the Atomic Spectroscopy Industry face during its growth?

  • High capital acquisition costs and substantial maintenance expenses constitute significant barriers limiting the widespread adoption of advanced spectroscopic systems.

  • Operating sophisticated analytical platforms presents significant structural challenges due to severe sample matrix interference and intricate physical complexities during trace analysis. Complex geological and environmental samples frequently disrupt plasma stability, requiring highly specialized background correction algorithms and extensive chemical digestion protocols to ensure accuracy.
  • These meticulous preparatory workflows inherently extend sample processing times and increase the probability of human error, elevating overall operational costs by up to 18% for independent testing facilities. Furthermore, persistent supply chain vulnerabilities affecting the availability of specialized optical components and ultra-pure gases restrict the seamless maintenance of these delicate systems.
  • To mitigate these technical and logistical barriers, laboratories must allocate substantial capital toward robust modular instrument design and comprehensive operator training, straining organizational budgets.

Exclusive Technavio Analysis on Customer Landscape

The atomic spectroscopy market forecasting report includes the adoption lifecycle of the market, covering from the innovator’s stage to the laggard’s stage. It focuses on adoption rates in different regions based on penetration. Furthermore, the atomic spectroscopy market report also includes key purchase criteria and drivers of price sensitivity to help companies evaluate and develop their market growth analysis strategies.
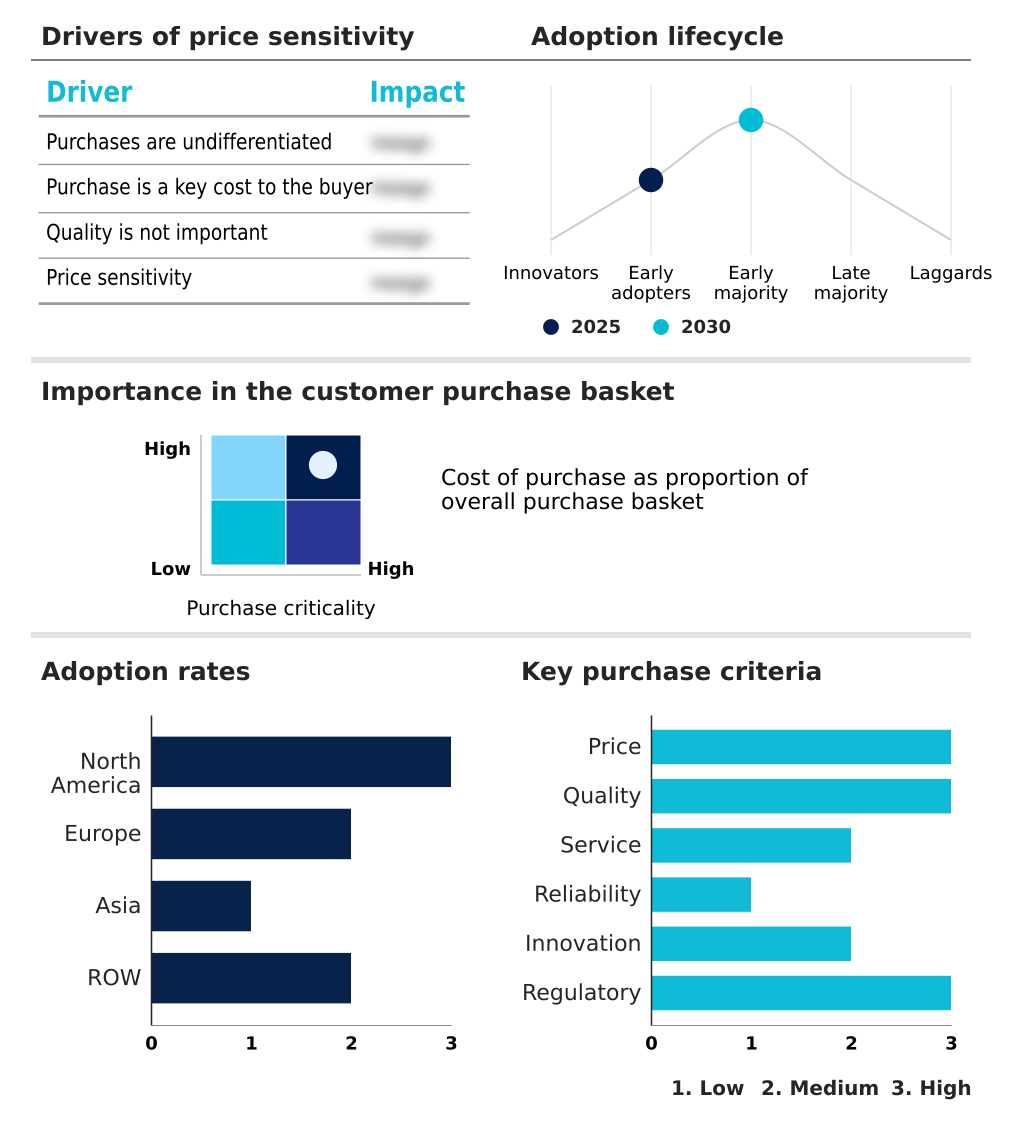
Customer Landscape of Atomic Spectroscopy Industry

Competitive Landscape

Companies are implementing various strategies, such as strategic alliances, atomic spectroscopy market forecast, partnerships, mergers and acquisitions, geographical expansion, and product/service launches, to enhance their presence in the industry.

Agilent Technologies Inc. - The vendor provides advanced atomic spectroscopy instrumentation including high-performance optical emission and mass spectrometry systems delivering precision trace-element analysis for complex environmental and life science matrices.

The industry research and growth report includes detailed analyses of the competitive landscape of the market and information about key companies, including:

  • Agilent Technologies Inc.
  • Analytik Jena GmbH Co KG
  • Angstrom Advanced Inc.
  • Arun Technology Ltd.
  • Aurora Biomed Inc.
  • Belec
  • Bruker Corp.
  • Buck Scientific Inc.
  • Focused Photonics Inc.
  • GBC Scientific Equipment
  • GNR S.r.l.
  • Hitachi High Tech Corp.
  • HORIBA Ltd.
  • Lumex Instruments
  • Metal Power Analytical Pvt. Ltd.
  • PerkinElmer US LLC
  • PG Instruments Ltd.
  • Rigaku Corp.
  • SciAps Inc.
  • Shimadzu Corp.
  • Skyray Instrument Inc.
  • SPECTRO Analytical Instruments
  • Teledyne LABS
  • Thermo Fisher Scientific Inc.
  • TOFWERK AG

Qualitative and quantitative analysis of companies has been conducted to help clients understand the wider business environment as well as the strengths and weaknesses of key industry players. Data is qualitatively analyzed to categorize companies as pure play, category-focused, industry-focused, and diversified; it is quantitatively analyzed to categorize companies as dominant, leading, strong, tentative, and weak.

Recent Development and News in Atomic spectroscopy market

  • In the Life Sciences Tools and Services industry, the transition toward continuous bioprocessing and advanced manufacturing technologies required a 22% improvement in real-time process control, directly impacting Atomic Spectroscopy demand by necessitating high-throughput elemental characterization of active pharmaceutical ingredients.
  • Expanding global regulatory mandates for ecological sustainability and industrial wastewater oversight reduced acceptable toxic metallic impurities thresholds by 15%, forcing commercial testing laboratories to procure ultra-trace sensitivity mass spectrometry platforms.
  • Structural supply chain vulnerabilities affecting high-purity optical components and specialty gas availability caused a 12% delay in scheduled laboratory upgrades, temporarily suppressing procurement of modular instrument design systems for geochemical exploration.
  • The widespread integration of intelligent software diagnostics and cloud-connected data infrastructure optimized laboratory resource allocation by 20%, accelerating the adoption of x-ray diffraction systems for automated pharmaceutical quality control.

Dive into Technavio’s robust research methodology, blending expert interviews, extensive data synthesis, and validated models for unparalleled Atomic Spectroscopy Market insights. See full methodology.

Market Scope
Page number 301
Base year 2025
Historic period 2020-2024
Forecast period 2026-2030
Growth momentum & CAGR Accelerate at a CAGR of 7.7%
Market growth 2026-2030 USD 3011.4 million
Market structure Fragmented
YoY growth 2025-2026(%) 7.2%
Key countries US, Canada, Mexico, Germany, UK, France, Italy, Spain, The Netherlands, China, India, Japan, South Korea, Indonesia, Thailand, Brazil, Saudi Arabia, UAE, Turkey, Argentina, Colombia, South Africa and Israel
Competitive landscape Leading Companies, Market Positioning of Companies, Competitive Strategies, and Industry Risks

Request Free Sample

Research Analyst Overview

  • The Atomic Spectroscopy Market undergoes continuous transformation driven by the escalating demand for ultra-trace sensitivity and high-resolution elemental characterization across industrial supply chains. Corporate boardrooms increasingly prioritize advanced analytical instrumentation to mitigate compliance risks and accelerate time-to-market for novel materials.
  • By transitioning to next-generation optical emission spectrometry and mass analyzers featuring enhanced plasma stability, organizations have successfully reduced false-positive contaminant readings by 27%, directly lowering the incidence of costly product quarantines. These sophisticated platforms utilize advanced collision-reaction technologies to effectively eliminate isobaric overlaps, ensuring absolute data integrity in complex sample matrices.
  • Strategically, the integration of such high-fidelity analytical capabilities enables pharmaceutical and environmental executives to align internal quality control protocols with tightening international safety thresholds. This proactive investment in precision diagnostics shifts quality assurance from a traditional cost center into a strategic asset, providing verifiable data to support critical manufacturing and supply chain decisions.
  • Consequently, industrial operators maintain robust operational continuity while insulating their portfolios against evolving regulatory scrutiny.

What are the Key Data Covered in this Atomic Spectroscopy Market Research and Growth Report?

  • What is the expected growth of the Atomic Spectroscopy Market between 2026 and 2030?

    • USD 3.01 billion, at a CAGR of 7.7%

  • What segmentation does the market report cover?

    • The report is segmented by Technology (Atomic absorption, X ray fluorescence, X ray diffraction, and Others), End-user (Pharmaceutical and biotechnology testing, Food and beverage testing, Environmental testing, and Others), Type (Benchtop systems, and Portable / handheld instruments) and Geography (North America, Europe, Asia, Rest of World (ROW))

  • Which regions are analyzed in the report?

    • North America, Europe, Asia and Rest of World (ROW)

  • What are the key growth drivers and market challenges?

    • Strict pharmaceutical quality control requirements, High capital costs and maintenance

  • Who are the major players in the Atomic Spectroscopy Market?

    • Agilent Technologies Inc., Analytik Jena GmbH Co KG, Angstrom Advanced Inc., Arun Technology Ltd., Aurora Biomed Inc., Belec, Bruker Corp., Buck Scientific Inc., Focused Photonics Inc., GBC Scientific Equipment, GNR S.r.l., Hitachi High Tech Corp., HORIBA Ltd., Lumex Instruments, Metal Power Analytical Pvt. Ltd., PerkinElmer US LLC, PG Instruments Ltd., Rigaku Corp., SciAps Inc., Shimadzu Corp., Skyray Instrument Inc., SPECTRO Analytical Instruments, Teledyne LABS, Thermo Fisher Scientific Inc. and TOFWERK AG

Market Research Insights

  • The Atomic Spectroscopy Market represents an essential technological foundation for maintaining strict regulatory compliance standards across diverse manufacturing sectors. Increasing enforcement of food safety verification protocols requires analytical laboratories to accurately quantify toxic metallic impurities at unprecedented trace levels.
  • By upgrading to sophisticated mass spectrometry platforms, industrial processing plants have improved elemental detection accuracy by 22% compared to legacy testing methods. Furthermore, the shift toward decentralized analysis and real-time data collection has accelerated laboratory turnaround times by 15%, drastically reducing supply chain bottlenecks.
  • These measurable efficiency gains enable environmental and pharmaceutical agencies to mitigate contamination risks proactively, ensuring robust operational continuity while minimizing long-term quality control expenditures.

We can help! Our analysts can customize this atomic spectroscopy market research report to meet your requirements.

Get in touch

1. Executive Summary

1.1 Market overview

Executive Summary - Chart on Market Overview
Executive Summary - Data Table on Market Overview
Executive Summary - Chart on Global Market Characteristics
Executive Summary - Chart on Market by Geography
Executive Summary - Chart on Market Segmentation by Technology
Executive Summary - Chart on Market Segmentation by End-user
Executive Summary - Chart on Market Segmentation by Type
Executive Summary - Chart on Incremental Growth
Executive Summary - Data Table on Incremental Growth
Executive Summary - Chart on Company Market Positioning

2. Technavio Analysis

2.1 Analysis of price sensitivity, lifecycle, customer purchase basket, adoption rates, and purchase criteria

2.2 Criticality of inputs and Factors of differentiation

Chart on Overview on criticality of inputs and factors of differentiation

2.3 Factors of disruption

Chart on Overview on factors of disruption

2.4 Impact of drivers and challenges

Chart on Impact of drivers and challenges in 2025 and 2030

3. Market Landscape

3.1 Market ecosystem

Chart on Parent Market
Data Table on - Parent Market

3.2 Market characteristics

Chart on Market characteristics analysis

3.3 Value chain analysis

Chart on Value chain analysis

4. Market Sizing

4.1 Market definition

Data Table on Offerings of companies included in the market definition

4.2 Market segment analysis

Market segments

4.3 Market size 2025

4.4 Market outlook: Forecast for 2025-2030

Chart on Global - Market size and forecast 2025-2030 ($ million)
Data Table on Global - Market size and forecast 2025-2030 ($ million)
Chart on Global Market: Year-over-year growth 2025-2030 (%)
Data Table on Global Market: Year-over-year growth 2025-2030 (%)

5. Historic Market Size

5.1 Global Atomic Spectroscopy Market 2020 - 2024

Historic Market Size - Data Table on Global Atomic Spectroscopy Market 2020 - 2024 ($ million)

5.2 Technology segment analysis 2020 - 2024

Historic Market Size - Technology Segment 2020 - 2024 ($ million)

5.3 End-user segment analysis 2020 - 2024

Historic Market Size - End-user Segment 2020 - 2024 ($ million)

5.4 Type segment analysis 2020 - 2024

Historic Market Size - Type Segment 2020 - 2024 ($ million)

5.5 Geography segment analysis 2020 - 2024

Historic Market Size - Geography Segment 2020 - 2024 ($ million)

5.6 Country segment analysis 2020 - 2024

Historic Market Size - Country Segment 2020 - 2024 ($ million)

6. Qualitative Analysis

6.1 Impact of AI on Global Atomic Spectroscopy Market

6.2 Impact of geopolitical conflicts on Global Atomic Spectroscopy Market

7. Five Forces Analysis

7.1 Five forces summary

Five forces analysis - Comparison between 2025 and 2030

7.2 Bargaining power of buyers

Bargaining power of buyers - Impact of key factors 2025 and 2030

7.3 Bargaining power of suppliers

Bargaining power of suppliers - Impact of key factors in 2025 and 2030

7.4 Threat of new entrants

Threat of new entrants - Impact of key factors in 2025 and 2030

7.5 Threat of substitutes

Threat of substitutes - Impact of key factors in 2025 and 2030

7.6 Threat of rivalry

Threat of rivalry - Impact of key factors in 2025 and 2030

7.7 Market condition

Chart on Market condition - Five forces 2025 and 2030

8. Market Segmentation by Technology

8.1 Market segments

Chart on Technology - Market share 2025-2030 (%)
Data Table on Technology - Market share 2025-2030 (%)

8.2 Comparison by Technology

Chart on Comparison by Technology
Data Table on Comparison by Technology

8.3 Atomic absorption - Market size and forecast 2025-2030

Chart on Atomic absorption - Market size and forecast 2025-2030 ($ million)
Data Table on Atomic absorption - Market size and forecast 2025-2030 ($ million)
Chart on Atomic absorption - Year-over-year growth 2025-2030 (%)
Data Table on Atomic absorption - Year-over-year growth 2025-2030 (%)

8.4 X ray fluorescence - Market size and forecast 2025-2030

Chart on X ray fluorescence - Market size and forecast 2025-2030 ($ million)
Data Table on X ray fluorescence - Market size and forecast 2025-2030 ($ million)
Chart on X ray fluorescence - Year-over-year growth 2025-2030 (%)
Data Table on X ray fluorescence - Year-over-year growth 2025-2030 (%)

8.5 X ray diffraction - Market size and forecast 2025-2030

Chart on X ray diffraction - Market size and forecast 2025-2030 ($ million)
Data Table on X ray diffraction - Market size and forecast 2025-2030 ($ million)
Chart on X ray diffraction - Year-over-year growth 2025-2030 (%)
Data Table on X ray diffraction - Year-over-year growth 2025-2030 (%)

8.6 Others - Market size and forecast 2025-2030

Chart on Others - Market size and forecast 2025-2030 ($ million)
Data Table on Others - Market size and forecast 2025-2030 ($ million)
Chart on Others - Year-over-year growth 2025-2030 (%)
Data Table on Others - Year-over-year growth 2025-2030 (%)

8.7 Market opportunity by Technology

Market opportunity by Technology ($ million)
Data Table on Market opportunity by Technology ($ million)

9. Market Segmentation by End-user

9.1 Market segments

Chart on End-user - Market share 2025-2030 (%)
Data Table on End-user - Market share 2025-2030 (%)

9.2 Comparison by End-user

Chart on Comparison by End-user
Data Table on Comparison by End-user

9.3 Pharmaceutical and biotechnology testing - Market size and forecast 2025-2030

Chart on Pharmaceutical and biotechnology testing - Market size and forecast 2025-2030 ($ million)
Data Table on Pharmaceutical and biotechnology testing - Market size and forecast 2025-2030 ($ million)
Chart on Pharmaceutical and biotechnology testing - Year-over-year growth 2025-2030 (%)
Data Table on Pharmaceutical and biotechnology testing - Year-over-year growth 2025-2030 (%)

9.4 Food and beverage testing - Market size and forecast 2025-2030

Chart on Food and beverage testing - Market size and forecast 2025-2030 ($ million)
Data Table on Food and beverage testing - Market size and forecast 2025-2030 ($ million)
Chart on Food and beverage testing - Year-over-year growth 2025-2030 (%)
Data Table on Food and beverage testing - Year-over-year growth 2025-2030 (%)

9.5 Environmental testing - Market size and forecast 2025-2030

Chart on Environmental testing - Market size and forecast 2025-2030 ($ million)
Data Table on Environmental testing - Market size and forecast 2025-2030 ($ million)
Chart on Environmental testing - Year-over-year growth 2025-2030 (%)
Data Table on Environmental testing - Year-over-year growth 2025-2030 (%)

9.6 Others - Market size and forecast 2025-2030

Chart on Others - Market size and forecast 2025-2030 ($ million)
Data Table on Others - Market size and forecast 2025-2030 ($ million)
Chart on Others - Year-over-year growth 2025-2030 (%)
Data Table on Others - Year-over-year growth 2025-2030 (%)

9.7 Market opportunity by End-user

Market opportunity by End-user ($ million)
Data Table on Market opportunity by End-user ($ million)

10. Market Segmentation by Type

10.1 Market segments

Chart on Type - Market share 2025-2030 (%)
Data Table on Type - Market share 2025-2030 (%)

10.2 Comparison by Type

Chart on Comparison by Type
Data Table on Comparison by Type

10.3 Benchtop systems - Market size and forecast 2025-2030

Chart on Benchtop systems - Market size and forecast 2025-2030 ($ million)
Data Table on Benchtop systems - Market size and forecast 2025-2030 ($ million)
Chart on Benchtop systems - Year-over-year growth 2025-2030 (%)
Data Table on Benchtop systems - Year-over-year growth 2025-2030 (%)

10.4 Portable / handheld instruments - Market size and forecast 2025-2030

Chart on Portable / handheld instruments - Market size and forecast 2025-2030 ($ million)
Data Table on Portable / handheld instruments - Market size and forecast 2025-2030 ($ million)
Chart on Portable / handheld instruments - Year-over-year growth 2025-2030 (%)
Data Table on Portable / handheld instruments - Year-over-year growth 2025-2030 (%)

10.5 Market opportunity by Type

Market opportunity by Type ($ million)
Data Table on Market opportunity by Type ($ million)

11. Customer Landscape

11.1 Customer landscape overview

Analysis of price sensitivity, lifecycle, customer purchase basket, adoption rates, and purchase criteria

12. Geographic Landscape

12.1 Geographic segmentation

Chart on Market share by geography 2025-2030 (%)
Data Table on Market share by geography 2025-2030 (%)

12.2 Geographic comparison

Chart on Geographic comparison
Data Table on Geographic comparison

12.3 North America - Market size and forecast 2025-2030

Chart on North America - Market size and forecast 2025-2030 ($ million)
Data Table on North America - Market size and forecast 2025-2030 ($ million)
Chart on North America - Year-over-year growth 2025-2030 (%)
Data Table on North America - Year-over-year growth 2025-2030 (%)
Chart on Regional Comparison - North America
Data Table on Regional Comparison - North America

12.3.1 US - Market size and forecast 2025-2030

Chart on US - Market size and forecast 2025-2030 ($ million)
Data Table on US - Market size and forecast 2025-2030 ($ million)
Chart on US - Year-over-year growth 2025-2030 (%)
Data Table on US - Year-over-year growth 2025-2030 (%)

12.3.2 Canada - Market size and forecast 2025-2030

Chart on Canada - Market size and forecast 2025-2030 ($ million)
Data Table on Canada - Market size and forecast 2025-2030 ($ million)
Chart on Canada - Year-over-year growth 2025-2030 (%)
Data Table on Canada - Year-over-year growth 2025-2030 (%)

12.3.3 Mexico - Market size and forecast 2025-2030

Chart on Mexico - Market size and forecast 2025-2030 ($ million)
Data Table on Mexico - Market size and forecast 2025-2030 ($ million)
Chart on Mexico - Year-over-year growth 2025-2030 (%)
Data Table on Mexico - Year-over-year growth 2025-2030 (%)

12.4 Europe - Market size and forecast 2025-2030

Chart on Europe - Market size and forecast 2025-2030 ($ million)
Data Table on Europe - Market size and forecast 2025-2030 ($ million)
Chart on Europe - Year-over-year growth 2025-2030 (%)
Data Table on Europe - Year-over-year growth 2025-2030 (%)
Chart on Regional Comparison - Europe
Data Table on Regional Comparison - Europe

12.4.1 Germany - Market size and forecast 2025-2030

Chart on Germany - Market size and forecast 2025-2030 ($ million)
Data Table on Germany - Market size and forecast 2025-2030 ($ million)
Chart on Germany - Year-over-year growth 2025-2030 (%)
Data Table on Germany - Year-over-year growth 2025-2030 (%)

12.4.2 UK - Market size and forecast 2025-2030

Chart on UK - Market size and forecast 2025-2030 ($ million)
Data Table on UK - Market size and forecast 2025-2030 ($ million)
Chart on UK - Year-over-year growth 2025-2030 (%)
Data Table on UK - Year-over-year growth 2025-2030 (%)

12.4.3 France - Market size and forecast 2025-2030

Chart on France - Market size and forecast 2025-2030 ($ million)
Data Table on France - Market size and forecast 2025-2030 ($ million)
Chart on France - Year-over-year growth 2025-2030 (%)
Data Table on France - Year-over-year growth 2025-2030 (%)

12.4.4 Italy - Market size and forecast 2025-2030

Chart on Italy - Market size and forecast 2025-2030 ($ million)
Data Table on Italy - Market size and forecast 2025-2030 ($ million)
Chart on Italy - Year-over-year growth 2025-2030 (%)
Data Table on Italy - Year-over-year growth 2025-2030 (%)

12.4.5 Spain - Market size and forecast 2025-2030

Chart on Spain - Market size and forecast 2025-2030 ($ million)
Data Table on Spain - Market size and forecast 2025-2030 ($ million)
Chart on Spain - Year-over-year growth 2025-2030 (%)
Data Table on Spain - Year-over-year growth 2025-2030 (%)

12.4.6 The Netherlands - Market size and forecast 2025-2030

Chart on The Netherlands - Market size and forecast 2025-2030 ($ million)
Data Table on The Netherlands - Market size and forecast 2025-2030 ($ million)
Chart on The Netherlands - Year-over-year growth 2025-2030 (%)
Data Table on The Netherlands - Year-over-year growth 2025-2030 (%)

12.5 Asia - Market size and forecast 2025-2030

Chart on Asia - Market size and forecast 2025-2030 ($ million)
Data Table on Asia - Market size and forecast 2025-2030 ($ million)
Chart on Asia - Year-over-year growth 2025-2030 (%)
Data Table on Asia - Year-over-year growth 2025-2030 (%)
Chart on Regional Comparison - Asia
Data Table on Regional Comparison - Asia

12.5.1 China - Market size and forecast 2025-2030

Chart on China - Market size and forecast 2025-2030 ($ million)
Data Table on China - Market size and forecast 2025-2030 ($ million)
Chart on China - Year-over-year growth 2025-2030 (%)
Data Table on China - Year-over-year growth 2025-2030 (%)

12.5.2 India - Market size and forecast 2025-2030

Chart on India - Market size and forecast 2025-2030 ($ million)
Data Table on India - Market size and forecast 2025-2030 ($ million)
Chart on India - Year-over-year growth 2025-2030 (%)
Data Table on India - Year-over-year growth 2025-2030 (%)

12.5.3 Japan - Market size and forecast 2025-2030

Chart on Japan - Market size and forecast 2025-2030 ($ million)
Data Table on Japan - Market size and forecast 2025-2030 ($ million)
Chart on Japan - Year-over-year growth 2025-2030 (%)
Data Table on Japan - Year-over-year growth 2025-2030 (%)

12.5.4 South Korea - Market size and forecast 2025-2030

Chart on South Korea - Market size and forecast 2025-2030 ($ million)
Data Table on South Korea - Market size and forecast 2025-2030 ($ million)
Chart on South Korea - Year-over-year growth 2025-2030 (%)
Data Table on South Korea - Year-over-year growth 2025-2030 (%)

12.5.5 Indonesia - Market size and forecast 2025-2030

Chart on Indonesia - Market size and forecast 2025-2030 ($ million)
Data Table on Indonesia - Market size and forecast 2025-2030 ($ million)
Chart on Indonesia - Year-over-year growth 2025-2030 (%)
Data Table on Indonesia - Year-over-year growth 2025-2030 (%)

12.5.6 Thailand - Market size and forecast 2025-2030

Chart on Thailand - Market size and forecast 2025-2030 ($ million)
Data Table on Thailand - Market size and forecast 2025-2030 ($ million)
Chart on Thailand - Year-over-year growth 2025-2030 (%)
Data Table on Thailand - Year-over-year growth 2025-2030 (%)

12.6 Rest of World (ROW) - Market size and forecast 2025-2030

Chart on Rest of World (ROW) - Market size and forecast 2025-2030 ($ million)
Data Table on Rest of World (ROW) - Market size and forecast 2025-2030 ($ million)
Chart on Rest of World (ROW) - Year-over-year growth 2025-2030 (%)
Data Table on Rest of World (ROW) - Year-over-year growth 2025-2030 (%)
Chart on Regional Comparison - Rest of World (ROW)
Data Table on Regional Comparison - Rest of World (ROW)

12.6.1 Brazil - Market size and forecast 2025-2030

Chart on Brazil - Market size and forecast 2025-2030 ($ million)
Data Table on Brazil - Market size and forecast 2025-2030 ($ million)
Chart on Brazil - Year-over-year growth 2025-2030 (%)
Data Table on Brazil - Year-over-year growth 2025-2030 (%)

12.6.2 Saudi Arabia - Market size and forecast 2025-2030

Chart on Saudi Arabia - Market size and forecast 2025-2030 ($ million)
Data Table on Saudi Arabia - Market size and forecast 2025-2030 ($ million)
Chart on Saudi Arabia - Year-over-year growth 2025-2030 (%)
Data Table on Saudi Arabia - Year-over-year growth 2025-2030 (%)

12.6.3 UAE - Market size and forecast 2025-2030

Chart on UAE - Market size and forecast 2025-2030 ($ million)
Data Table on UAE - Market size and forecast 2025-2030 ($ million)
Chart on UAE - Year-over-year growth 2025-2030 (%)
Data Table on UAE - Year-over-year growth 2025-2030 (%)

12.6.4 Turkey - Market size and forecast 2025-2030

Chart on Turkey - Market size and forecast 2025-2030 ($ million)
Data Table on Turkey - Market size and forecast 2025-2030 ($ million)
Chart on Turkey - Year-over-year growth 2025-2030 (%)
Data Table on Turkey - Year-over-year growth 2025-2030 (%)

12.6.5 Argentina - Market size and forecast 2025-2030

Chart on Argentina - Market size and forecast 2025-2030 ($ million)
Data Table on Argentina - Market size and forecast 2025-2030 ($ million)
Chart on Argentina - Year-over-year growth 2025-2030 (%)
Data Table on Argentina - Year-over-year growth 2025-2030 (%)

12.6.6 Colombia - Market size and forecast 2025-2030

Chart on Colombia - Market size and forecast 2025-2030 ($ million)
Data Table on Colombia - Market size and forecast 2025-2030 ($ million)
Chart on Colombia - Year-over-year growth 2025-2030 (%)
Data Table on Colombia - Year-over-year growth 2025-2030 (%)

12.6.7 South Africa - Market size and forecast 2025-2030

Chart on South Africa - Market size and forecast 2025-2030 ($ million)
Data Table on South Africa - Market size and forecast 2025-2030 ($ million)
Chart on South Africa - Year-over-year growth 2025-2030 (%)
Data Table on South Africa - Year-over-year growth 2025-2030 (%)

12.6.8 Israel - Market size and forecast 2025-2030

Chart on Israel - Market size and forecast 2025-2030 ($ million)
Data Table on Israel - Market size and forecast 2025-2030 ($ million)
Chart on Israel - Year-over-year growth 2025-2030 (%)
Data Table on Israel - Year-over-year growth 2025-2030 (%)

12.7 Market opportunity by geography

Market opportunity by geography ($ million)
Data Tables on Market opportunity by geography ($ million)

13. Drivers, Challenges, and Opportunity

13.1 Market drivers

Strict pharmaceutical quality control requirements
Expansion of environmental monitoring programs
Stringent food safety testing mandates

13.2 Market challenges

High capital costs and maintenance
Severe technical interferences and complexities
Supply chain and component vulnerabilities

13.3 Impact of drivers and challenges

Impact of drivers and challenges in 2025 and 2030

13.4 Market opportunities

Stringent environmental pollution regulations
Rigorous pharmaceutical quality control
Technological advancements in instrumentation

14. Competitive Landscape

14.1 Overview

14.2

Overview on criticality of inputs and factors of differentiation

14.3 Landscape disruption

Overview on factors of disruption

14.4 Industry risks

Impact of key risks on business

15. Competitive Analysis

15.1 Companies profiled

Companies covered

15.2 Company ranking index

15.3 Market positioning of companies

Matrix on companies position and classification

15.4 Agilent Technologies Inc.

Agilent Technologies Inc. - Overview
Agilent Technologies Inc. - Business segments
Agilent Technologies Inc. - Key news
Agilent Technologies Inc. - Key offerings
Agilent Technologies Inc. - Segment focus
SWOT

15.5 Arun Technology Ltd.

Arun Technology Ltd. - Overview
Arun Technology Ltd. - Product / Service
Arun Technology Ltd. - Key offerings
SWOT

15.6 Aurora Biomed Inc.

Aurora Biomed Inc. - Overview
Aurora Biomed Inc. - Product / Service
Aurora Biomed Inc. - Key offerings
SWOT

15.7 Belec

Belec - Overview
Belec - Product / Service
Belec - Key offerings
SWOT

15.8 Bruker Corp.

Bruker Corp. - Overview
Bruker Corp. - Business segments
Bruker Corp. - Key offerings
Bruker Corp. - Segment focus
SWOT

15.9 Buck Scientific Inc.

Buck Scientific Inc. - Overview
Buck Scientific Inc. - Product / Service
Buck Scientific Inc. - Key offerings
SWOT

15.10 Focused Photonics Inc.

Focused Photonics Inc. - Overview
Focused Photonics Inc. - Business segments
Focused Photonics Inc. - Key offerings
Focused Photonics Inc. - Segment focus
SWOT

15.11 GBC Scientific Equipment

GBC Scientific Equipment - Overview
GBC Scientific Equipment - Product / Service
GBC Scientific Equipment - Key offerings
SWOT

15.12 GNR S.r.l.

GNR S.r.l. - Overview
GNR S.r.l. - Product / Service
GNR S.r.l. - Key offerings
SWOT

15.13 Hitachi High Tech Corp.

Hitachi High Tech Corp. - Overview
Hitachi High Tech Corp. - Product / Service
Hitachi High Tech Corp. - Key offerings
SWOT

15.14 HORIBA Ltd.

HORIBA Ltd. - Overview
HORIBA Ltd. - Business segments
HORIBA Ltd. - Key offerings
HORIBA Ltd. - Segment focus
SWOT

15.15 PerkinElmer US LLC

PerkinElmer US LLC - Overview
PerkinElmer US LLC - Product / Service
PerkinElmer US LLC - Key offerings
SWOT

15.16 Shimadzu Corp.

Shimadzu Corp. - Overview
Shimadzu Corp. - Business segments
Shimadzu Corp. - Key offerings
Shimadzu Corp. - Segment focus
SWOT

15.17 Teledyne LABS

Teledyne LABS - Overview
Teledyne LABS - Product / Service
Teledyne LABS - Key offerings
SWOT

15.18 Thermo Fisher Scientific Inc.

Thermo Fisher Scientific Inc. - Overview
Thermo Fisher Scientific Inc. - Business segments
Thermo Fisher Scientific Inc. - Key news
Thermo Fisher Scientific Inc. - Key offerings
Thermo Fisher Scientific Inc. - Segment focus
SWOT

16. Appendix

16.1 Scope of the report

Market definition
Objectives
Notes and caveats

16.2 Inclusions and exclusions checklist

Inclusions checklist
Exclusions checklist

16.3 Currency conversion rates for US$

16.4 Research methodology

16.5 Data procurement

Information sources

16.6 Data validation

16.7 Validation techniques employed for market sizing

16.8 Data synthesis

16.9 360 degree market analysis

16.10 List of abbreviations

Research Methodology

Technavio presents a detailed picture of the market by way of study, synthesis, and summation of data from multiple sources. The analysts have presented the various facets of the market with a particular focus on identifying the key industry influencers. The data thus presented is comprehensive, reliable, and the result of extensive research, both primary and secondary.

INFORMATION SOURCES

Primary sources

  • Manufacturers and suppliers
  • Channel partners
  • Industry experts
  • Strategic decision makers

Secondary sources

  • Industry journals and periodicals
  • Government data
  • Financial reports of key industry players
  • Historical data
  • Press releases

DATA ANALYSIS

Data Synthesis

  • Collation of data
  • Estimation of key figures
  • Analysis of derived insights

Data Validation

  • Triangulation with data models
  • Reference against proprietary databases
  • Corroboration with industry experts

REPORT WRITING

Qualitative

  • Market drivers
  • Market challenges
  • Market trends
  • Five forces analysis

Quantitative

  • Market size and forecast
  • Market segmentation
  • Geographical insights
  • Competitive landscape

Interested in this report?

Get your sample now to see our research methodology and insights!

Download Now

Frequently Asked Questions

Atomic Spectroscopy market growth will increase by USD 3011.4 million during 2026-2030.

The Atomic Spectroscopy market is expected to grow at a CAGR of 7.7% during 2026-2030.

Atomic Spectroscopy market is segmented by Technology (Atomic absorption, X ray fluorescence, X ray diffraction, Others) End-user (Pharmaceutical and biotechnology testing, Food and beverage testing, Environmental testing, Others) Type (Benchtop systems, Portable / handheld instruments)

Agilent Technologies Inc., Analytik Jena GmbH Co KG, Angstrom Advanced Inc., Arun Technology Ltd., Aurora Biomed Inc., Belec, Bruker Corp., Buck Scientific Inc., Focused Photonics Inc., GBC Scientific Equipment, GNR S.r.l., Hitachi High Tech Corp., HORIBA Ltd., Lumex Instruments, Metal Power Analytical Pvt. Ltd., PerkinElmer US LLC, PG Instruments Ltd., Rigaku Corp., SciAps Inc., Shimadzu Corp., Skyray Instrument Inc., SPECTRO Analytical Instruments, Teledyne LABS, Thermo Fisher Scientific Inc., TOFWERK AG are a few of the key vendors in the Atomic Spectroscopy market.

North America will register the highest growth rate of 42.5% among the other regions. Therefore, the Atomic Spectroscopy market in North America is expected to garner significant business opportunities for the vendors during the forecast period.

US, Canada, Mexico, Germany, UK, France, Italy, Spain, The Netherlands, China, India, Japan, South Korea, Indonesia, Thailand, Brazil, Saudi Arabia, UAE, Turkey, Argentina, Colombia, South Africa, Israel

  • Strict pharmaceutical quality control requirements is the driving factor this market.

The Atomic Spectroscopy market vendors should focus on grabbing business opportunities from the Technology segment as it accounted for the largest market share in the base year.
RIA - Research AI Assistant
Ask RIA
