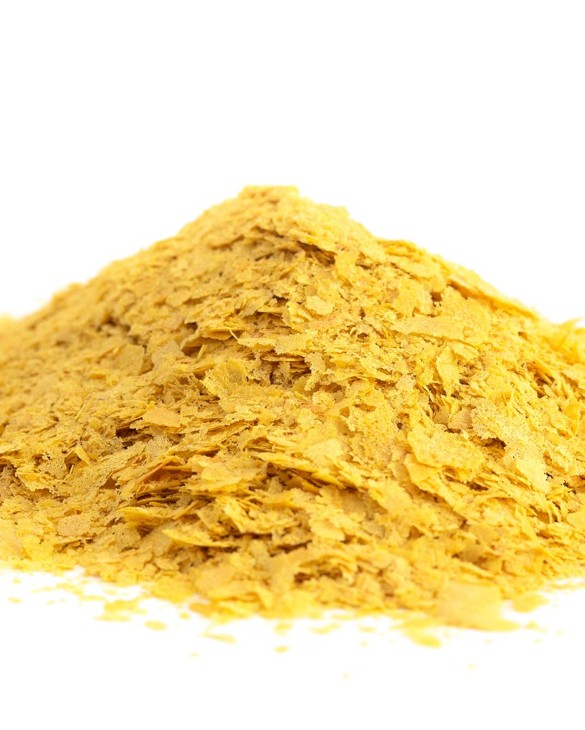
Autolyzed Yeast Extract Market Analysis, Size, and Forecast 2026-2030: Europe (UK, Germany, and France), APAC (China, Japan, and India), North America (US, Canada, and Mexico), South America (Brazil, Argentina, and Chile), Middle East and Africa (Saudi Arabia, UAE, and South Africa), and Rest of World (ROW)

Autolyzed Yeast Extract Market Analysis, Size, and Forecast 2026-2030:
Europe (UK, Germany, and France), APAC (China, Japan, and India), North America (US, Canada, and Mexico), South America (Brazil, Argentina, and Chile), Middle East and Africa (Saudi Arabia, UAE, and South Africa), and Rest of World (ROW)

Published: Oct 2026 304 Pages SKU: IRTNTR74522

Market Overview at a Glance

$312.9 Mn
Market Opportunity
4.4%
CAGR 2025 - 2030
34.2%
APAC Growth
$780.7 Mn
Powder autolyzed yeast extract segment 2024

Autolyzed Yeast Extract Market Size 2026-2030

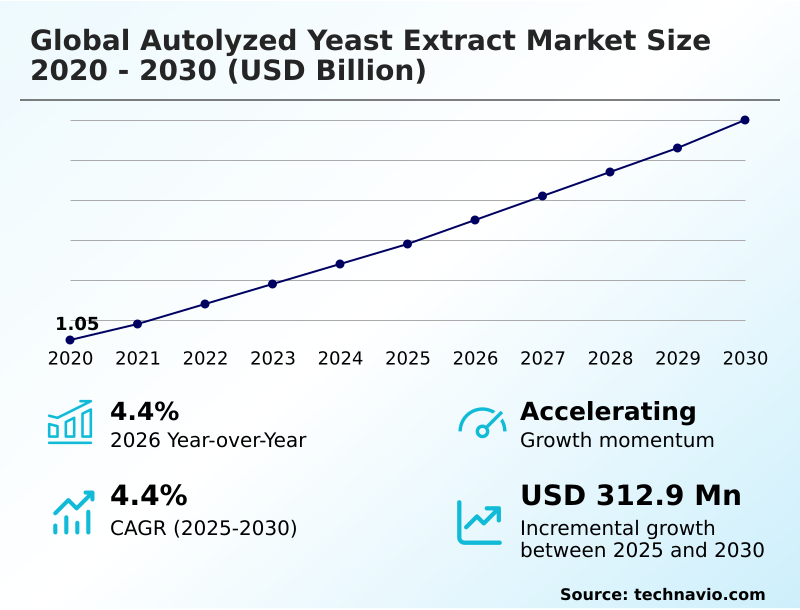
The autolyzed yeast extract market size is valued to increase by USD 312.9 million, at a CAGR of 4.4% from 2025 to 2030. Surging consumer demand for clean label ingredients drives global market expansion will drive the autolyzed yeast extract market.

Major Market Trends & Insights

  • APAC dominated the market and accounted for a 34.2% growth during the forecast period.
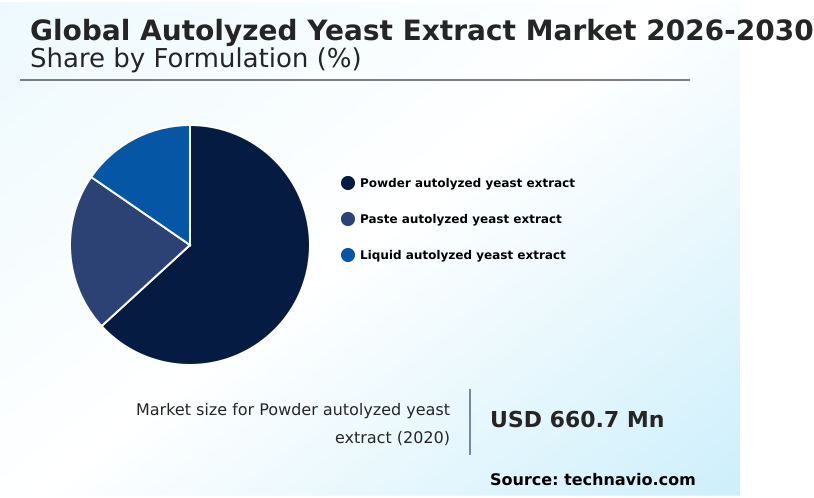
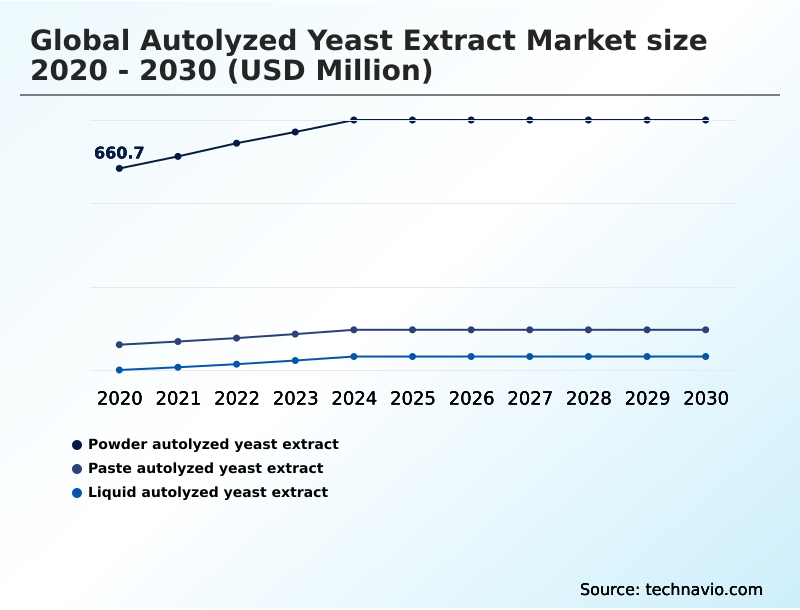
  • By Formulation - Powder autolyzed yeast extract segment was valued at USD 780.7 million in 2024
  • By Application - Food and beverages segment accounted for the largest market revenue share in 2024

Market Size & Forecast

  • Market Opportunities: USD 557 million
  • Market Future Opportunities: USD 312.9 million
  • CAGR from 2025 to 2030 : 4.4%

Market Summary

  • The Autolyzed Yeast Extract operates as a critical functional ingredient sector driven by the urgent industrial mandate to replace synthetic flavor enhancers. Industrial food processors continuously optimize supply chain formulations by substituting monosodium glutamate with natural yeast derivatives, achieving cleaner product labels without compromising sensory integrity.
  • For example, by integrating advanced yeast autolysates into processed meat production lines, manufacturers achieve a 15% reduction in sodium content while maintaining targeted umami profiles, directly supporting public health compliance strategies. The primary driver propelling this sector is the surging consumer demand for clean-label foods, which compels food brands to reformulate ingredient decks using transparently sourced fermentation products.
  • Conversely, the industry faces severe structural challenges related to upstream agricultural volatility. Fluctuating availability of sugar beet molasses directly disrupts continuous fermentation schedules, causing unpredictable raw material cost spikes that compress profit margins for mid-tier processors. Overcoming these substrate shortages requires robust procurement hedging and diversified feedstock strategies to ensure continuous manufacturing output.

What will be the Size of the Autolyzed Yeast Extract Market during the forecast period?
Get Key Insights on Market Forecast (PDF) Get Free Sample

How is the Autolyzed Yeast Extract Market Segmented?

The autolyzed yeast extract industry research report provides comprehensive data (region-wise segment analysis), with forecasts and estimates in "USD million" for the period 2026-2030, as well as historical data from 2020-2024 for the following segments.

  • Formulation
    • Powder autolyzed yeast extract
    • Paste autolyzed yeast extract
    • Liquid autolyzed yeast extract
  • Application
    • Food and beverages
    • Animal feed
    • Pharmaceuticals and nutraceuticals
    • Biotechnology and fermentation
    • Others
  • Distribution channel
    • Specialty stores
    • Supermarkets and hypermarkets
    • Online
    • Others
  • Geography
    • Europe
      • UK
      • Germany
      • France
      • Spain
      • Italy
      • The Netherlands
    • APAC
      • China
      • Japan
      • India
      • Australia
      • South Korea
      • Indonesia
    • North America
      • US
      • Canada
      • Mexico
    • South America
      • Brazil
      • Argentina
      • Chile
    • Middle East and Africa
      • Saudi Arabia
      • UAE
      • South Africa
      • Qatar
      • Egypt

By Formulation Insights

The powder autolyzed yeast extract segment is estimated to witness significant growth during the forecast period.

The powder formulation segment defines the functional ingredient landscape through superior physical stability and seamless integration into dry food processing networks.

Manufacturers utilize advanced spray drying agglomeration to achieve optimal hygroscopic powder stability, extending product shelf life and optimizing bulk logistics.

This structural format dominates formulation strategies by acting as highly efficient soluble flavor enhancers that meet rigorous demands for clean label food ingredients.

By transitioning to dry yeast formats, food processors achieve a 22% reduction in supply chain moisture control expenses, directly improving operational margins. This shift enables widespread synthetic additive replacement while supporting sustainable bio based production models.

The powder format facilitates transparent ingredient declarations and strict food safety compliance. Through precision enzyme assisted autolysis, powder formulations deliver concentrated umami profiles, allowing businesses to optimize dry seasoning blends, fermentation media nutrients, and microbial culture supplementation efficiently.
Get Free Sample

The Powder autolyzed yeast extract segment was valued at USD 780.7 million in 2024 and showed a gradual increase during the forecast period.
Get Free Sample

Regional Analysis

APAC is estimated to contribute 34.2% to the growth of the global market during the forecast period.Technavio’s analysts have elaborately explained the regional trends and drivers that shape the market during the forecast period.
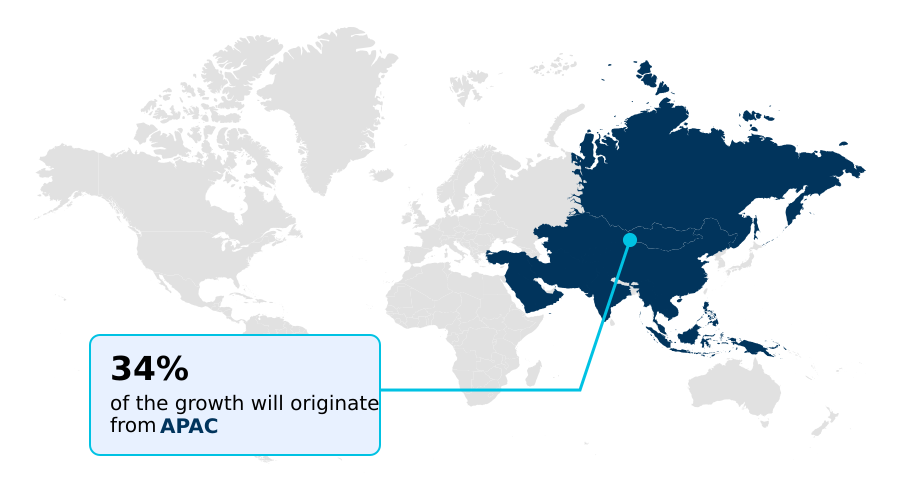
See How Autolyzed Yeast Extract Market Demand is Rising in APAC Get Free Sample

The geographic landscape of the Autolyzed Yeast Extract reveals distinct operational strategies driven by regional regulatory frameworks and dietary shifts.

Europe demonstrates a 14% higher adoption rate of advanced thermal energy recovery systems in fermentation facilities compared to North America, directly reducing carbon emissions during manufacturing.

European processors heavily leverage local sugar beet molasses substrate and spent brewer yeast biomass to secure stable, localized feedstocks, minimizing import dependencies. Consequently, supply chain resilience in Europe reduces procurement disruption costs by 18% relative to emerging markets.

Concurrently, APAC experiences rapid infrastructure expansion to meet the surging demand for vegan ready meals and natural bouillon formulations.

North American food brands focus on sustainable distribution, achieving a 22% increase in the utilization of eco friendly packaging materials for bulk ingredient transport.

These regional dynamics highlight how targeted infrastructure investments and localized sourcing optimize processing efficiency and regulatory alignment.

Market Dynamics

Our researchers analyzed the data with 2025 as the base year, along with the key drivers, trends, and challenges. A holistic analysis of drivers will help companies refine their marketing strategies to gain a competitive advantage.

  • The structural evolution of the Autolyzed Yeast Extract landscape relies heavily on continuous biotechnological optimization and the aggressive pursuit of supply chain sustainability. Ingredient manufacturers are rapidly transitioning toward precision enzyme assisted yeast autolysis, a technological upgrade that maximizes the extraction of targeted amino acids and nucleotides while minimizing energy expenditure.
  • This sophisticated processing method yields high solubility autolyzed yeast derivatives that integrate flawlessly into cold-water applications, instant beverage mixes, and clear broths without causing unwanted turbidity. By deploying these advanced derivatives, large-scale food processors achieve a 15% improvement in blending efficiency compared to traditional paste formats, significantly reducing production cycle times.
  • Simultaneously, the rising consumer demand for ethical and transparent sourcing compels manufacturers to adopt sustainable sugar beet molasses fermentation practices. This shift not only stabilizes upstream agricultural feedstock procurement but also supports the creation of premium clean label sodium reduction formulations that meet strict international nutritional standards.
  • As dietary habits shift globally, the rapid commercialization of vegan plant based savory enhancers proves essential for masking the inherent off-notes of soy and pea proteins. Facilities utilizing these engineered yeast ingredients report a 20% faster product approval rate during sensory testing phases, streamlining the speed-to-market for novel plant-based meat analogs and ensuring robust operational competitiveness.
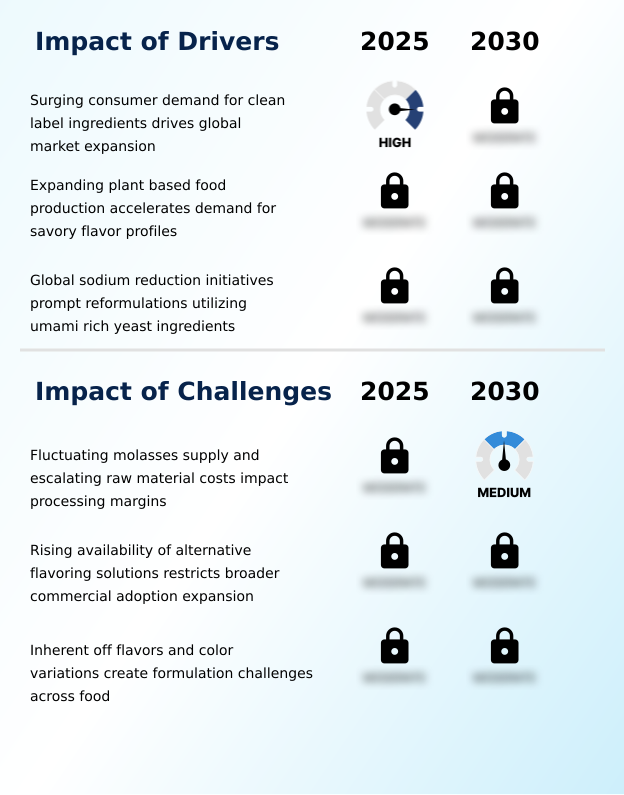
What are the key market drivers leading to the rise in the adoption of Autolyzed Yeast Extract Industry?

  • Surging consumer demand for transparent, clean-label ingredients accelerates the structural expansion of the global market.

  • The aggressive expansion of the Autolyzed Yeast Extract landscape is fundamentally propelled by the food industry mandate to secure non genetically modified ingredients for ultra-processed food reformulation.
  • Technological advancements in yeast cell wall separation and intracellular protein hydrolysis allow manufacturers to produce highly potent flavor compounds that naturally replicate artificial enhancers.
  • The urgent need for robust savory flavor masking in plant-based proteins drives processors to substitute chemical additives with these natural yeast fractions. Operations deploying engineered yeast masking solutions record a 16% decrease in sensory rejection rates during new product development.
  • Additionally, optimizing agricultural feedstock resilience stabilizes the continuous production of dietary supplement hydrolysates. These supply chain improvements reduce procurement delays by 20%, ensuring consistent ingredient availability for global food and nutraceutical brands navigating strict clean-label parameters.

What are the market trends shaping the Autolyzed Yeast Extract Industry?

  • Advanced enzymatic hydrolysis innovations enable the development of tailored, high-functionality flavor profiles. This technological progression optimizes sensory characteristics for specialized culinary and industrial applications.

  • A definitive trend redefining the Autolyzed Yeast Extract architecture is the accelerated industrial transition toward specialized enzymatic hydrolysis and zero-waste biotechnology frameworks. Fermentation facilities increasingly embed circular economy manufacturing principles, capturing spent yeast streams to generate a highly digestible nitrogen rich nutrient source for premium agricultural and animal feed applications.
  • By deploying comprehensive water recycling integration across concentration phases, advanced biorefineries achieve a 30% reduction in total freshwater consumption, dramatically lowering utility overheads. Furthermore, formulators engineer customized sensory profiles that meet strict organic processing standards, allowing culinary brands to differentiate products rapidly.
  • This precision processing technology improves target flavor extraction efficiency by 22%, enabling food manufacturers to achieve intense savory characteristics using lower ingredient dosages. These sustained operational upgrades mitigate environmental impact while delivering high-performance, tailored flavor solutions to competitive retail markets.

What challenges does the Autolyzed Yeast Extract Industry face during its growth?

  • Fluctuating molasses supplies and escalating raw material costs continuously compress operational processing margins across the industry.

  • The Autolyzed Yeast Extract environment encounters severe operational constraints stemming from the high capital expenditure required for continuous bioreactor infrastructure optimization. Scaling the production of specialized kokumi mouthfeel boosters and complex sodium reduction formulations demands rigorous energy inputs during the concentration and drying phases.
  • Processors face intense margin compression as escalating thermal energy tariffs inflate overhead manufacturing expenses by up to 18% during peak production cycles. Furthermore, achieving high purity product standardization for sensitive applications like plant based meat analogs necessitates the installation of expensive automated process controls and strict microbiological testing protocols.
  • Facilities lacking these advanced automation systems experience a 12% higher batch rejection rate due to flavor inconsistencies. These structural financial burdens disproportionately impact mid-tier manufacturers, limiting their ability to expand capacities and maintain price competitiveness against integrated global suppliers.

Exclusive Technavio Analysis on Customer Landscape

The autolyzed yeast extract market forecasting report includes the adoption lifecycle of the market, covering from the innovator’s stage to the laggard’s stage. It focuses on adoption rates in different regions based on penetration. Furthermore, the autolyzed yeast extract market report also includes key purchase criteria and drivers of price sensitivity to help companies evaluate and develop their market growth analysis strategies.
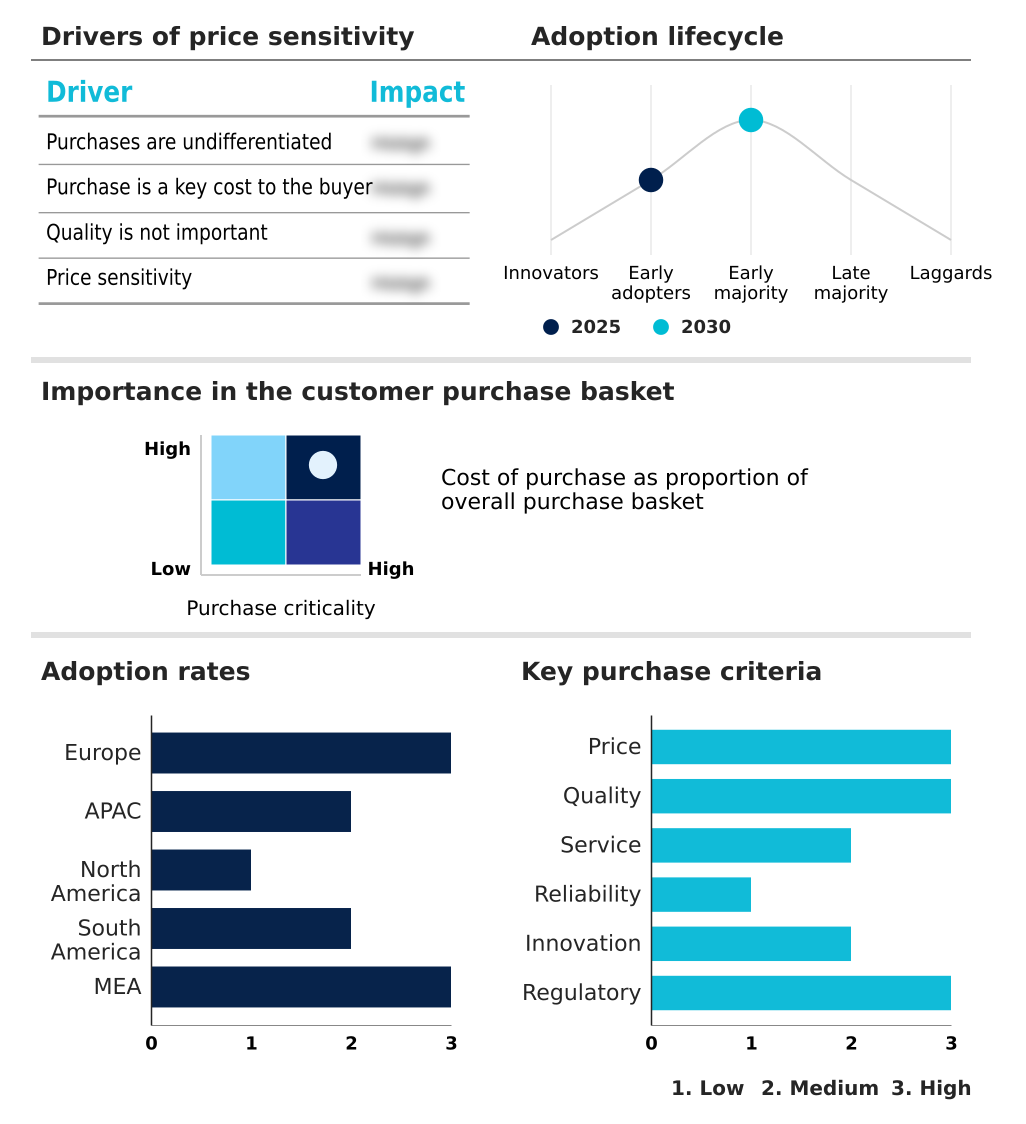
Customer Landscape of Autolyzed Yeast Extract Industry

Competitive Landscape

Companies are implementing various strategies, such as strategic alliances, autolyzed yeast extract market forecast, partnerships, mergers and acquisitions, geographical expansion, and product/service launches, to enhance their presence in the industry.

Alltech Inc. - The company delivers specialized autolyzed yeast extract products, including advanced fermentation solutions and yeast-derived nutritional ingredients, engineered to enhance animal nutrition and optimize agricultural biotechnology outcomes globally.

The industry research and growth report includes detailed analyses of the competitive landscape of the market and information about key companies, including:

  • Alltech Inc.
  • Angel Yeast Co. Ltd.
  • Biorigin S.A.
  • DSM Firmenich AG
  • Hardy Diagnostics
  • HiMedia Laboratories Pvt. Ltd.
  • Kerry Group Plc
  • Kohjin Life Sciences Co. Ltd.
  • LABORATORIOS CONDA S.A
  • Lallemand Inc.
  • Leiber GmbH
  • Lesaffre Group
  • Liofilchem Srl
  • MP Biomedicals Inc.
  • Neogen Corp.
  • Ohly GmbH
  • Sigma Aldrich Chemicals Ltd.
  • Solabia Group
  • Thermo Fisher Scientific Inc.
  • Titan Biotech Ltd.

Qualitative and quantitative analysis of companies has been conducted to help clients understand the wider business environment as well as the strengths and weaknesses of key industry players. Data is qualitatively analyzed to categorize companies as pure play, category-focused, industry-focused, and diversified; it is quantitatively analyzed to categorize companies as dominant, leading, strong, tentative, and weak.

Recent Development and News in Autolyzed yeast extract market

  • In the Packaged Foods and Meats industry, the implementation of stringent regulatory frameworks governing synthetic additives, such as the tightened European Food Safety Authority guidelines on monosodium glutamate, has forced widespread product reformulations, directly driving demand for natural Autolyzed Yeast Extract solutions.
  • The rapid scale-up of plant-based meat analog manufacturing facilities across North America and Europe requires sophisticated off-note masking technologies, accelerating the integration of specialized Autolyzed Yeast Extract formulations to achieve authentic savory profiles.
  • Global public health mandates targeting a 20% reduction in dietary sodium intake across processed foods and snacks have compelled food manufacturers to adopt umami-rich natural flavor enhancers, substantially elevating the commercial utilization of Autolyzed Yeast Extract.
  • The transition toward clean-label packaging and transparent ingredient sourcing in the consumer packaged goods sector has marginalized chemically hydrolyzed vegetable proteins, thereby pulling significant volume demand toward sustainably processed Autolyzed Yeast Extract ingredients.

Dive into Technavio’s robust research methodology, blending expert interviews, extensive data synthesis, and validated models for unparalleled Autolyzed Yeast Extract Market insights. See full methodology.

Market Scope
Page number 304
Base year 2025
Historic period 2020-2024
Forecast period 2026-2030
Growth momentum & CAGR Accelerate at a CAGR of 4.4%
Market growth 2026-2030 USD 312.9 million
Market structure Fragmented
YoY growth 2025-2026(%) 4.4%
Key countries UK, Germany, France, Spain, Italy, The Netherlands, China, Japan, India, Australia, South Korea, Indonesia, US, Canada, Mexico, Brazil, Argentina, Chile, Saudi Arabia, UAE, South Africa, Qatar and Egypt
Competitive landscape Leading Companies, Market Positioning of Companies, Competitive Strategies, and Industry Risks

Request Free Sample

Research Analyst Overview

  • The continuous evolution of the Autolyzed Yeast Extract ecosystem is characterized by the rapid transition from conventional autolysis toward highly controlled enzymatic cell lysis. Processing facilities systematically deploy specialized exogenous nuclease enzymes alongside endogenous protease breakdown to achieve precise glutamic acid release, maximizing the functional yield of the raw yeast biomass.
  • This biotechnological precision generates intense umami compound profiles rich in five prime ribonucleotides and short chain peptides, which are critical for advanced flavor engineering. By standardizing these biochemical extraction parameters, ingredient manufacturers achieve a 28% reduction in batch-to-batch flavor variability, ensuring absolute consistency for multinational food brands.
  • This consistency directly supports boardroom-level product strategies focused on clean-label compliance and sodium reduction. Companies integrating these high-performance yeast fractions into complex savory matrices effectively eliminate the need for artificial masking agents, structurally lowering total formulation costs.
  • The relentless optimization of fermentation protocols and enzymatic hydrolysis continues to reshape industrial ingredient sourcing, reinforcing the reliance on natural, bio-based umami solutions across the commercial food manufacturing spectrum.

What are the Key Data Covered in this Autolyzed Yeast Extract Market Research and Growth Report?

  • What is the expected growth of the Autolyzed Yeast Extract Market between 2026 and 2030?

    • USD 312.9 million, at a CAGR of 4.4%

  • What segmentation does the market report cover?

    • The report is segmented by Formulation (Powder autolyzed yeast extract, Paste autolyzed yeast extract, and Liquid autolyzed yeast extract), Application (Food and beverages, Animal feed, Pharmaceuticals and nutraceuticals, Biotechnology and fermentation, and Others), Distribution Channel (Specialty stores, Supermarkets and hypermarkets, Online, and Others) and Geography (Europe, APAC, North America, South America, Middle East and Africa)

  • Which regions are analyzed in the report?

    • Europe, APAC, North America, South America and Middle East and Africa

  • What are the key growth drivers and market challenges?

    • Surging consumer demand for clean label ingredients drives global market expansion, Fluctuating molasses supply and escalating raw material costs impact processing margins

  • Who are the major players in the Autolyzed Yeast Extract Market?

    • Alltech Inc., Angel Yeast Co. Ltd., Biorigin S.A., DSM Firmenich AG, Hardy Diagnostics, HiMedia Laboratories Pvt. Ltd., Kerry Group Plc, Kohjin Life Sciences Co. Ltd., LABORATORIOS CONDA S.A, Lallemand Inc., Leiber GmbH, Lesaffre Group, Liofilchem Srl, MP Biomedicals Inc., Neogen Corp., Ohly GmbH, Sigma Aldrich Chemicals Ltd., Solabia Group, Thermo Fisher Scientific Inc. and Titan Biotech Ltd.

Market Research Insights

  • The Autolyzed Yeast Extract undergoes rapid operational transformation as ingredient manufacturers upgrade biotechnology infrastructure. Facilities implementing advanced evaporation systems achieve a 25% improvement in thermal energy efficiency during downstream separation processes, substantially lowering overhead manufacturing costs. Furthermore, the integration of automated raw material traceability protocols reduces compliance auditing time by 30%, streamlining cross-border commercial distribution.
  • Industrial scale fermentation centers focus heavily on flavor impact maximization, developing highly concentrated savory profiles that allow food processors to reduce total ingredient dosage by up to 18% in final formulations. These measurable operational enhancements enable food and beverage enterprises to secure resilient supply chains while strictly adhering to evolving clean-label nutritional mandates and sustainability targets.

We can help! Our analysts can customize this autolyzed yeast extract market research report to meet your requirements.

Get in touch

1. Executive Summary

1.1 Market overview

Executive Summary - Chart on Market Overview
Executive Summary - Data Table on Market Overview
Executive Summary - Chart on Global Market Characteristics
Executive Summary - Chart on Market by Geography
Executive Summary - Chart on Market Segmentation by Formulation
Executive Summary - Chart on Market Segmentation by Application
Executive Summary - Chart on Market Segmentation by Distribution Channel
Executive Summary - Chart on Incremental Growth
Executive Summary - Data Table on Incremental Growth
Executive Summary - Chart on Company Market Positioning

2. Technavio Analysis

2.1 Analysis of price sensitivity, lifecycle, customer purchase basket, adoption rates, and purchase criteria

2.2 Criticality of inputs and Factors of differentiation

Chart on Overview on criticality of inputs and factors of differentiation

2.3 Factors of disruption

Chart on Overview on factors of disruption

2.4 Impact of drivers and challenges

Chart on Impact of drivers and challenges in 2025 and 2030

3. Market Landscape

3.1 Market ecosystem

Chart on Parent Market
Data Table on - Parent Market

3.2 Market characteristics

Chart on Market characteristics analysis

3.3 Value chain analysis

Chart on Value chain analysis

4. Market Sizing

4.1 Market definition

Data Table on Offerings of companies included in the market definition

4.2 Market segment analysis

Market segments

4.3 Market size 2025

4.4 Market outlook: Forecast for 2025-2030

Chart on Global - Market size and forecast 2025-2030 ($ million)
Data Table on Global - Market size and forecast 2025-2030 ($ million)
Chart on Global Market: Year-over-year growth 2025-2030 (%)
Data Table on Global Market: Year-over-year growth 2025-2030 (%)

5. Historic Market Size

5.1 Global Autolyzed Yeast Extract Market 2020 - 2024

Historic Market Size - Data Table on Global Autolyzed Yeast Extract Market 2020 - 2024 ($ million)

5.2 Formulation segment analysis 2020 - 2024

Historic Market Size - Formulation Segment 2020 - 2024 ($ million)

5.3 Application segment analysis 2020 - 2024

Historic Market Size - Application Segment 2020 - 2024 ($ million)

5.4 Distribution Channel segment analysis 2020 - 2024

Historic Market Size - Distribution Channel Segment 2020 - 2024 ($ million)

5.5 Geography segment analysis 2020 - 2024

Historic Market Size - Geography Segment 2020 - 2024 ($ million)

5.6 Country segment analysis 2020 - 2024

Historic Market Size - Country Segment 2020 - 2024 ($ million)

6. Qualitative Analysis

6.1 Impact of AI on global autolyzed yeast extract market

6.2 Impact of geopolitical conflicts on global autolyzed yeast extract market

7. Five Forces Analysis

7.1 Five forces summary

Five forces analysis - Comparison between 2025 and 2030

7.2 Bargaining power of buyers

Bargaining power of buyers - Impact of key factors 2025 and 2030

7.3 Bargaining power of suppliers

Bargaining power of suppliers - Impact of key factors in 2025 and 2030

7.4 Threat of new entrants

Threat of new entrants - Impact of key factors in 2025 and 2030

7.5 Threat of substitutes

Threat of substitutes - Impact of key factors in 2025 and 2030

7.6 Threat of rivalry

Threat of rivalry - Impact of key factors in 2025 and 2030

7.7 Market condition

Chart on Market condition - Five forces 2025 and 2030

8. Market Segmentation by Formulation

8.1 Market segments

Chart on Formulation - Market share 2025-2030 (%)
Data Table on Formulation - Market share 2025-2030 (%)

8.2 Comparison by Formulation

Chart on Comparison by Formulation
Data Table on Comparison by Formulation

8.3 Powder autolyzed yeast extract - Market size and forecast 2025-2030

Chart on Powder autolyzed yeast extract - Market size and forecast 2025-2030 ($ million)
Data Table on Powder autolyzed yeast extract - Market size and forecast 2025-2030 ($ million)
Chart on Powder autolyzed yeast extract - Year-over-year growth 2025-2030 (%)
Data Table on Powder autolyzed yeast extract - Year-over-year growth 2025-2030 (%)

8.4 Paste autolyzed yeast extract - Market size and forecast 2025-2030

Chart on Paste autolyzed yeast extract - Market size and forecast 2025-2030 ($ million)
Data Table on Paste autolyzed yeast extract - Market size and forecast 2025-2030 ($ million)
Chart on Paste autolyzed yeast extract - Year-over-year growth 2025-2030 (%)
Data Table on Paste autolyzed yeast extract - Year-over-year growth 2025-2030 (%)

8.5 Liquid autolyzed yeast extract - Market size and forecast 2025-2030

Chart on Liquid autolyzed yeast extract - Market size and forecast 2025-2030 ($ million)
Data Table on Liquid autolyzed yeast extract - Market size and forecast 2025-2030 ($ million)
Chart on Liquid autolyzed yeast extract - Year-over-year growth 2025-2030 (%)
Data Table on Liquid autolyzed yeast extract - Year-over-year growth 2025-2030 (%)

8.6 Market opportunity by Formulation

Market opportunity by Formulation ($ million)
Data Table on Market opportunity by Formulation ($ million)

9. Market Segmentation by Application

9.1 Market segments

Chart on Application - Market share 2025-2030 (%)
Data Table on Application - Market share 2025-2030 (%)

9.2 Comparison by Application

Chart on Comparison by Application
Data Table on Comparison by Application

9.3 Food and beverages - Market size and forecast 2025-2030

Chart on Food and beverages - Market size and forecast 2025-2030 ($ million)
Data Table on Food and beverages - Market size and forecast 2025-2030 ($ million)
Chart on Food and beverages - Year-over-year growth 2025-2030 (%)
Data Table on Food and beverages - Year-over-year growth 2025-2030 (%)

9.4 Animal feed - Market size and forecast 2025-2030

Chart on Animal feed - Market size and forecast 2025-2030 ($ million)
Data Table on Animal feed - Market size and forecast 2025-2030 ($ million)
Chart on Animal feed - Year-over-year growth 2025-2030 (%)
Data Table on Animal feed - Year-over-year growth 2025-2030 (%)

9.5 Pharmaceuticals and nutraceuticals - Market size and forecast 2025-2030

Chart on Pharmaceuticals and nutraceuticals - Market size and forecast 2025-2030 ($ million)
Data Table on Pharmaceuticals and nutraceuticals - Market size and forecast 2025-2030 ($ million)
Chart on Pharmaceuticals and nutraceuticals - Year-over-year growth 2025-2030 (%)
Data Table on Pharmaceuticals and nutraceuticals - Year-over-year growth 2025-2030 (%)

9.6 Biotechnology and fermentation - Market size and forecast 2025-2030

Chart on Biotechnology and fermentation - Market size and forecast 2025-2030 ($ million)
Data Table on Biotechnology and fermentation - Market size and forecast 2025-2030 ($ million)
Chart on Biotechnology and fermentation - Year-over-year growth 2025-2030 (%)
Data Table on Biotechnology and fermentation - Year-over-year growth 2025-2030 (%)

9.7 Others - Market size and forecast 2025-2030

Chart on Others - Market size and forecast 2025-2030 ($ million)
Data Table on Others - Market size and forecast 2025-2030 ($ million)
Chart on Others - Year-over-year growth 2025-2030 (%)
Data Table on Others - Year-over-year growth 2025-2030 (%)

9.8 Market opportunity by Application

Market opportunity by Application ($ million)
Data Table on Market opportunity by Application ($ million)

10. Market Segmentation by Distribution Channel

10.1 Market segments

Chart on Distribution Channel - Market share 2025-2030 (%)
Data Table on Distribution Channel - Market share 2025-2030 (%)

10.2 Comparison by Distribution Channel

Chart on Comparison by Distribution Channel
Data Table on Comparison by Distribution Channel

10.3 Specialty stores - Market size and forecast 2025-2030

Chart on Specialty stores - Market size and forecast 2025-2030 ($ million)
Data Table on Specialty stores - Market size and forecast 2025-2030 ($ million)
Chart on Specialty stores - Year-over-year growth 2025-2030 (%)
Data Table on Specialty stores - Year-over-year growth 2025-2030 (%)

10.4 Supermarkets and hypermarkets - Market size and forecast 2025-2030

Chart on Supermarkets and hypermarkets - Market size and forecast 2025-2030 ($ million)
Data Table on Supermarkets and hypermarkets - Market size and forecast 2025-2030 ($ million)
Chart on Supermarkets and hypermarkets - Year-over-year growth 2025-2030 (%)
Data Table on Supermarkets and hypermarkets - Year-over-year growth 2025-2030 (%)

10.5 Online - Market size and forecast 2025-2030

Chart on Online - Market size and forecast 2025-2030 ($ million)
Data Table on Online - Market size and forecast 2025-2030 ($ million)
Chart on Online - Year-over-year growth 2025-2030 (%)
Data Table on Online - Year-over-year growth 2025-2030 (%)

10.6 Others - Market size and forecast 2025-2030

Chart on Others - Market size and forecast 2025-2030 ($ million)
Data Table on Others - Market size and forecast 2025-2030 ($ million)
Chart on Others - Year-over-year growth 2025-2030 (%)
Data Table on Others - Year-over-year growth 2025-2030 (%)

10.7 Market opportunity by Distribution Channel

Market opportunity by Distribution Channel ($ million)
Data Table on Market opportunity by Distribution Channel ($ million)

11. Customer Landscape

11.1 Customer landscape overview

Analysis of price sensitivity, lifecycle, customer purchase basket, adoption rates, and purchase criteria

12. Geographic Landscape

12.1 Geographic segmentation

Chart on Market share by geography 2025-2030 (%)
Data Table on Market share by geography 2025-2030 (%)

12.2 Geographic comparison

Chart on Geographic comparison
Data Table on Geographic comparison

12.3 Europe - Market size and forecast 2025-2030

Chart on Europe - Market size and forecast 2025-2030 ($ million)
Data Table on Europe - Market size and forecast 2025-2030 ($ million)
Chart on Europe - Year-over-year growth 2025-2030 (%)
Data Table on Europe - Year-over-year growth 2025-2030 (%)
Chart on Regional Comparison - Europe
Data Table on Regional Comparison - Europe

12.3.1 UK - Market size and forecast 2025-2030

Chart on UK - Market size and forecast 2025-2030 ($ million)
Data Table on UK - Market size and forecast 2025-2030 ($ million)
Chart on UK - Year-over-year growth 2025-2030 (%)
Data Table on UK - Year-over-year growth 2025-2030 (%)

12.3.2 Germany - Market size and forecast 2025-2030

Chart on Germany - Market size and forecast 2025-2030 ($ million)
Data Table on Germany - Market size and forecast 2025-2030 ($ million)
Chart on Germany - Year-over-year growth 2025-2030 (%)
Data Table on Germany - Year-over-year growth 2025-2030 (%)

12.3.3 France - Market size and forecast 2025-2030

Chart on France - Market size and forecast 2025-2030 ($ million)
Data Table on France - Market size and forecast 2025-2030 ($ million)
Chart on France - Year-over-year growth 2025-2030 (%)
Data Table on France - Year-over-year growth 2025-2030 (%)

12.3.4 Spain - Market size and forecast 2025-2030

Chart on Spain - Market size and forecast 2025-2030 ($ million)
Data Table on Spain - Market size and forecast 2025-2030 ($ million)
Chart on Spain - Year-over-year growth 2025-2030 (%)
Data Table on Spain - Year-over-year growth 2025-2030 (%)

12.3.5 Italy - Market size and forecast 2025-2030

Chart on Italy - Market size and forecast 2025-2030 ($ million)
Data Table on Italy - Market size and forecast 2025-2030 ($ million)
Chart on Italy - Year-over-year growth 2025-2030 (%)
Data Table on Italy - Year-over-year growth 2025-2030 (%)

12.3.6 The Netherlands - Market size and forecast 2025-2030

Chart on The Netherlands - Market size and forecast 2025-2030 ($ million)
Data Table on The Netherlands - Market size and forecast 2025-2030 ($ million)
Chart on The Netherlands - Year-over-year growth 2025-2030 (%)
Data Table on The Netherlands - Year-over-year growth 2025-2030 (%)

12.4 APAC - Market size and forecast 2025-2030

Chart on APAC - Market size and forecast 2025-2030 ($ million)
Data Table on APAC - Market size and forecast 2025-2030 ($ million)
Chart on APAC - Year-over-year growth 2025-2030 (%)
Data Table on APAC - Year-over-year growth 2025-2030 (%)
Chart on Regional Comparison - APAC
Data Table on Regional Comparison - APAC

12.4.1 China - Market size and forecast 2025-2030

Chart on China - Market size and forecast 2025-2030 ($ million)
Data Table on China - Market size and forecast 2025-2030 ($ million)
Chart on China - Year-over-year growth 2025-2030 (%)
Data Table on China - Year-over-year growth 2025-2030 (%)

12.4.2 Japan - Market size and forecast 2025-2030

Chart on Japan - Market size and forecast 2025-2030 ($ million)
Data Table on Japan - Market size and forecast 2025-2030 ($ million)
Chart on Japan - Year-over-year growth 2025-2030 (%)
Data Table on Japan - Year-over-year growth 2025-2030 (%)

12.4.3 India - Market size and forecast 2025-2030

Chart on India - Market size and forecast 2025-2030 ($ million)
Data Table on India - Market size and forecast 2025-2030 ($ million)
Chart on India - Year-over-year growth 2025-2030 (%)
Data Table on India - Year-over-year growth 2025-2030 (%)

12.4.4 Australia - Market size and forecast 2025-2030

Chart on Australia - Market size and forecast 2025-2030 ($ million)
Data Table on Australia - Market size and forecast 2025-2030 ($ million)
Chart on Australia - Year-over-year growth 2025-2030 (%)
Data Table on Australia - Year-over-year growth 2025-2030 (%)

12.4.5 South Korea - Market size and forecast 2025-2030

Chart on South Korea - Market size and forecast 2025-2030 ($ million)
Data Table on South Korea - Market size and forecast 2025-2030 ($ million)
Chart on South Korea - Year-over-year growth 2025-2030 (%)
Data Table on South Korea - Year-over-year growth 2025-2030 (%)

12.4.6 Indonesia - Market size and forecast 2025-2030

Chart on Indonesia - Market size and forecast 2025-2030 ($ million)
Data Table on Indonesia - Market size and forecast 2025-2030 ($ million)
Chart on Indonesia - Year-over-year growth 2025-2030 (%)
Data Table on Indonesia - Year-over-year growth 2025-2030 (%)

12.5 North America - Market size and forecast 2025-2030

Chart on North America - Market size and forecast 2025-2030 ($ million)
Data Table on North America - Market size and forecast 2025-2030 ($ million)
Chart on North America - Year-over-year growth 2025-2030 (%)
Data Table on North America - Year-over-year growth 2025-2030 (%)
Chart on Regional Comparison - North America
Data Table on Regional Comparison - North America

12.5.1 US - Market size and forecast 2025-2030

Chart on US - Market size and forecast 2025-2030 ($ million)
Data Table on US - Market size and forecast 2025-2030 ($ million)
Chart on US - Year-over-year growth 2025-2030 (%)
Data Table on US - Year-over-year growth 2025-2030 (%)

12.5.2 Canada - Market size and forecast 2025-2030

Chart on Canada - Market size and forecast 2025-2030 ($ million)
Data Table on Canada - Market size and forecast 2025-2030 ($ million)
Chart on Canada - Year-over-year growth 2025-2030 (%)
Data Table on Canada - Year-over-year growth 2025-2030 (%)

12.5.3 Mexico - Market size and forecast 2025-2030

Chart on Mexico - Market size and forecast 2025-2030 ($ million)
Data Table on Mexico - Market size and forecast 2025-2030 ($ million)
Chart on Mexico - Year-over-year growth 2025-2030 (%)
Data Table on Mexico - Year-over-year growth 2025-2030 (%)

12.6 South America - Market size and forecast 2025-2030

Chart on South America - Market size and forecast 2025-2030 ($ million)
Data Table on South America - Market size and forecast 2025-2030 ($ million)
Chart on South America - Year-over-year growth 2025-2030 (%)
Data Table on South America - Year-over-year growth 2025-2030 (%)
Chart on Regional Comparison - South America
Data Table on Regional Comparison - South America

12.6.1 Brazil - Market size and forecast 2025-2030

Chart on Brazil - Market size and forecast 2025-2030 ($ million)
Data Table on Brazil - Market size and forecast 2025-2030 ($ million)
Chart on Brazil - Year-over-year growth 2025-2030 (%)
Data Table on Brazil - Year-over-year growth 2025-2030 (%)

12.6.2 Argentina - Market size and forecast 2025-2030

Chart on Argentina - Market size and forecast 2025-2030 ($ million)
Data Table on Argentina - Market size and forecast 2025-2030 ($ million)
Chart on Argentina - Year-over-year growth 2025-2030 (%)
Data Table on Argentina - Year-over-year growth 2025-2030 (%)

12.6.3 Chile - Market size and forecast 2025-2030

Chart on Chile - Market size and forecast 2025-2030 ($ million)
Data Table on Chile - Market size and forecast 2025-2030 ($ million)
Chart on Chile - Year-over-year growth 2025-2030 (%)
Data Table on Chile - Year-over-year growth 2025-2030 (%)

12.7 Middle East and Africa - Market size and forecast 2025-2030

Chart on Middle East and Africa - Market size and forecast 2025-2030 ($ million)
Data Table on Middle East and Africa - Market size and forecast 2025-2030 ($ million)
Chart on Middle East and Africa - Year-over-year growth 2025-2030 (%)
Data Table on Middle East and Africa - Year-over-year growth 2025-2030 (%)
Chart on Regional Comparison - Middle East and Africa
Data Table on Regional Comparison - Middle East and Africa

12.7.1 Saudi Arabia - Market size and forecast 2025-2030

Chart on Saudi Arabia - Market size and forecast 2025-2030 ($ million)
Data Table on Saudi Arabia - Market size and forecast 2025-2030 ($ million)
Chart on Saudi Arabia - Year-over-year growth 2025-2030 (%)
Data Table on Saudi Arabia - Year-over-year growth 2025-2030 (%)

12.7.2 UAE - Market size and forecast 2025-2030

Chart on UAE - Market size and forecast 2025-2030 ($ million)
Data Table on UAE - Market size and forecast 2025-2030 ($ million)
Chart on UAE - Year-over-year growth 2025-2030 (%)
Data Table on UAE - Year-over-year growth 2025-2030 (%)

12.7.3 South Africa - Market size and forecast 2025-2030

Chart on South Africa - Market size and forecast 2025-2030 ($ million)
Data Table on South Africa - Market size and forecast 2025-2030 ($ million)
Chart on South Africa - Year-over-year growth 2025-2030 (%)
Data Table on South Africa - Year-over-year growth 2025-2030 (%)

12.7.4 Qatar - Market size and forecast 2025-2030

Chart on Qatar - Market size and forecast 2025-2030 ($ million)
Data Table on Qatar - Market size and forecast 2025-2030 ($ million)
Chart on Qatar - Year-over-year growth 2025-2030 (%)
Data Table on Qatar - Year-over-year growth 2025-2030 (%)

12.7.5 Egypt - Market size and forecast 2025-2030

Chart on Egypt - Market size and forecast 2025-2030 ($ million)
Data Table on Egypt - Market size and forecast 2025-2030 ($ million)
Chart on Egypt - Year-over-year growth 2025-2030 (%)
Data Table on Egypt - Year-over-year growth 2025-2030 (%)

12.8 Market opportunity by geography

Market opportunity by geography ($ million)
Data Tables on Market opportunity by geography ($ million)

13. Drivers, Challenges, and Opportunity

13.1 Market drivers

Surging consumer demand for clean label ingredients drives global market expansion
Expanding plant based food production accelerates demand for savory flavor profiles
Global sodium reduction initiatives prompt reformulations utilizing umami rich yeast ingredients

13.2 Market challenges

Fluctuating molasses supply and escalating raw material costs impact processing margins
Rising availability of alternative flavoring solutions restricts broader commercial adoption expansion
Inherent off flavors and color variations create formulation challenges across food

13.3 Impact of drivers and challenges

Impact of drivers and challenges in 2025 and 2030

13.4 Market opportunities

Advanced enzymatic hydrolysis innovations enable tailored high functionality flavor profiles
Growing demand for non gmo certified ingredients transforms product development strategies
Rising pet food humanization fuels adoption of palatability enhancing yeast ingredients

14. Competitive Landscape

14.1 Overview

14.2

Overview on criticality of inputs and factors of differentiation

14.3 Landscape disruption

Overview on factors of disruption

14.4 Industry risks

Impact of key risks on business

15. Competitive Analysis

15.1 Companies profiled

Companies covered

15.2 Company ranking index

15.3 Market positioning of companies

Matrix on companies position and classification

15.4 Alltech Inc.

Alltech Inc. - Overview
Alltech Inc. - Product / Service
Alltech Inc. - Key offerings
SWOT

15.5 Angel Yeast Co. Ltd.

Angel Yeast Co. Ltd. - Overview
Angel Yeast Co. Ltd. - Product / Service
Angel Yeast Co. Ltd. - Key offerings
SWOT

15.6 Biorigin S.A.

Biorigin S.A. - Overview
Biorigin S.A. - Product / Service
Biorigin S.A. - Key offerings
SWOT

15.7 DSM Firmenich AG

DSM Firmenich AG - Overview
DSM Firmenich AG - Business segments
DSM Firmenich AG - Key offerings
DSM Firmenich AG - Segment focus
SWOT

15.8 Hardy Diagnostics

Hardy Diagnostics - Overview
Hardy Diagnostics - Product / Service
Hardy Diagnostics - Key offerings
SWOT

15.9 HiMedia Laboratories Pvt. Ltd.

HiMedia Laboratories Pvt. Ltd. - Overview
HiMedia Laboratories Pvt. Ltd. - Product / Service
HiMedia Laboratories Pvt. Ltd. - Key offerings
SWOT

15.10 Kerry Group Plc

Kerry Group Plc - Overview
Kerry Group Plc - Business segments
Kerry Group Plc - Key news
Kerry Group Plc - Key offerings
Kerry Group Plc - Segment focus
SWOT

15.11 LABORATORIOS CONDA S.A

LABORATORIOS CONDA S.A - Overview
LABORATORIOS CONDA S.A - Product / Service
LABORATORIOS CONDA S.A - Key offerings
SWOT

15.12 Lallemand Inc.

Lallemand Inc. - Overview
Lallemand Inc. - Product / Service
Lallemand Inc. - Key offerings
SWOT

15.13 Lesaffre Group

Lesaffre Group - Overview
Lesaffre Group - Product / Service
Lesaffre Group - Key offerings
SWOT

15.14 Neogen Corp.

Neogen Corp. - Overview
Neogen Corp. - Business segments
Neogen Corp. - Key offerings
Neogen Corp. - Segment focus
SWOT

15.15 Ohly GmbH

Ohly GmbH - Overview
Ohly GmbH - Product / Service
Ohly GmbH - Key offerings
SWOT

15.16 Sigma Aldrich Chemicals Ltd.

Sigma Aldrich Chemicals Ltd. - Overview
Sigma Aldrich Chemicals Ltd. - Product / Service
Sigma Aldrich Chemicals Ltd. - Key offerings
SWOT

15.17 Thermo Fisher Scientific Inc.

Thermo Fisher Scientific Inc. - Overview
Thermo Fisher Scientific Inc. - Business segments
Thermo Fisher Scientific Inc. - Key news
Thermo Fisher Scientific Inc. - Key offerings
Thermo Fisher Scientific Inc. - Segment focus
SWOT

15.18 Titan Biotech Ltd.

Titan Biotech Ltd. - Overview
Titan Biotech Ltd. - Product / Service
Titan Biotech Ltd. - Key offerings
SWOT

16. Appendix

16.1 Scope of the report

Market definition
Objectives
Notes and caveats

16.2 Inclusions and exclusions checklist

Inclusions checklist
Exclusions checklist

16.3 Currency conversion rates for US$

16.4 Research methodology

16.5 Data procurement

Information sources

16.6 Data validation

16.7 Validation techniques employed for market sizing

16.8 Data synthesis

16.9 360 degree market analysis

16.10 List of abbreviations

Research Methodology

Technavio presents a detailed picture of the market by way of study, synthesis, and summation of data from multiple sources. The analysts have presented the various facets of the market with a particular focus on identifying the key industry influencers. The data thus presented is comprehensive, reliable, and the result of extensive research, both primary and secondary.

INFORMATION SOURCES

Primary sources

  • Manufacturers and suppliers
  • Channel partners
  • Industry experts
  • Strategic decision makers

Secondary sources

  • Industry journals and periodicals
  • Government data
  • Financial reports of key industry players
  • Historical data
  • Press releases

DATA ANALYSIS

Data Synthesis

  • Collation of data
  • Estimation of key figures
  • Analysis of derived insights

Data Validation

  • Triangulation with data models
  • Reference against proprietary databases
  • Corroboration with industry experts

REPORT WRITING

Qualitative

  • Market drivers
  • Market challenges
  • Market trends
  • Five forces analysis

Quantitative

  • Market size and forecast
  • Market segmentation
  • Geographical insights
  • Competitive landscape

Interested in this report?

Get your sample now to see our research methodology and insights!

Download Now

Frequently Asked Questions

Autolyzed Yeast Extract market growth will increase by USD 312.9 million during 2026-2030.

The Autolyzed Yeast Extract market is expected to grow at a CAGR of 4.4% during 2026-2030.

Autolyzed Yeast Extract market is segmented by Formulation (Powder autolyzed yeast extract, Paste autolyzed yeast extract, Liquid autolyzed yeast extract) Application (Food and beverages, Animal feed, Pharmaceuticals and nutraceuticals, Biotechnology and fermentation, Others) Distribution channel (Specialty stores, Supermarkets and hypermarkets, Online, Others)

Alltech Inc., Angel Yeast Co. Ltd., Biorigin S.A., DSM Firmenich AG, Hardy Diagnostics, HiMedia Laboratories Pvt. Ltd., Kerry Group Plc, Kohjin Life Sciences Co. Ltd., LABORATORIOS CONDA S.A, Lallemand Inc., Leiber GmbH, Lesaffre Group, Liofilchem Srl, MP Biomedicals Inc., Neogen Corp., Ohly GmbH, Sigma Aldrich Chemicals Ltd., Solabia Group, Thermo Fisher Scientific Inc., Titan Biotech Ltd. are a few of the key vendors in the Autolyzed Yeast Extract market.

APAC will register the highest growth rate of 34.2% among the other regions. Therefore, the Autolyzed Yeast Extract market in APAC is expected to garner significant business opportunities for the vendors during the forecast period.

UK, Germany, France, Spain, Italy, The Netherlands, China, Japan, India, Australia, South Korea, Indonesia, US, Canada, Mexico, Brazil, Argentina, Chile, Saudi Arabia, UAE, South Africa, Qatar, Egypt

  • Surging consumer demand for clean label ingredients drives global market expansion is the driving factor this market.

The Autolyzed Yeast Extract market vendors should focus on grabbing business opportunities from the Formulation segment as it accounted for the largest market share in the base year.
RIA - Research AI Assistant
Ask RIA
