Automated Liquid Handlers Market Size 2025-2029
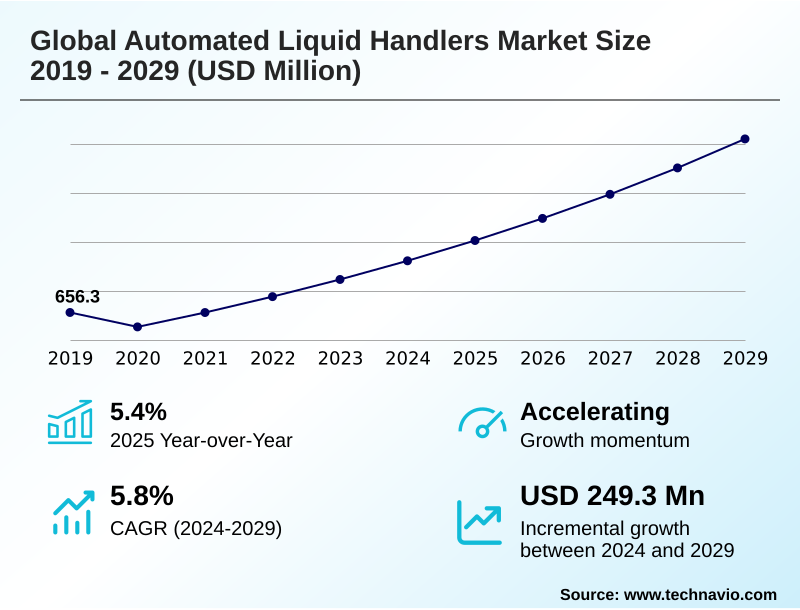
The automated liquid handlers market size is valued to increase by USD 249.3 million, at a CAGR of 5.8% from 2024 to 2029. Rising demand for automated liquid handlers in drug discovery will drive the automated liquid handlers market.
Major Market Trends & Insights
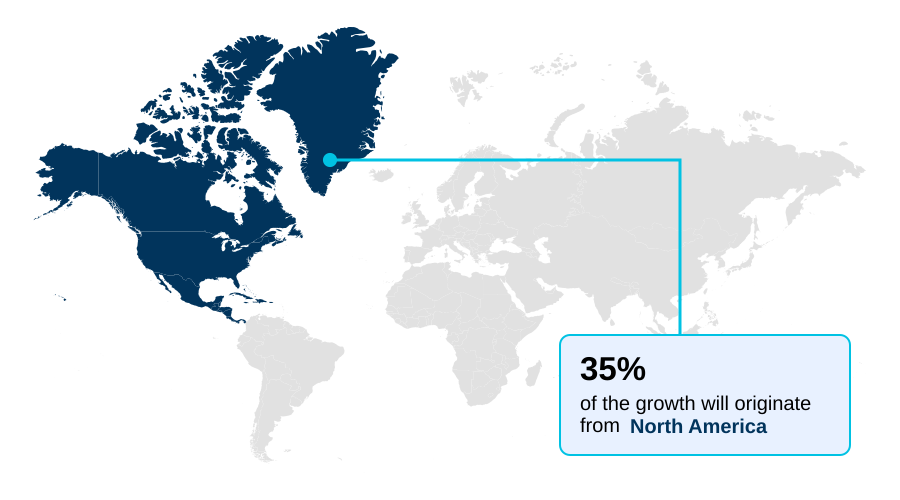
- North America dominated the market and accounted for a 35.1% growth during the forecast period.
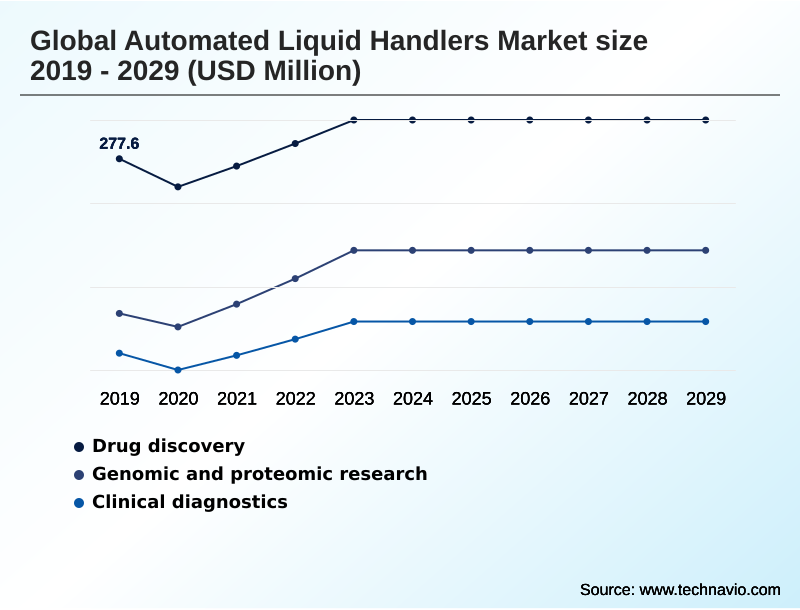
- By Application - Drug discovery segment was valued at USD 297.2 million in 2023
- By Product Type - Robotic liquid-handling workstations segment accounted for the largest market revenue share in 2023
Market Size & Forecast
- Market Opportunities: USD 355 million
- Market Future Opportunities: USD 249.3 million
- CAGR from 2024 to 2029 : 5.8%
Market Summary
- The automated liquid handlers market is defined by a relentless drive for efficiency and precision in laboratory settings. These systems are fundamental to modern life sciences, where the need for high-throughput screening and reproducible data is paramount.
- A key driver is the expansion of drug discovery programs, which rely on robotic liquid-handling workstations to perform complex tasks like serial dilution protocols and assay miniaturization, minimizing reagent costs and accelerating timelines. The integration of advanced protocol optimization software and error handling mechanisms is a significant trend, transforming these instruments into intelligent platforms.
- For instance, a biotech startup can leverage a modular platform integration to automate its entire NGS library preparation workflow, reducing manual touchpoints and improving data traceability for regulatory submissions. However, the high initial investment and the need for specialized expertise to manage LIMS integration and instrument calibration records can be significant hurdles, particularly for smaller labs.
- These dynamics push companies to innovate on both performance and accessibility, ensuring the technology supports a broadening range of scientific endeavors from large-scale genomic research to personalized clinical diagnostics workflow.
What will be the Size of the Automated Liquid Handlers Market during the forecast period?
Get Key Insights on Market Forecast (PDF) Get Free Sample
How is the Automated Liquid Handlers Market Segmented?
The automated liquid handlers industry research report provides comprehensive data (region-wise segment analysis), with forecasts and estimates in "USD million" for the period 2025-2029, as well as historical data from 2019-2023 for the following segments.
- Application
- Drug discovery
- Genomic and proteomic research
- Clinical diagnostics
- Product type
- Robotic liquid-handling workstations
- Reagents and consumables
- Accessories and peripherals
- End-user
- Pharmaceutical and biotechnology industry
- Clinical and reference laboratories
- Others
- Geography
- North America
- US
- Canada
- Mexico
- Europe
- Germany
- UK
- France
- Asia
- Rest of World (ROW)
- North America
By Application Insights
The drug discovery segment is estimated to witness significant growth during the forecast period.
The drug discovery segment is a primary user of automated liquid handlers, driven by the need for high-throughput screening and assay miniaturization.
These systems, including robotic liquid-handling workstations, are crucial for lead identification, utilizing features like nanoliter dispensing and PCR setup automation.
Key activities such as compound management and cell-based assay automation benefit from the precision of air displacement pipetting, which significantly improves data reproducibility. Integrating lab automation software enables complex serial dilution protocols and streamlines genomic sample preparation.
The adoption of robotic plate handling has been shown to reduce protocol execution errors by over 15%.
This focus on walkaway automation and end-to-end workflow automation is essential for accelerating research timelines in a competitive landscape, demanding both high-throughput liquid handling and stringent liquid handling quality control.
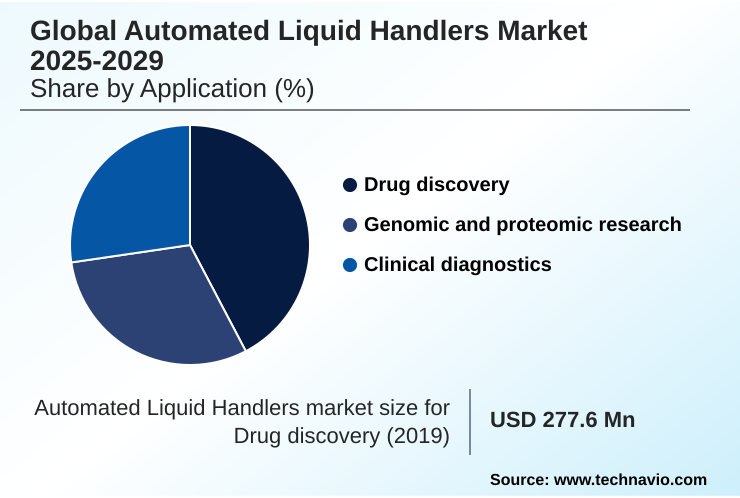
The Drug discovery segment was valued at USD 297.2 million in 2023 and showed a gradual increase during the forecast period.
Regional Analysis
North America is estimated to contribute 35.1% to the growth of the global market during the forecast period.Technavio’s analysts have elaborately explained the regional trends and drivers that shape the market during the forecast period.
See How Automated Liquid Handlers Market Demand is Rising in North America Get Free Sample
The geographic landscape of the global automated liquid handlers market is led by North America, which accounts for over 35% of the market opportunity, driven by substantial research funding and a high concentration of pharmaceutical and biotech firms.
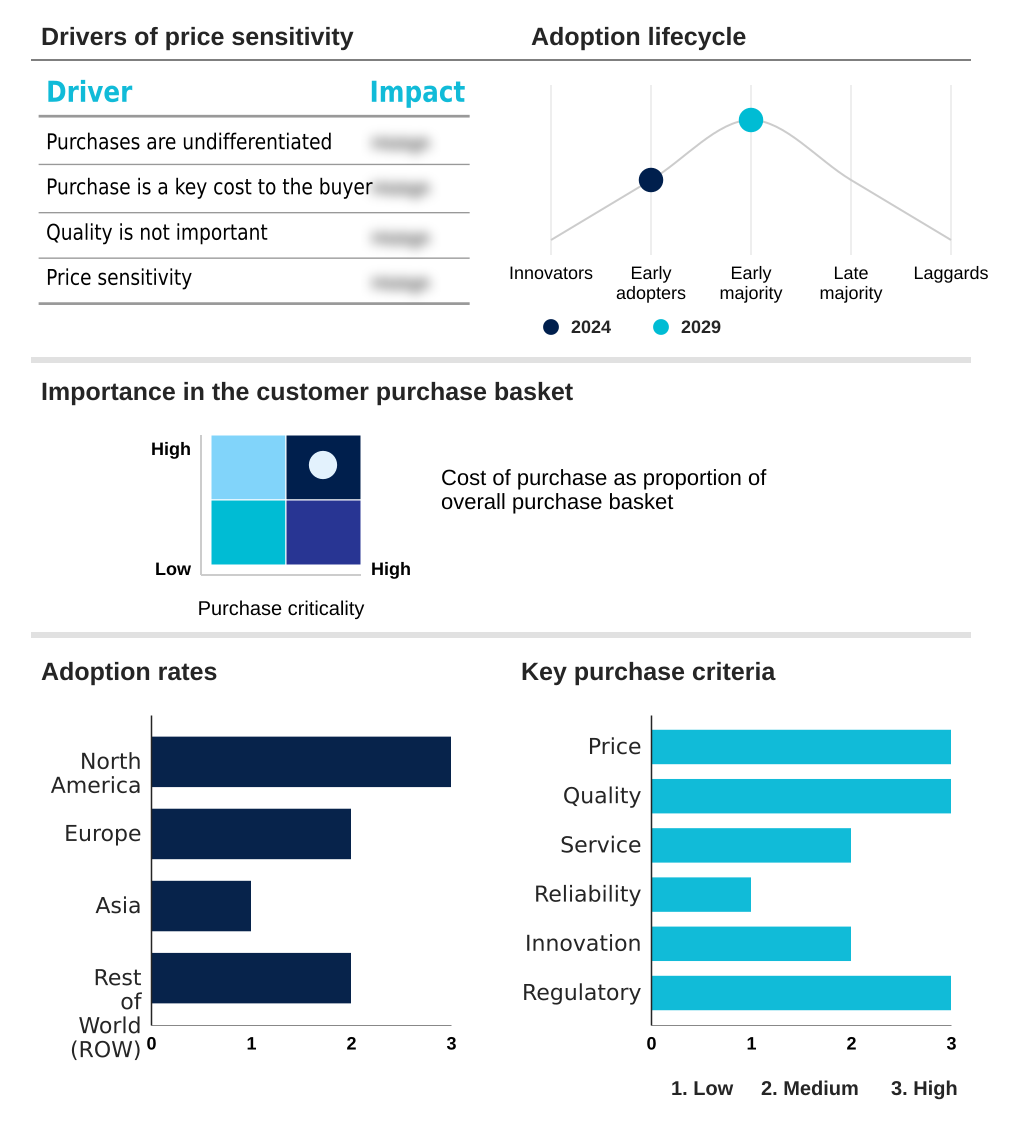
Europe follows, contributing nearly 25% of the incremental growth. However, the fastest-growing region is Asia, with a projected CAGR of 7.0%, fueled by increasing investments in life sciences infrastructure in countries like China and India.
The adoption of technologies like positive displacement pipetting and automated nucleic acid purification is accelerating in these emerging markets. Systems that support unattended operation capability and customizable automation platforms are in high demand globally.
This regional dynamic highlights a mature market in the West focused on advanced applications like automated hit picking, while Asia represents a high-growth frontier focused on building foundational high-throughput liquid handling capacity.
Market Dynamics
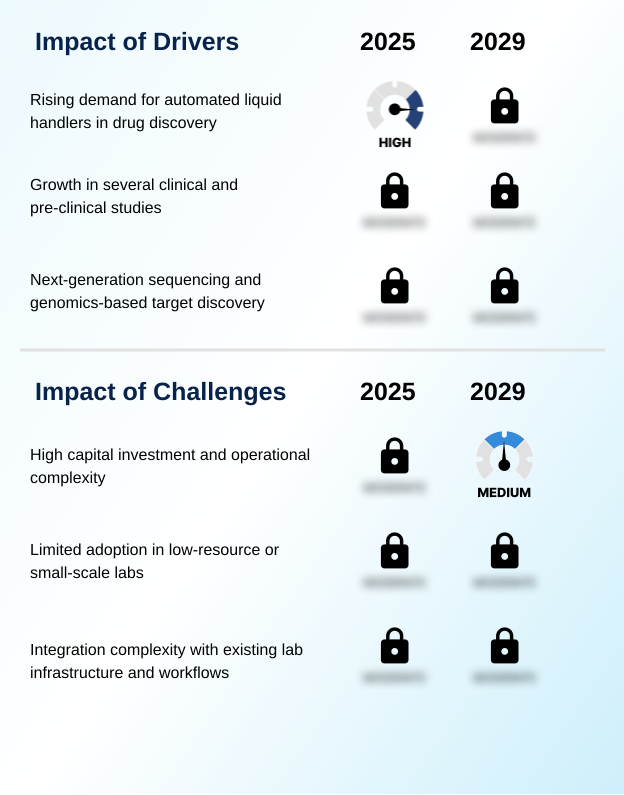
Our researchers analyzed the data with 2024 as the base year, along with the key drivers, trends, and challenges. A holistic analysis of drivers will help companies refine their marketing strategies to gain a competitive advantage.
- Strategic decision-making in the global automated liquid handlers market 2025-2029 now extends beyond basic throughput to nuanced, application-specific capabilities. Laboratories are increasingly focused on automating elisa assays for diagnostics and optimizing pcr and qpcr setup automation to ensure consistency in molecular testing.
- In genomics, the emphasis is on establishing a robust ngs library prep automation workflow and utilizing automated nucleic acid extraction systems to minimize variability. For cell-based research, the focus is on automating cell-based assays workflow and deploying cell line development automation systems that maintain viability and reproducibility.
- The growing complexity of drug discovery automation solutions necessitates low-volume dispensing for drug discovery and advanced acoustic dispensing for assay miniaturization. Integrating liquid handlers with lims is no longer optional but a core requirement for data integrity. A key operational consideration is reducing cross-contamination in automated pipetting, where advanced systems demonstrate contamination rates five times lower than semi-automated methods.
- As facilities scale, robotic systems for biobanking applications and walkaway automation for proteomic workflows become critical infrastructure, alongside the challenge of handling viscous liquids in automated systems without compromising accuracy.
What are the key market drivers leading to the rise in the adoption of Automated Liquid Handlers Industry?
- The rising demand for automated liquid handlers in drug discovery, driven by the need to increase throughput and consistency in screening processes, is a key driver for market growth.
- The rising demand in drug discovery and genomics research is a primary driver for the market. The need for enhanced throughput and consistency in clinical diagnostics and next-generation sequencing fuels the adoption of automated systems.
- Innovations in liquid handlers, enabling assay downsizing and faster chemical probe interrogation, are crucial. For example, implementing automated sample aliquotting can increase laboratory throughput by over 50% compared to manual methods.
- The use of sterile liquid handling techniques in these systems minimizes contamination, a critical factor in both pharmaceutical research and molecular diagnostics. Moreover, the ability to perform precise small volume pipetting allows for significant cost savings on expensive reagents.
- This demand for efficiency, reliability, and precision underpins the market's sustained expansion, making automated solutions indispensable for modern life science research and development.
What are the market trends shaping the Automated Liquid Handlers Industry?
- The most significant market trend is the convergence of artificial intelligence with workflow automation software. This integration is creating intelligent, self-optimizing laboratory environments that enhance reproducibility and accelerate protocol development.
- The market is witnessing a profound shift toward intelligent automation, where the convergence of AI and advanced software is paramount. This evolution moves beyond simple robotic pipetting systems to create self-optimizing environments capable of automated method development and remote system monitoring.
- The trend is characterized by systems offering advanced liquid level detection and automated reagent addition, which together have been shown to reduce manual errors by over 40%. A key development is the focus on integrated laboratory automation and multi-instrument integration, allowing for seamless end-to-end workflows. This integration enhances experimental reproducibility and accelerates processes like automated screening workflows.
- The value proposition is now centered on the software that enables predictive modeling and autonomous decision-making, elevating instruments from tools to active participants in scientific discovery.
What challenges does the Automated Liquid Handlers Industry face during its growth?
- The high capital investment required for acquisition and the operational complexity of implementation and maintenance remain key challenges affecting broader market adoption.
- A paramount challenge is the high capital investment and operational complexity associated with advanced automated systems. The initial outlay for a high-throughput workstation, coupled with costs for proprietary reagents and integrated modules, can be prohibitive for smaller labs. Implementation requires extensive integration with existing LIMS and data analysis software, a process that can increase project timelines by up to 30%.
- Furthermore, the operational burden includes ongoing maintenance, regular calibration to ensure accuracy in tasks like viscous liquid handling, and continuous staff training. Mastering automated cell culture system protocols and troubleshooting software glitches demands specialized expertise.
- This reliance on highly skilled technicians and the time needed to reconfigure systems for diverse assays can sometimes offset the efficiency gains, limiting broader market adoption despite the clear advantages of automation.
Exclusive Technavio Analysis on Customer Landscape
The automated liquid handlers market forecasting report includes the adoption lifecycle of the market, covering from the innovator’s stage to the laggard’s stage. It focuses on adoption rates in different regions based on penetration. Furthermore, the automated liquid handlers market report also includes key purchase criteria and drivers of price sensitivity to help companies evaluate and develop their market growth analysis strategies.
Customer Landscape of Automated Liquid Handlers Industry
Competitive Landscape
Companies are implementing various strategies, such as strategic alliances, automated liquid handlers market forecast, partnerships, mergers and acquisitions, geographical expansion, and product/service launches, to enhance their presence in the industry.
Agilent Technologies Inc. - Key offerings include advanced automated systems for high-throughput screening, sample preparation, and integrated lab automation, supporting workflows across genomics, diagnostics, and bioprocessing.
The industry research and growth report includes detailed analyses of the competitive landscape of the market and information about key companies, including:
- Agilent Technologies Inc.
- Aurora Biomed Inc.
- Beckman Coulter Inc.
- Becton Dickinson and Co.
- Danaher Corp.
- Eppendorf SE
- FORMULATRIX Inc.
- Gilson Inc.
- Haier Biomedical
- Hamilton Co.
- Hudson Lab Automation
- Lasec SA Pty Ltd.
- Lonza Group Ltd.
- PerkinElmer US LLC
- QIAGEN N.V.
- Raykol Group Corp., Ltd.
- Revvity Inc.
- Synchron Lab Automation
- Tecan Trading AG
- Thermo Fisher Scientific Inc.
Qualitative and quantitative analysis of companies has been conducted to help clients understand the wider business environment as well as the strengths and weaknesses of key industry players. Data is qualitatively analyzed to categorize companies as pure play, category-focused, industry-focused, and diversified; it is quantitatively analyzed to categorize companies as dominant, leading, strong, tentative, and weak.
Recent Development and News in Automated liquid handlers market
- In August, 2024, Thermo Fisher Scientific Inc. announced the launch of its new AI-powered software suite designed to optimize protocol development and reduce errors for its Multidrop and Versette liquid handling platforms, according to a company press release.
- In November, 2024, Danaher Corp., through its subsidiary Beckman Coulter Inc., completed the acquisition of a European startup specializing in acoustic droplet ejection technology for an undisclosed sum, aiming to enhance its Biomek i-Series workstations with nanoliter dispensing capabilities.
- In February, 2025, Agilent Technologies Inc. and a major pharmaceutical company entered into a strategic partnership to co-develop fully automated next-generation sequencing library preparation workflows, integrating Agilent's Bravo liquid handler with advanced robotic systems.
- In April, 2025, Tecan Trading AG received regulatory clearance in Europe for its new clinical diagnostic module for the Fluent Automation Workstation, enabling fully automated sample-to-result workflows for infectious disease testing, as detailed in a company filing.
Dive into Technavio’s robust research methodology, blending expert interviews, extensive data synthesis, and validated models for unparalleled Automated Liquid Handlers Market insights. See full methodology.
| Market Scope | |
|---|---|
| Page number | 292 |
| Base year | 2024 |
| Historic period | 2019-2023 |
| Forecast period | 2025-2029 |
| Growth momentum & CAGR | Accelerate at a CAGR of 5.8% |
| Market growth 2025-2029 | USD 249.3 million |
| Market structure | Fragmented |
| YoY growth 2024-2025(%) | 5.4% |
| Key countries | US, Canada, Mexico, Germany, UK, France, Italy, Spain, The Netherlands, China, India, Japan, South Korea, Thailand, Indonesia, Brazil, Saudi Arabia, UAE, Turkey, Argentina, Colombia, South Africa and Israel |
| Competitive landscape | Leading Companies, Market Positioning of Companies, Competitive Strategies, and Industry Risks |
Research Analyst Overview
- The automated liquid handlers market is evolving from a focus on hardware to integrated, software-driven ecosystems. Core technologies like air displacement pipetting and magnetic bead-based separation are now standard, with differentiation shifting to the intelligence layer. The adoption of modular platform integration allows for flexible cell-based assay automation and complex proteomic research automation.
- In boardroom discussions, the decision to invest in these systems is increasingly tied to long-term operational strategy, particularly regarding LIMS integration and ELN connectivity to ensure data traceability. Advanced protocol optimization software has become a key selling point, as it directly impacts lab efficiency; facilities deploying such software report up to a 25% reduction in method development time.
- The market's trajectory is toward walkaway automation, where robotic plate handling and sophisticated error handling mechanisms enable continuous, unattended operation for applications ranging from NGS library preparation to high-throughput screening. This shift underscores a move toward smarter, more autonomous laboratory environments.
What are the Key Data Covered in this Automated Liquid Handlers Market Research and Growth Report?
-
What is the expected growth of the Automated Liquid Handlers Market between 2025 and 2029?
-
USD 249.3 million, at a CAGR of 5.8%
-
-
What segmentation does the market report cover?
-
The report is segmented by Application (Drug discovery, Genomic and proteomic research, and Clinical diagnostics), Product Type (Robotic liquid-handling workstations, Reagents and consumables, and Accessories and peripherals), End-user (Pharmaceutical and biotechnology industry, Clinical and reference laboratories, and Others) and Geography (North America, Europe, Asia, Rest of World (ROW))
-
-
Which regions are analyzed in the report?
-
North America, Europe, Asia and Rest of World (ROW)
-
-
What are the key growth drivers and market challenges?
-
Rising demand for automated liquid handlers in drug discovery, High capital investment and operational complexity
-
-
Who are the major players in the Automated Liquid Handlers Market?
-
Agilent Technologies Inc., Aurora Biomed Inc., Beckman Coulter Inc., Becton Dickinson and Co., Danaher Corp., Eppendorf SE, FORMULATRIX Inc., Gilson Inc., Haier Biomedical, Hamilton Co., Hudson Lab Automation, Lasec SA Pty Ltd., Lonza Group Ltd., PerkinElmer US LLC, QIAGEN N.V., Raykol Group Corp., Ltd., Revvity Inc., Synchron Lab Automation, Tecan Trading AG and Thermo Fisher Scientific Inc.
-
Market Research Insights
- The market is characterized by a strategic shift toward intelligent and integrated systems, where performance is measured by tangible business outcomes. For instance, adoption of automated assay development platforms has been shown to reduce protocol validation times by up to 30%, directly impacting research and development timelines.
- The integration of lab workflow scheduling tools with robotic pipetting systems enhances operational efficiency, with some facilities reporting a 20% increase in unattended operation capability. Furthermore, the use of automated diagnostics sample prep technology improves data integrity, aligning with stringent regulatory requirements. Systems featuring dynamic liquid classification can reduce reagent waste by 15%, lowering operational costs.
- This focus on optimizing lab automation software and ensuring robust consumable tracking is creating a more connected and data-driven laboratory environment, where precision liquid handling is a core component of scalable scientific discovery.
We can help! Our analysts can customize this automated liquid handlers market research report to meet your requirements.
 RIA -
RIA - 
