Automated Teller Machine (ATM) Market Analysis, Size, and Forecast 2026-2030: APAC (India, China, and Japan), North America (US, Canada, and Mexico), Europe (Germany, UK, and France), South America (Brazil and Argentina), Middle East and Africa (Saudi Arabia, UAE, and South Africa), and Rest of World (ROW)

Automated Teller Machine (ATM) Market Analysis, Size, and Forecast 2026-2030:
APAC (India, China, and Japan), North America (US, Canada, and Mexico), Europe (Germany, UK, and France), South America (Brazil and Argentina), Middle East and Africa (Saudi Arabia, UAE, and South Africa), and Rest of World (ROW)

Published: May 2026 294 Pages SKU: IRTNTR44212

Market Overview at a Glance

$6.70 B
Market Opportunity
4.8%
CAGR 2025 - 2030
43.6%
APAC Growth
$16.37 B
Brown label segment 2024

Automated Teller Machine (ATM) Market Size 2026-2030

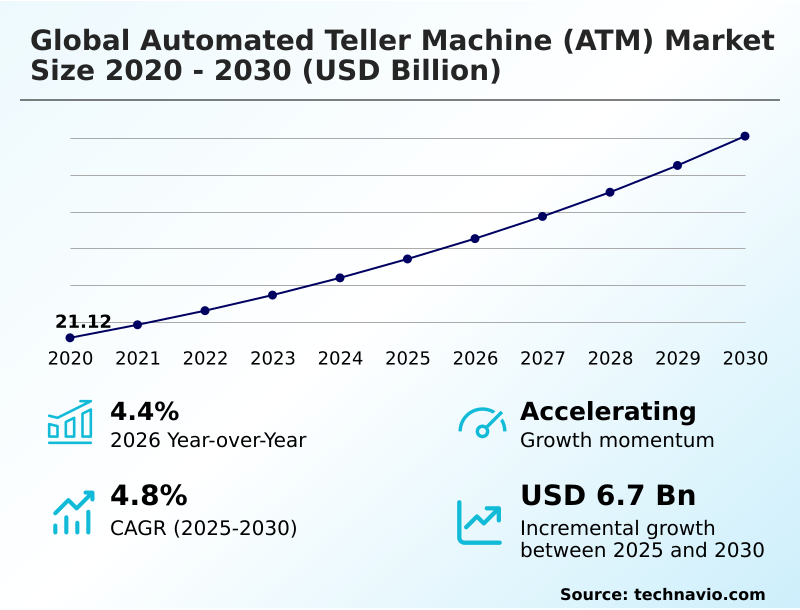
The automated teller machine (atm) market size is valued to increase by USD 6.70 billion, at a CAGR of 4.8% from 2025 to 2030. Proliferation of self-service banking and operational efficiency will drive the automated teller machine (atm) market.

Major Market Trends & Insights

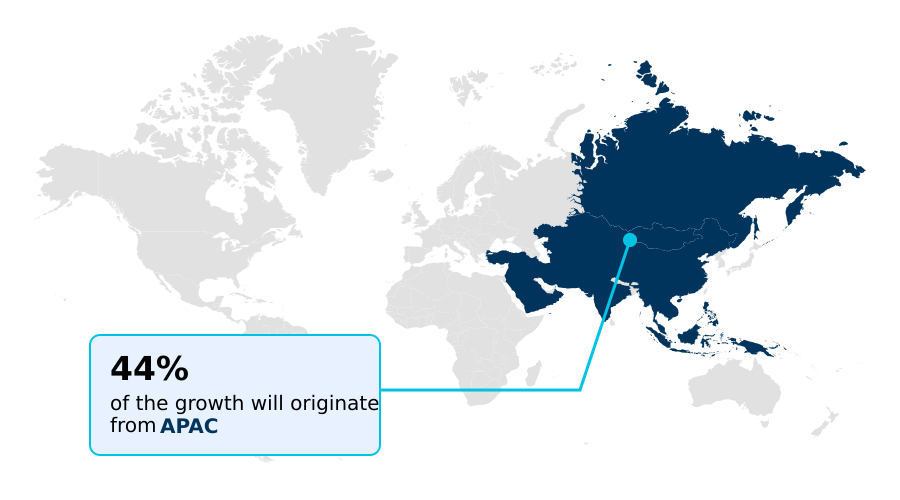
  • APAC dominated the market and accounted for a 43.6% growth during the forecast period.
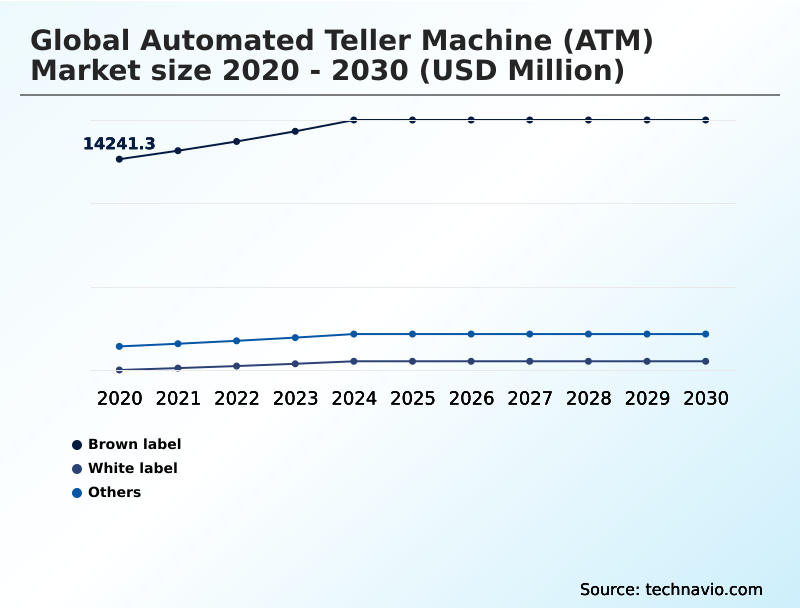
  • By Type - Brown label segment was valued at USD 16.37 billion in 2024
  • By Deployment - Offsite ATM segment accounted for the largest market revenue share in 2024

Market Size & Forecast

  • Market Opportunities: USD 11.00 billion
  • Market Future Opportunities: USD 6.70 billion
  • CAGR from 2025 to 2030 : 4.8%

Market Summary

  • The automated teller machine (atm) market is defined by a strategic transition toward advanced self-service banking solutions and integrated service models. While digital payments expand, the need for physical cash access remains a cornerstone of the financial infrastructure, particularly for promoting financial inclusion in developing economies.
  • Growth is fueled by the replacement of legacy hardware with multi-function ATMs featuring innovations like cash recycling technology and biometric authentication. This evolution helps financial institutions improve operational efficiency and reduce costs associated with cash-in-transit. For instance, a typical branch transformation strategy involves deploying smart ATMs to handle complex tasks, allowing staff to focus on high-value advisory services.
  • Concurrently, the ATM-as-a-service model is gaining traction, enabling banks to outsource ATM fleet management to specialized providers. This approach mitigates risks related to hardware obsolescence and cybersecurity while ensuring the physical touchpoint aligns with modern omnichannel banking experiences.
  • The integration of ATM software with digital banking solutions is crucial for delivering a seamless customer journey, reinforcing the ATM's role as a vital bridge between physical and digital finance.

What will be the Size of the Automated Teller Machine (ATM) Market during the forecast period?

Get Key Insights on Market Forecast (PDF) Get Free Sample

How is the Automated Teller Machine (ATM) Market Segmented?

The automated teller machine (atm) industry research report provides comprehensive data (region-wise segment analysis), with forecasts and estimates in "USD million" for the period 2026-2030, as well as historical data from 2020-2024 for the following segments.

  • Type
    • Brown label
    • White label
    • Others
  • Deployment
    • Offsite ATM
    • Onsite ATM
    • Others
  • Solution
    • Deployment solutions
    • Managed services
  • Geography
    • APAC
      • India
      • China
      • Japan
    • North America
      • US
      • Canada
      • Mexico
    • Europe
      • Germany
      • UK
      • France
    • South America
      • Brazil
      • Argentina
    • Middle East and Africa
      • Saudi Arabia
      • UAE
      • South Africa
    • Rest of World (ROW)

By Type Insights

The brown label segment is estimated to witness significant growth during the forecast period.

The global automated teller machine (atm) market is segmented by type, deployment, and geography.

The brown-label ATM model allows a financial institution to expand its physical footprint using hardware owned by a service provider, with branding maintained by the sponsor bank.

This approach is critical for balancing service accessibility with fiscal constraints, driving operational efficiency. It enables network expansion into new areas without the high capital expenditure of full hardware ownership, optimizing cash management.

This segment leverages remote ATM monitoring and predictive maintenance to ensure high uptime.

As part of a broader branch transformation, this strategy reduces the total cost of ATM ownership, with some operators reporting a 15% reduction in annual maintenance-related expenses by outsourcing through these agreements, enhancing self-service banking capabilities.

The use of advanced ATM software is crucial for managing these distributed networks and ensuring secure transaction processing.

Get Free Sample

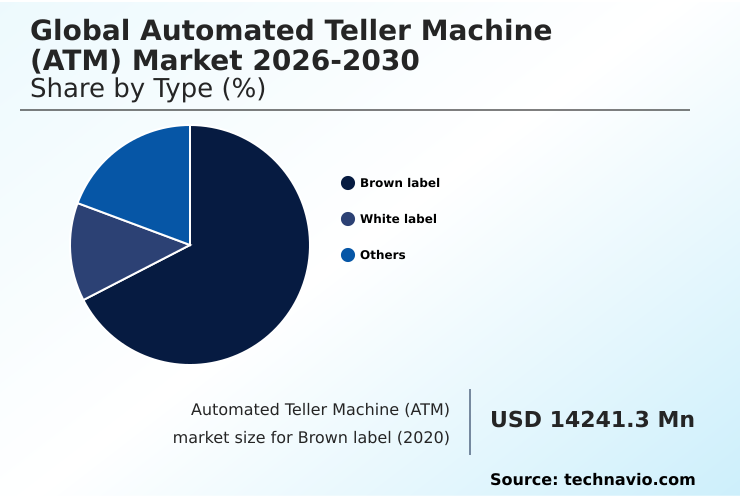
The Brown label segment was valued at USD 16.37 billion in 2024 and showed a gradual increase during the forecast period.

Get Free Sample

Regional Analysis

APAC is estimated to contribute 43.6% to the growth of the global market during the forecast period.Technavio’s analysts have elaborately explained the regional trends and drivers that shape the market during the forecast period.

See How Automated Teller Machine (ATM) Market Demand is Rising in APAC Get Free Sample

The geographic landscape of the global automated teller machine (atm) market is characterized by divergent growth patterns.

APAC is set to contribute over 43% of the market's incremental growth, driven by aggressive financial inclusion initiatives and the need for banking automation in rural areas.

This contrasts with mature regions like North America and Europe, where the focus is on ATM fleet modernization and implementing a cohesive branch transformation strategy.

In these markets, there is less emphasis on new unit deployment and more on upgrading to multi-function ATMs that support an omnichannel banking experience.

South America continues to prioritize ATM security and the deployment of offsite ATMs to serve its large unbanked population.

The Middle East and Africa present a dual market, with high-tech smart ATM deployments in affluent nations and a focus on basic, durable machines for financial inclusion elsewhere. This regional diversity requires adaptable ATM deployment solutions.

Market Dynamics

Our researchers analyzed the data with 2025 as the base year, along with the key drivers, trends, and challenges. A holistic analysis of drivers will help companies refine their marketing strategies to gain a competitive advantage.

  • Strategic decisions in the global automated teller machine (atm) market increasingly revolve around complex trade-offs. A cost-benefit analysis of ATM outsourcing often reveals that the ATM-as-a-service vs in-house management debate is central to modern operational planning. While outsourcing can lower upfront capital expenditure, it requires careful vendor selection to maintain service quality and security.
  • The future of self-service banking channels depends on integrating ATMs with mobile banking applications, a trend that enhances user convenience but also expands the threat landscape. Accordingly, a deep understanding of security features in modern ATM models is non-negotiable for risk mitigation. Preventing jackpotting and black box attacks requires robust ATM software and hardware-level protections.
  • In parallel, the benefits of cash recycling technology in banking are clear, with some institutions reporting cash handling cost reductions of over 25% compared to traditional models. The role of ATMs in emerging market financial inclusion remains pivotal, where a comparison of white-label vs brown-label ATMs shows different approaches to expanding access.
  • Trends in ATM software development focus on open APIs and platform-based architectures to support these evolving demands. Ultimately, strategies for reducing ATM operational costs while meeting compliance requirements for ATM deployment define competitive positioning.

What are the key market drivers leading to the rise in the adoption of Automated Teller Machine (ATM) Industry?

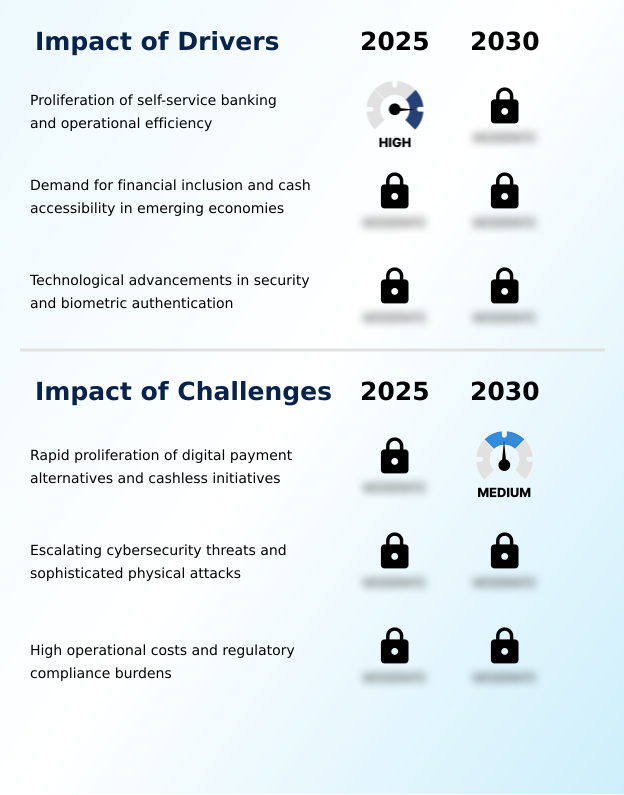
  • The proliferation of self-service banking models, driven by the strategic imperative for greater operational efficiency, serves as a key driver for the market.

  • Market growth is primarily driven by the strategic imperative for financial institutions to enhance operational efficiency and expand financial inclusion.
  • The proliferation of self-service banking, supported by advanced payment processing software and fraud management solutions, allows banks to reduce reliance on costly physical branches. Cash recycling technology is a major catalyst, enabling a more efficient cash cycle.
  • In emerging economies, the deployment of white-label ATMs and brown-label ATMs is critical for providing access to cash management services for unbanked populations.
  • Furthermore, continuous advancements in ATM security, such as sophisticated anti-skimming technology and encrypted communication protocols, build consumer trust and are essential for regulatory compliance for ATMs, including adherence to payment card industry (pci) compliance standards.

What are the market trends shaping the Automated Teller Machine (ATM) Industry?

  • The integration of artificial intelligence and predictive maintenance frameworks is an important emerging trend. This development is fundamentally reshaping operational strategies and service delivery models within the industry.

  • Key trends are reshaping the market, with a strong emphasis on integrating artificial intelligence into ATM network management. The use of predictive analytics for cash demand is becoming standard, enabling operators to optimize cash levels and reduce the frequency of cash-in-transit, lowering operational costs by up to 15%. This data-driven approach enhances ATM uptime and availability.
  • Another significant trend is the rise of the ATM-as-a-service outsourcing model, allowing financial institutions to leverage the expertise of a managed services provider (msp) for ATMs. This shift supports ATM fleet modernization without significant capital outlay.
  • The focus on customer experience at the ATM is driving innovation in user interface (ui) for ATMs and the adoption of NFC technology for frictionless, cardless transactions, which improves transaction speeds by over 30%.

What challenges does the Automated Teller Machine (ATM) Industry face during its growth?

  • The rapid and widespread proliferation of digital payment alternatives and cashless initiatives presents a significant challenge to the market's traditional growth trajectory.

  • The primary challenge facing the industry is the increasing competition from digital-first payment systems, which impacts ATM transaction volume analysis. This necessitates a re-evaluation of the cost of ATM ownership and business models for the independent ATM deployer (iad).
  • Additionally, the escalating sophistication of both logical and physical threats requires constant investment in cybersecurity for financial terminals and physical ATM security measures. These include defenses against jackpotting and black box attacks, which can lead to significant financial losses.
  • Managing the complexities of ATM hardware procurement and the logistics of a global supply chain while adhering to evolving regulations presents another significant hurdle. The need for continuous software updates and patches to maintain a secure transaction processing environment adds to the operational burden for ATM operators.

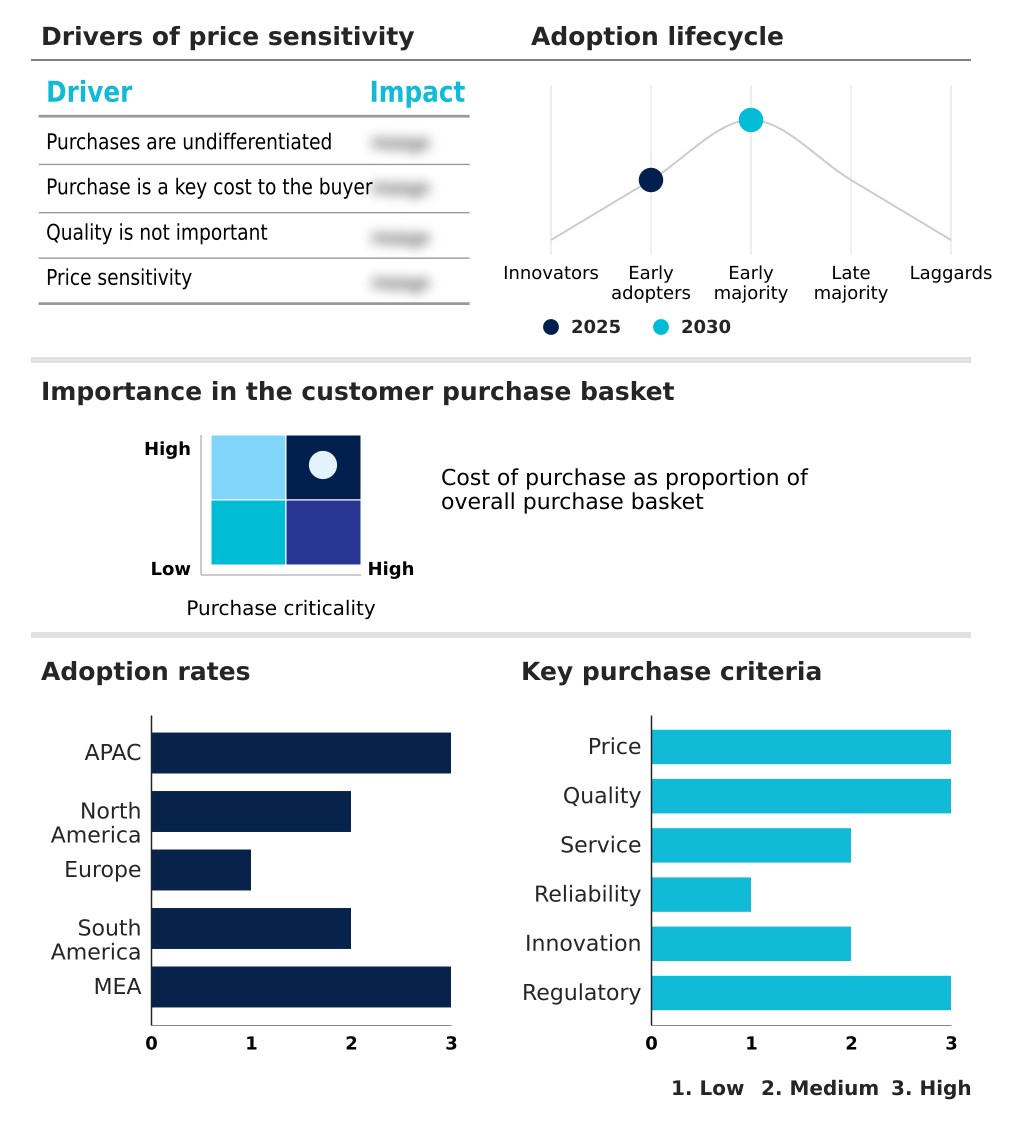
Exclusive Technavio Analysis on Customer Landscape

The automated teller machine (atm) market forecasting report includes the adoption lifecycle of the market, covering from the innovator’s stage to the laggard’s stage. It focuses on adoption rates in different regions based on penetration. Furthermore, the automated teller machine (atm) market report also includes key purchase criteria and drivers of price sensitivity to help companies evaluate and develop their market growth analysis strategies.

Customer Landscape of Automated Teller Machine (ATM) Industry

Competitive Landscape

Companies are implementing various strategies, such as strategic alliances, automated teller machine (atm) market forecast, partnerships, mergers and acquisitions, geographical expansion, and product/service launches, to enhance their presence in the industry.

ACI Worldwide Inc. - Key offerings center on ATM transaction processing, integrated payment software, and fraud management solutions designed for modern financial ecosystems.

The industry research and growth report includes detailed analyses of the competitive landscape of the market and information about key companies, including:

  • ACI Worldwide Inc.
  • Cennox Inc.
  • CSG Systems International Inc.
  • Euronet Worldwide Inc.
  • Fidelity National Information
  • Financial software and systems
  • Hyosung TNS Inc.
  • KAL ATM Software GmbH
  • KEBA Group AG
  • Loomis AB
  • NCR Payment Solutions LLC
  • Optima Systems Ltd.
  • Parabit Systems Inc.
  • Phoenix Interactive Design Inc.
  • Sesami Inc.
  • Sigma Spa
  • STEMMER IMAGING AG
  • Triton Systems
  • Vortex Engineering Pvt. Ltd.

Qualitative and quantitative analysis of companies has been conducted to help clients understand the wider business environment as well as the strengths and weaknesses of key industry players. Data is qualitatively analyzed to categorize companies as pure play, category-focused, industry-focused, and diversified; it is quantitatively analyzed to categorize companies as dominant, leading, strong, tentative, and weak.

Recent Development and News in Automated teller machine (atm) market

  • In August 2025, Die Nixdorf Inc. launched its new Branch Automation Solutions portfolio, offering pre-packaged managed services on a cloud-native platform to help financial institutions optimize operations and deliver seamless omnichannel experiences.
  • In October 2025, Die Nixdorf Inc. announced that Bank AlJazira in Saudi Arabia became the first Middle Eastern bank to implement its VCP-Lite 7 self-service software on over 400 DN Series ATMs running Microsoft Windows 11.
  • In February 2025, GRG Banking Equipment Co. Ltd. expanded its strategic initiatives in Africa with high-level visits to Egypt and Morocco to promote its intelligent banking equipment and explore opportunities for ATM and cash management solutions.
  • In May 2025, Die Nixdorf Inc. announced that QNB is the first bank in the Middle East to deploy ATMs with bulk cash deposit capabilities using its technology, enhancing customer convenience as part of QNB's digital transformation strategy.

Dive into Technavio’s robust research methodology, blending expert interviews, extensive data synthesis, and validated models for unparalleled Automated Teller Machine (ATM) Market insights. See full methodology.

Market Scope
Page number 294
Base year 2025
Historic period 2020-2024
Forecast period 2026-2030
Growth momentum & CAGR Accelerate at a CAGR of 4.8%
Market growth 2026-2030 USD 6703.0 million
Market structure Fragmented
YoY growth 2025-2026(%) 4.4%
Key countries India, China, Japan, South Korea, Indonesia, Australia, US, Canada, Mexico, Germany, UK, France, Italy, Spain, The Netherlands, Brazil, Argentina, Chile, Saudi Arabia, UAE, South Africa, Turkey and Israel
Competitive landscape Leading Companies, Market Positioning of Companies, Competitive Strategies, and Industry Risks

Request Free Sample

Research Analyst Overview

  • The global automated teller machine (atm) market is undergoing a significant evolution, moving beyond simple cash dispensation to become a cornerstone of modern self-service banking. The industry is characterized by the widespread adoption of cash recycling technology and advanced ATM software to improve operational efficiency.
  • Key developments include the integration of biometric authentication and cardless transactions, which enhance ATM security while aligning with consumer expectations for seamless digital banking solutions. A critical focus is on branch transformation, where multi-function ATMs and self-service kiosks are deployed to handle routine transactions, allowing financial institutions to optimize staffing.
  • For instance, the use of predictive maintenance algorithms has been shown to increase ATM fleet uptime by over 15%. This shift toward ATM-as-a-service and managed services allows banks to focus on core activities.
  • The deployment of both onsite ATMs and offsite ATMs, including mobile and smart ATM variants, is tailored to meet diverse market needs, from urban convenience to rural financial inclusion. This requires sophisticated cash management and real-time monitoring.

What are the Key Data Covered in this Automated Teller Machine (ATM) Market Research and Growth Report?

  • What is the expected growth of the Automated Teller Machine (ATM) Market between 2026 and 2030?

    • USD 6.70 billion, at a CAGR of 4.8%

  • What segmentation does the market report cover?

    • The report is segmented by Type (Brown label, White label, and Others), Deployment (Offsite ATM, Onsite ATM, and Others), Solution (Deployment solutions, and Managed services) and Geography (APAC, North America, Europe, South America, Middle East and Africa)

  • Which regions are analyzed in the report?

    • APAC, North America, Europe, South America and Middle East and Africa

  • What are the key growth drivers and market challenges?

    • Proliferation of self-service banking and operational efficiency, Rapid proliferation of digital payment alternatives and cashless initiatives

  • Who are the major players in the Automated Teller Machine (ATM) Market?

    • ACI Worldwide Inc., Cennox Inc., CSG Systems International Inc., Euronet Worldwide Inc., Fidelity National Information, Financial software and systems, Hyosung TNS Inc., KAL ATM Software GmbH, KEBA Group AG, Loomis AB, NCR Payment Solutions LLC, Optima Systems Ltd., Parabit Systems Inc., Phoenix Interactive Design Inc., Sesami Inc., Sigma Spa, STEMMER IMAGING AG, Triton Systems and Vortex Engineering Pvt. Ltd.

Market Research Insights

  • Market dynamics are shaped by a strategic push toward ATM fleet modernization and a comprehensive branch transformation strategy. Financial institutions are adopting ATM-as-a-service models, which can reduce the total cost of ATM ownership by up to 20% compared to traditional in-house management.
  • This shift is coupled with a focus on enhancing the omnichannel banking experience through self-service banking solutions that offer more than just cash withdrawals. The adoption of advanced ATM security features, including end-to-end encryption for ATMs and physical ATM security measures, is critical.
  • The efficiency of cash-in-transit optimization improves significantly with cash recycling technology, with some networks reporting a 30% decrease in replenishment frequency. These trends underscore the industry's move toward highly efficient, secure, and integrated self-service channels.

We can help! Our analysts can customize this automated teller machine (atm) market research report to meet your requirements.

Get in touch

1. Executive Summary

1.1 Market overview

Executive Summary - Chart on Market Overview
Executive Summary - Data Table on Market Overview
Executive Summary - Chart on Global Market Characteristics
Executive Summary - Chart on Market by Geography
Executive Summary - Chart on Market Segmentation by Type
Executive Summary - Chart on Market Segmentation by Deployment
Executive Summary - Chart on Market Segmentation by Solution
Executive Summary - Chart on Incremental Growth
Executive Summary - Data Table on Incremental Growth
Executive Summary - Chart on Company Market Positioning

2. Technavio Analysis

2.1 Analysis of price sensitivity, lifecycle, customer purchase basket, adoption rates, and purchase criteria

2.2 Criticality of inputs and Factors of differentiation

Chart on Overview on criticality of inputs and factors of differentiation

2.3 Factors of disruption

Chart on Overview on factors of disruption

2.4 Impact of drivers and challenges

Chart on Impact of drivers and challenges in 2025 and 2030

3. Market Landscape

3.1 Market ecosystem

Chart on Parent Market
Data Table on - Parent Market

3.2 Market characteristics

Chart on Market characteristics analysis

3.3 Value chain analysis

Chart on Value chain analysis

4. Market Sizing

4.1 Market definition

Data Table on Offerings of companies included in the market definition

4.2 Market segment analysis

Market segments

4.3 Market size 2025

4.4 Market outlook: Forecast for 2025-2030

Chart on Global - Market size and forecast 2025-2030 ($ million)
Data Table on Global - Market size and forecast 2025-2030 ($ million)
Chart on Global Market: Year-over-year growth 2025-2030 (%)
Data Table on Global Market: Year-over-year growth 2025-2030 (%)

5. Historic Market Size

5.1 Global Automated Teller Machine (ATM) Market 2020 - 2024

Historic Market Size - Data Table on Global Automated Teller Machine (ATM) Market 2020 - 2024 ($ million)

5.2 Type segment analysis 2020 - 2024

Historic Market Size - Type Segment 2020 - 2024 ($ million)

5.3 Deployment segment analysis 2020 - 2024

Historic Market Size - Deployment Segment 2020 - 2024 ($ million)

5.4 Solution segment analysis 2020 - 2024

Historic Market Size - Solution Segment 2020 - 2024 ($ million)

5.5 Geography segment analysis 2020 - 2024

Historic Market Size - Geography Segment 2020 - 2024 ($ million)

5.6 Country segment analysis 2020 - 2024

Historic Market Size - Country Segment 2020 - 2024 ($ million)

6. Qualitative Analysis

6.1 Impact of AI on global automated teller machine (ATM) market

6.2 Impact of geopolitical conflicts on global automated teller machine (ATM) market

7. Five Forces Analysis

7.1 Five forces summary

Five forces analysis - Comparison between 2025 and 2030

7.2 Bargaining power of buyers

Bargaining power of buyers - Impact of key factors 2025 and 2030

7.3 Bargaining power of suppliers

Bargaining power of suppliers - Impact of key factors in 2025 and 2030

7.4 Threat of new entrants

Threat of new entrants - Impact of key factors in 2025 and 2030

7.5 Threat of substitutes

Threat of substitutes - Impact of key factors in 2025 and 2030

7.6 Threat of rivalry

Threat of rivalry - Impact of key factors in 2025 and 2030

7.7 Market condition

Chart on Market condition - Five forces 2025 and 2030

8. Market Segmentation by Type

8.1 Market segments

Chart on Type - Market share 2025-2030 (%)
Data Table on Type - Market share 2025-2030 (%)

8.2 Comparison by Type

Chart on Comparison by Type
Data Table on Comparison by Type

8.3 Brown label - Market size and forecast 2025-2030

Chart on Brown label - Market size and forecast 2025-2030 ($ million)
Data Table on Brown label - Market size and forecast 2025-2030 ($ million)
Chart on Brown label - Year-over-year growth 2025-2030 (%)
Data Table on Brown label - Year-over-year growth 2025-2030 (%)

8.4 White label - Market size and forecast 2025-2030

Chart on White label - Market size and forecast 2025-2030 ($ million)
Data Table on White label - Market size and forecast 2025-2030 ($ million)
Chart on White label - Year-over-year growth 2025-2030 (%)
Data Table on White label - Year-over-year growth 2025-2030 (%)

8.5 Others - Market size and forecast 2025-2030

Chart on Others - Market size and forecast 2025-2030 ($ million)
Data Table on Others - Market size and forecast 2025-2030 ($ million)
Chart on Others - Year-over-year growth 2025-2030 (%)
Data Table on Others - Year-over-year growth 2025-2030 (%)

8.6 Market opportunity by Type

Market opportunity by Type ($ million)
Data Table on Market opportunity by Type ($ million)

9. Market Segmentation by Deployment

9.1 Market segments

Chart on Deployment - Market share 2025-2030 (%)
Data Table on Deployment - Market share 2025-2030 (%)

9.2 Comparison by Deployment

Chart on Comparison by Deployment
Data Table on Comparison by Deployment

9.3 Offsite ATM - Market size and forecast 2025-2030

Chart on Offsite ATM - Market size and forecast 2025-2030 ($ million)
Data Table on Offsite ATM - Market size and forecast 2025-2030 ($ million)
Chart on Offsite ATM - Year-over-year growth 2025-2030 (%)
Data Table on Offsite ATM - Year-over-year growth 2025-2030 (%)

9.4 Onsite ATM - Market size and forecast 2025-2030

Chart on Onsite ATM - Market size and forecast 2025-2030 ($ million)
Data Table on Onsite ATM - Market size and forecast 2025-2030 ($ million)
Chart on Onsite ATM - Year-over-year growth 2025-2030 (%)
Data Table on Onsite ATM - Year-over-year growth 2025-2030 (%)

9.5 Others - Market size and forecast 2025-2030

Chart on Others - Market size and forecast 2025-2030 ($ million)
Data Table on Others - Market size and forecast 2025-2030 ($ million)
Chart on Others - Year-over-year growth 2025-2030 (%)
Data Table on Others - Year-over-year growth 2025-2030 (%)

9.6 Market opportunity by Deployment

Market opportunity by Deployment ($ million)
Data Table on Market opportunity by Deployment ($ million)

10. Market Segmentation by Solution

10.1 Market segments

Chart on Solution - Market share 2025-2030 (%)
Data Table on Solution - Market share 2025-2030 (%)

10.2 Comparison by Solution

Chart on Comparison by Solution
Data Table on Comparison by Solution

10.3 Deployment solutions - Market size and forecast 2025-2030

Chart on Deployment solutions - Market size and forecast 2025-2030 ($ million)
Data Table on Deployment solutions - Market size and forecast 2025-2030 ($ million)
Chart on Deployment solutions - Year-over-year growth 2025-2030 (%)
Data Table on Deployment solutions - Year-over-year growth 2025-2030 (%)

10.4 Managed services - Market size and forecast 2025-2030

Chart on Managed services - Market size and forecast 2025-2030 ($ million)
Data Table on Managed services - Market size and forecast 2025-2030 ($ million)
Chart on Managed services - Year-over-year growth 2025-2030 (%)
Data Table on Managed services - Year-over-year growth 2025-2030 (%)

10.5 Market opportunity by Solution

Market opportunity by Solution ($ million)
Data Table on Market opportunity by Solution ($ million)

11. Customer Landscape

11.1 Customer landscape overview

Analysis of price sensitivity, lifecycle, customer purchase basket, adoption rates, and purchase criteria

12. Geographic Landscape

12.1 Geographic segmentation

Chart on Market share by geography 2025-2030 (%)
Data Table on Market share by geography 2025-2030 (%)

12.2 Geographic comparison

Chart on Geographic comparison
Data Table on Geographic comparison

12.3 APAC - Market size and forecast 2025-2030

Chart on APAC - Market size and forecast 2025-2030 ($ million)
Data Table on APAC - Market size and forecast 2025-2030 ($ million)
Chart on APAC - Year-over-year growth 2025-2030 (%)
Data Table on APAC - Year-over-year growth 2025-2030 (%)
Chart on Regional Comparison - APAC
Data Table on Regional Comparison - APAC

12.3.1 India - Market size and forecast 2025-2030

Chart on India - Market size and forecast 2025-2030 ($ million)
Data Table on India - Market size and forecast 2025-2030 ($ million)
Chart on India - Year-over-year growth 2025-2030 (%)
Data Table on India - Year-over-year growth 2025-2030 (%)

12.3.2 China - Market size and forecast 2025-2030

Chart on China - Market size and forecast 2025-2030 ($ million)
Data Table on China - Market size and forecast 2025-2030 ($ million)
Chart on China - Year-over-year growth 2025-2030 (%)
Data Table on China - Year-over-year growth 2025-2030 (%)

12.3.3 Japan - Market size and forecast 2025-2030

Chart on Japan - Market size and forecast 2025-2030 ($ million)
Data Table on Japan - Market size and forecast 2025-2030 ($ million)
Chart on Japan - Year-over-year growth 2025-2030 (%)
Data Table on Japan - Year-over-year growth 2025-2030 (%)

12.3.4 South Korea - Market size and forecast 2025-2030

Chart on South Korea - Market size and forecast 2025-2030 ($ million)
Data Table on South Korea - Market size and forecast 2025-2030 ($ million)
Chart on South Korea - Year-over-year growth 2025-2030 (%)
Data Table on South Korea - Year-over-year growth 2025-2030 (%)

12.3.5 Indonesia - Market size and forecast 2025-2030

Chart on Indonesia - Market size and forecast 2025-2030 ($ million)
Data Table on Indonesia - Market size and forecast 2025-2030 ($ million)
Chart on Indonesia - Year-over-year growth 2025-2030 (%)
Data Table on Indonesia - Year-over-year growth 2025-2030 (%)

12.3.6 Australia - Market size and forecast 2025-2030

Chart on Australia - Market size and forecast 2025-2030 ($ million)
Data Table on Australia - Market size and forecast 2025-2030 ($ million)
Chart on Australia - Year-over-year growth 2025-2030 (%)
Data Table on Australia - Year-over-year growth 2025-2030 (%)

12.4 North America - Market size and forecast 2025-2030

Chart on North America - Market size and forecast 2025-2030 ($ million)
Data Table on North America - Market size and forecast 2025-2030 ($ million)
Chart on North America - Year-over-year growth 2025-2030 (%)
Data Table on North America - Year-over-year growth 2025-2030 (%)
Chart on Regional Comparison - North America
Data Table on Regional Comparison - North America

12.4.1 US - Market size and forecast 2025-2030

Chart on US - Market size and forecast 2025-2030 ($ million)
Data Table on US - Market size and forecast 2025-2030 ($ million)
Chart on US - Year-over-year growth 2025-2030 (%)
Data Table on US - Year-over-year growth 2025-2030 (%)

12.4.2 Canada - Market size and forecast 2025-2030

Chart on Canada - Market size and forecast 2025-2030 ($ million)
Data Table on Canada - Market size and forecast 2025-2030 ($ million)
Chart on Canada - Year-over-year growth 2025-2030 (%)
Data Table on Canada - Year-over-year growth 2025-2030 (%)

12.4.3 Mexico - Market size and forecast 2025-2030

Chart on Mexico - Market size and forecast 2025-2030 ($ million)
Data Table on Mexico - Market size and forecast 2025-2030 ($ million)
Chart on Mexico - Year-over-year growth 2025-2030 (%)
Data Table on Mexico - Year-over-year growth 2025-2030 (%)

12.5 Europe - Market size and forecast 2025-2030

Chart on Europe - Market size and forecast 2025-2030 ($ million)
Data Table on Europe - Market size and forecast 2025-2030 ($ million)
Chart on Europe - Year-over-year growth 2025-2030 (%)
Data Table on Europe - Year-over-year growth 2025-2030 (%)
Chart on Regional Comparison - Europe
Data Table on Regional Comparison - Europe

12.5.1 Germany - Market size and forecast 2025-2030

Chart on Germany - Market size and forecast 2025-2030 ($ million)
Data Table on Germany - Market size and forecast 2025-2030 ($ million)
Chart on Germany - Year-over-year growth 2025-2030 (%)
Data Table on Germany - Year-over-year growth 2025-2030 (%)

12.5.2 UK - Market size and forecast 2025-2030

Chart on UK - Market size and forecast 2025-2030 ($ million)
Data Table on UK - Market size and forecast 2025-2030 ($ million)
Chart on UK - Year-over-year growth 2025-2030 (%)
Data Table on UK - Year-over-year growth 2025-2030 (%)

12.5.3 France - Market size and forecast 2025-2030

Chart on France - Market size and forecast 2025-2030 ($ million)
Data Table on France - Market size and forecast 2025-2030 ($ million)
Chart on France - Year-over-year growth 2025-2030 (%)
Data Table on France - Year-over-year growth 2025-2030 (%)

12.5.4 Italy - Market size and forecast 2025-2030

Chart on Italy - Market size and forecast 2025-2030 ($ million)
Data Table on Italy - Market size and forecast 2025-2030 ($ million)
Chart on Italy - Year-over-year growth 2025-2030 (%)
Data Table on Italy - Year-over-year growth 2025-2030 (%)

12.5.5 Spain - Market size and forecast 2025-2030

Chart on Spain - Market size and forecast 2025-2030 ($ million)
Data Table on Spain - Market size and forecast 2025-2030 ($ million)
Chart on Spain - Year-over-year growth 2025-2030 (%)
Data Table on Spain - Year-over-year growth 2025-2030 (%)

12.5.6 The Netherlands - Market size and forecast 2025-2030

Chart on The Netherlands - Market size and forecast 2025-2030 ($ million)
Data Table on The Netherlands - Market size and forecast 2025-2030 ($ million)
Chart on The Netherlands - Year-over-year growth 2025-2030 (%)
Data Table on The Netherlands - Year-over-year growth 2025-2030 (%)

12.6 South America - Market size and forecast 2025-2030

Chart on South America - Market size and forecast 2025-2030 ($ million)
Data Table on South America - Market size and forecast 2025-2030 ($ million)
Chart on South America - Year-over-year growth 2025-2030 (%)
Data Table on South America - Year-over-year growth 2025-2030 (%)
Chart on Regional Comparison - South America
Data Table on Regional Comparison - South America

12.6.1 Brazil - Market size and forecast 2025-2030

Chart on Brazil - Market size and forecast 2025-2030 ($ million)
Data Table on Brazil - Market size and forecast 2025-2030 ($ million)
Chart on Brazil - Year-over-year growth 2025-2030 (%)
Data Table on Brazil - Year-over-year growth 2025-2030 (%)

12.6.2 Argentina - Market size and forecast 2025-2030

Chart on Argentina - Market size and forecast 2025-2030 ($ million)
Data Table on Argentina - Market size and forecast 2025-2030 ($ million)
Chart on Argentina - Year-over-year growth 2025-2030 (%)
Data Table on Argentina - Year-over-year growth 2025-2030 (%)

12.6.3 Chile - Market size and forecast 2025-2030

Chart on Chile - Market size and forecast 2025-2030 ($ million)
Data Table on Chile - Market size and forecast 2025-2030 ($ million)
Chart on Chile - Year-over-year growth 2025-2030 (%)
Data Table on Chile - Year-over-year growth 2025-2030 (%)

12.7 Middle East and Africa - Market size and forecast 2025-2030

Chart on Middle East and Africa - Market size and forecast 2025-2030 ($ million)
Data Table on Middle East and Africa - Market size and forecast 2025-2030 ($ million)
Chart on Middle East and Africa - Year-over-year growth 2025-2030 (%)
Data Table on Middle East and Africa - Year-over-year growth 2025-2030 (%)
Chart on Regional Comparison - Middle East and Africa
Data Table on Regional Comparison - Middle East and Africa

12.7.1 Saudi Arabia - Market size and forecast 2025-2030

Chart on Saudi Arabia - Market size and forecast 2025-2030 ($ million)
Data Table on Saudi Arabia - Market size and forecast 2025-2030 ($ million)
Chart on Saudi Arabia - Year-over-year growth 2025-2030 (%)
Data Table on Saudi Arabia - Year-over-year growth 2025-2030 (%)

12.7.2 UAE - Market size and forecast 2025-2030

Chart on UAE - Market size and forecast 2025-2030 ($ million)
Data Table on UAE - Market size and forecast 2025-2030 ($ million)
Chart on UAE - Year-over-year growth 2025-2030 (%)
Data Table on UAE - Year-over-year growth 2025-2030 (%)

12.7.3 South Africa - Market size and forecast 2025-2030

Chart on South Africa - Market size and forecast 2025-2030 ($ million)
Data Table on South Africa - Market size and forecast 2025-2030 ($ million)
Chart on South Africa - Year-over-year growth 2025-2030 (%)
Data Table on South Africa - Year-over-year growth 2025-2030 (%)

12.7.4 Turkey - Market size and forecast 2025-2030

Chart on Turkey - Market size and forecast 2025-2030 ($ million)
Data Table on Turkey - Market size and forecast 2025-2030 ($ million)
Chart on Turkey - Year-over-year growth 2025-2030 (%)
Data Table on Turkey - Year-over-year growth 2025-2030 (%)

12.7.5 Israel - Market size and forecast 2025-2030

Chart on Israel - Market size and forecast 2025-2030 ($ million)
Data Table on Israel - Market size and forecast 2025-2030 ($ million)
Chart on Israel - Year-over-year growth 2025-2030 (%)
Data Table on Israel - Year-over-year growth 2025-2030 (%)

12.8 Market opportunity by geography

Market opportunity by geography ($ million)
Data Tables on Market opportunity by geography ($ million)

13. Drivers, Challenges, and Opportunity

13.1 Market drivers

Proliferation of self-service banking and operational efficiency
Demand for financial inclusion and cash accessibility in emerging economies
Technological advancements in security and biometric authentication

13.2 Market challenges

Rapid proliferation of digital payment alternatives and cashless initiatives
Escalating cybersecurity threats and sophisticated physical attacks
High operational costs and regulatory compliance burdens

13.3 Impact of drivers and challenges

Impact of drivers and challenges in 2025 and 2030

13.4 Market opportunities

Integration of AI and predictive maintenance frameworks
Global expansion of the ATM-as-a-service outsourcing model
Rise of cash recycling and sustainability-driven infrastructure

14. Competitive Landscape

14.1 Overview

14.2

Overview on criticality of inputs and factors of differentiation

14.3 Landscape disruption

Overview on factors of disruption

14.4 Industry risks

Impact of key risks on business

15. Competitive Analysis

15.1 Companies profiled

Companies covered

15.2 Company ranking index

15.3 Market positioning of companies

Matrix on companies position and classification

15.4 ACI Worldwide Inc.

ACI Worldwide Inc. - Overview
ACI Worldwide Inc. - Business segments
ACI Worldwide Inc. - Key offerings
ACI Worldwide Inc. - Segment focus
SWOT

15.5 Cennox Inc.

Cennox Inc. - Overview
Cennox Inc. - Product / Service
Cennox Inc. - Key offerings
SWOT

15.6 CSG Systems International Inc.

CSG Systems International Inc. - Overview
CSG Systems International Inc. - Product / Service
CSG Systems International Inc. - Key offerings
SWOT

15.7 Euronet Worldwide Inc.

Euronet Worldwide Inc. - Overview
Euronet Worldwide Inc. - Business segments
Euronet Worldwide Inc. - Key offerings
Euronet Worldwide Inc. - Segment focus
SWOT

15.8 Fidelity National Information

Fidelity National Information - Overview
Fidelity National Information - Business segments
Fidelity National Information - Key offerings
Fidelity National Information - Segment focus
SWOT

15.9 Financial software and systems

Financial software and systems - Overview
Financial software and systems - Product / Service
Financial software and systems - Key offerings
SWOT

15.10 Hyosung TNS Inc.

Hyosung TNS Inc. - Overview
Hyosung TNS Inc. - Product / Service
Hyosung TNS Inc. - Key offerings
SWOT

15.11 KAL ATM Software GmbH

KAL ATM Software GmbH - Overview
KAL ATM Software GmbH - Product / Service
KAL ATM Software GmbH - Key offerings
SWOT

15.12 KEBA Group AG

KEBA Group AG - Overview
KEBA Group AG - Product / Service
KEBA Group AG - Key offerings
SWOT

15.13 Loomis AB

Loomis AB - Overview
Loomis AB - Business segments
Loomis AB - Key offerings
Loomis AB - Segment focus
SWOT

15.14 NCR Payment Solutions LLC

NCR Payment Solutions LLC - Overview
NCR Payment Solutions LLC - Business segments
NCR Payment Solutions LLC - Key offerings
NCR Payment Solutions LLC - Segment focus
SWOT

15.15 Parabit Systems Inc.

Parabit Systems Inc. - Overview
Parabit Systems Inc. - Product / Service
Parabit Systems Inc. - Key offerings
SWOT

15.16 Phoenix Interactive Design Inc.

Phoenix Interactive Design Inc. - Overview
Phoenix Interactive Design Inc. - Product / Service
Phoenix Interactive Design Inc. - Key offerings
SWOT

15.17 Triton Systems

Triton Systems - Overview
Triton Systems - Product / Service
Triton Systems - Key offerings
SWOT

15.18 Vortex Engineering Pvt. Ltd.

Vortex Engineering Pvt. Ltd. - Overview
Vortex Engineering Pvt. Ltd. - Product / Service
Vortex Engineering Pvt. Ltd. - Key offerings
SWOT

16. Appendix

16.1 Scope of the report

Market definition
Objectives
Notes and caveats

16.2 Inclusions and exclusions checklist

Inclusions checklist
Exclusions checklist

16.3 Currency conversion rates for US$

16.4 Research methodology

16.5 Data procurement

Information sources

16.6 Data validation

16.7 Validation techniques employed for market sizing

16.8 Data synthesis

16.9 360 degree market analysis

16.10 List of abbreviations

Research Methodology

Technavio presents a detailed picture of the market by way of study, synthesis, and summation of data from multiple sources. The analysts have presented the various facets of the market with a particular focus on identifying the key industry influencers. The data thus presented is comprehensive, reliable, and the result of extensive research, both primary and secondary.

INFORMATION SOURCES

Primary sources

  • Manufacturers and suppliers
  • Channel partners
  • Industry experts
  • Strategic decision makers

Secondary sources

  • Industry journals and periodicals
  • Government data
  • Financial reports of key industry players
  • Historical data
  • Press releases

DATA ANALYSIS

Data Synthesis

  • Collation of data
  • Estimation of key figures
  • Analysis of derived insights

Data Validation

  • Triangulation with data models
  • Reference against proprietary databases
  • Corroboration with industry experts

REPORT WRITING

Qualitative

  • Market drivers
  • Market challenges
  • Market trends
  • Five forces analysis

Quantitative

  • Market size and forecast
  • Market segmentation
  • Geographical insights
  • Competitive landscape

Interested in this report?

Get your sample now to see our research methodology and insights!

Download Now

Frequently Asked Questions

Automated Teller Machine (ATM) market growth will increase by USD 6703.0 million during 2026-2030.

The Automated Teller Machine (ATM) market is expected to grow at a CAGR of 4.8% during 2026-2030.

Automated Teller Machine (ATM) market is segmented by Type (Brown label, White label, Others) Deployment (Offsite ATM, Onsite ATM, Others) Solution (Deployment solutions, Managed services)

ACI Worldwide Inc., Cennox Inc., CSG Systems International Inc., Euronet Worldwide Inc., Fidelity National Information, Financial software and systems, Hyosung TNS Inc., KAL ATM Software GmbH, KEBA Group AG, Loomis AB, NCR Payment Solutions LLC, Optima Systems Ltd., Parabit Systems Inc., Phoenix Interactive Design Inc., Sesami Inc., Sigma Spa, STEMMER IMAGING AG, Triton Systems, Vortex Engineering Pvt. Ltd. are a few of the key vendors in the Automated Teller Machine (ATM) market.

APAC will register the highest growth rate of 43.6% among the other regions. Therefore, the Automated Teller Machine (ATM) market in APAC is expected to garner significant business opportunities for the vendors during the forecast period.

India, China, Japan, South Korea, Indonesia, Australia, US, Canada, Mexico, Germany, UK, France, Italy, Spain, The Netherlands, Brazil, Argentina, Chile, Saudi Arabia, UAE, South Africa, Turkey, Israel

  • Proliferation of self-service banking and operational efficiency is the driving factor this market.

The Automated Teller Machine (ATM) market vendors should focus on grabbing business opportunities from the Type segment as it accounted for the largest market share in the base year.
RIA - Research AI Assistant
Ask RIA