Automation Market In Automotive Industry Size 2025-2029
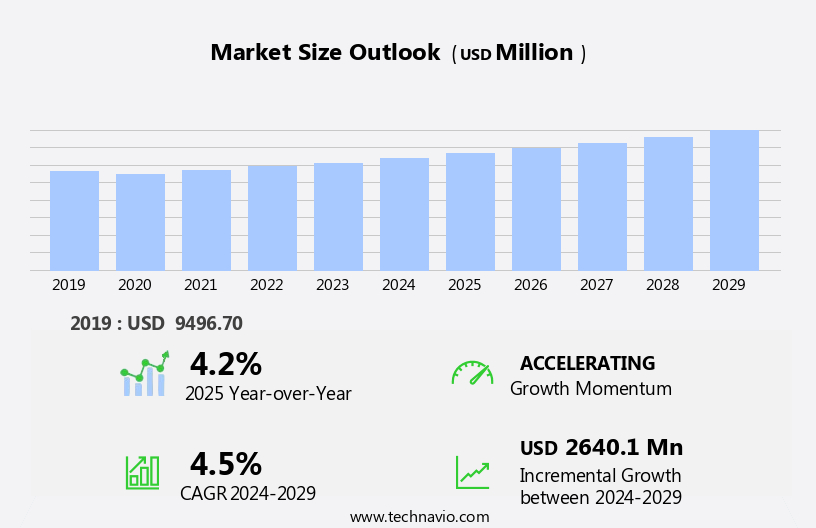
The automation market in automotive industry size is forecast to increase by USD 2.64 billion, at a CAGR of 4.5% between 2024 and 2029.
- The Automation Market in the Automotive Industry is witnessing significant growth, driven by the increasing demand for enhanced visibility and flexibility in manufacturing processes. This trend is particularly prominent in the context of Industry 4.0, which emphasizes the integration of advanced technologies, such as the Internet of Things (IoT) and artificial intelligence (AI), into manufacturing systems. The emergence of smart manufacturing is a key trend, as it enables real-time monitoring and optimization of production processes, leading to increased efficiency and cost savings. However, the market also faces challenges, most notably the security threats to industrial control systems. With the increasing adoption of connected technologies, there is a growing risk of cyber-attacks, which can disrupt manufacturing processes and compromise sensitive data.
- Addressing these security challenges is essential for companies seeking to capitalize on the opportunities presented by automation in the automotive industry. Effective strategies include implementing robust cybersecurity measures, such as firewalls and intrusion detection systems, and establishing clear protocols for data access and sharing. By addressing these challenges and leveraging the benefits of automation, companies can improve their competitive position and enhance their operational capabilities.
What will be the Size of the Automation Market In Automotive Industry during the forecast period?
Explore in-depth regional segment analysis with market size data - historical 2019-2023 and forecasts 2025-2029 - in the full report.
Request Free Sample
The automotive industry continues to witness dynamic market activities as automation technologies evolve and find applications across various sectors. Machine learning algorithms and computer vision are integral components of advanced driver assistance systems (ADAS), enabling features such as object recognition, lane keeping assist, and blind spot monitoring. These technologies are also being integrated into public transportation, enhancing safety and efficiency. The integration of artificial intelligence (AI) and deep learning networks is revolutionizing the automotive industry, from infotainment systems to autonomous vehicle development. Edge computing and 5G connectivity facilitate real-time data processing and communication between vehicles, infrastructure, and cloud platforms.
Hybrid and electric vehicles are gaining popularity, with battery management systems and powertrain optimization playing crucial roles in enhancing fuel efficiency and reducing emissions. Autonomous delivery vehicles and logistics and warehousing applications are also on the rise, contributing to the evolving automation landscape. The integration of ultrasonic sensors, V2X communication, and adaptive cruise control systems is essential for ensuring safety standards in autonomous vehicles. Human-machine interface (HMI) design and software development are critical aspects of developing user-friendly and effective autonomous systems. Fleet management and production line optimization are other areas where automation is transforming the industry. Ethical considerations, data privacy, and regulations and legislation are increasingly becoming important aspects of the automation market in the automotive industry.
The continuous development of infrastructure, including charging infrastructure and traffic sign recognition systems, is essential for the successful implementation of autonomous vehicles. Ongoing validation and testing, along with real-world applications, are crucial for ensuring the reliability and safety of these advanced technologies. In the manufacturing sector, automation is being used to optimize production lines and improve quality control. The integration of AI, deep learning networks, and sensor fusion is enabling more efficient and effective manufacturing processes. The social impact of automation in the automotive industry is significant, with potential implications for job displacement and the future of work.
As the market continues to evolve, it is essential to consider these factors and ensure a smooth transition towards a more automated future.
How is this Automation In Automotive Industry Industry segmented?
The automation in automotive industry industry research report provides comprehensive data (region-wise segment analysis), with forecasts and estimates in "USD million" for the period 2025-2029, as well as historical data from 2019-2023 for the following segments.
- Technology
- Industrial sensors
- PLC
- MES
- SCADA
- DCS
- End-user
- Vehicle manufacturers
- Component manufacturers
- Geography
- North America
- US
- Canada
- Europe
- France
- Germany
- UK
- APAC
- Australia
- China
- India
- Japan
- South Korea
- Rest of World (ROW)
- North America
By Technology Insights
The industrial sensors segment is estimated to witness significant growth during the forecast period.
In the automotive industry, technology advancements are revolutionizing vehicle manufacturing and usage. Machine learning algorithms and artificial intelligence (AI) are integrated into various systems, from powertrain optimization and fuel efficiency to safety standards and ethical considerations. Sensor fusion, including ultrasonic sensors, computer vision, and traffic sign recognition, enhances driver assistance and autonomous vehicle capabilities. Connected car platforms facilitate real-time data analytics and v2x communication, enabling adaptive cruise control, lane keeping assist, and blind spot monitoring. Edge computing and high-performance computing enable advanced driver monitoring systems and autonomous valet parking. Infrastructure development, including charging infrastructure and smart city applications, supports the integration of electric vehicles (EVs) and ride-hailing services into our daily lives.
Battery management systems and vehicle-to-infrastructure (v2i) communication optimize EV charging and grid management. Logistics and warehousing benefit from AI and data analytics, improving fleet management and reducing emissions. Production line optimization and social impact are addressed through manufacturing automation and job displacement mitigation strategies. Safety standards and regulations ensure the integration of these technologies in a secure and ethical manner. As the industry moves towards level 0-5 autonomy, it is essential to maintain quality control and address data privacy concerns. The future of the automotive industry lies in the seamless integration of these technologies, transforming the way we travel and live.
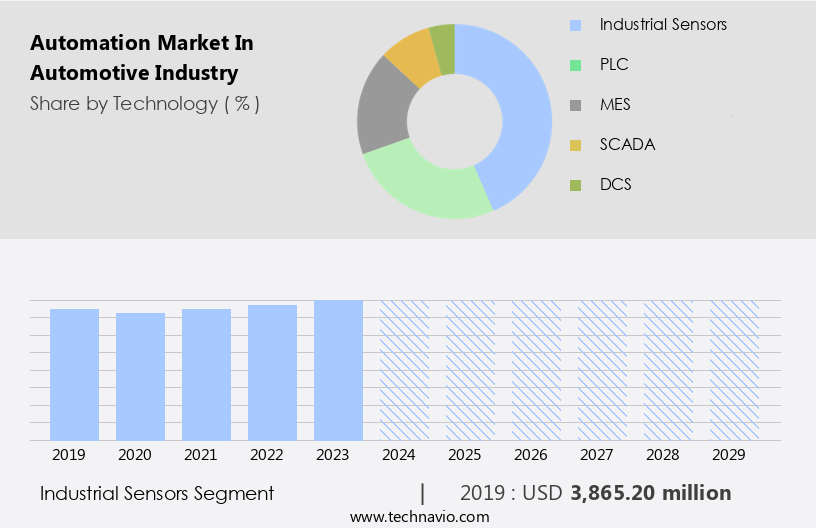
The Industrial sensors segment was valued at USD 3.87 billion in 2019 and showed a gradual increase during the forecast period.
Regional Analysis
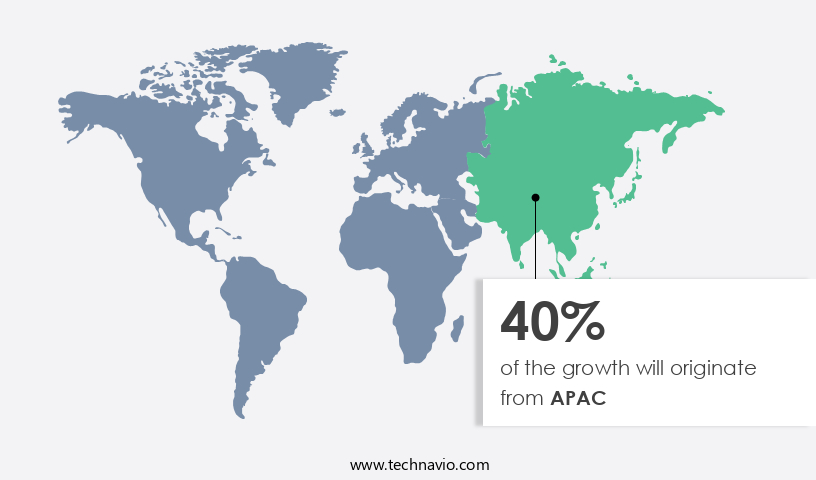
APAC is estimated to contribute 40% to the growth of the global market during the forecast period.Technavio’s analysts have elaborately explained the regional trends and drivers that shape the market during the forecast period.
The automation market in the automotive industry is experiencing significant growth in APAC, fueled by a robust industrial base, government initiatives, and increasing demand for locally manufactured vehicles. Automakers are implementing automation solutions in manufacturing plants to reduce costs, minimize downtime, and boost productivity, providing them with a competitive advantage. Industrial robots are among the key technologies driving this trend, enabling efficient production processes and enhancing product quality. In the realm of connected cars, advanced technologies such as machine learning algorithms, data analytics, and edge computing are transforming the industry. Autonomous vehicles, including electric and hybrid models, are gaining popularity due to their fuel efficiency and reduced emissions.
Autonomous valet parking and adaptive cruise control systems are becoming increasingly common, enhancing the driving experience and improving safety. Moreover, the integration of computer vision, object recognition, and vehicle-to-infrastructure (v2i) communication is enabling advanced parking assistance systems and traffic sign recognition, making urban mobility more efficient and convenient. Safety standards and ethical considerations are also at the forefront of innovation, with driver monitoring systems and blind spot monitoring becoming standard features. The adoption of real-world testing and sensor fusion is crucial for the development and validation of autonomous vehicles. Regulations and legislation are evolving to accommodate these advancements, with 5G connectivity and cloud computing playing a significant role in enabling seamless communication between vehicles and infrastructure.
The automation market in the automotive industry is also impacting logistics and warehousing, with fleet management and production line optimization solutions improving efficiency and reducing costs. The integration of artificial intelligence (AI), human-machine interface (HMI), and deep learning networks is revolutionizing infotainment systems, enhancing the driving experience for consumers. Despite the numerous benefits, concerns around data privacy and job displacement persist, highlighting the need for careful consideration and ethical implementation of these technologies. Overall, the automation market in the automotive industry is undergoing a transformative period, with innovative technologies and trends shaping the future of mobility.
Market Dynamics
Our researchers analyzed the data with 2024 as the base year, along with the key drivers, trends, and challenges. A holistic analysis of drivers will help companies refine their marketing strategies to gain a competitive advantage.
What are the key market drivers leading to the rise in the adoption of Automation In Automotive Industry Industry?
- The significant demand for heightened visibility and flexibility in manufacturing processes serves as the primary market driver.
- The automation market in the automotive industry is experiencing significant growth due to the increasing demand for advanced technologies in vehicle manufacturing. Machine learning algorithms, data analytics, and computer vision are key technologies driving this market. Real-time data and visibility are essential for automotive manufacturers, and automation systems provide this through continuous monitoring of production lines, equipment status, and inventory levels. This data enables manufacturers to optimize processes, reduce operational costs, and enhance productivity. Smart city applications, such as parking assistance systems and driver monitoring systems, are also fueling the demand for automation in the automotive industry. Edge computing and connected car platforms are facilitating the integration of these systems, allowing for real-time data processing and analysis.
- Hybrid vehicles and battery management systems are other areas where automation is making a significant impact, with machine learning algorithms used for predictive maintenance and optimization. Infrastructure development for vehicle-to-infrastructure (v2i) communication is another key trend in the automotive automation market. This technology enables vehicles to communicate with traffic signals, road signs, and other infrastructure, improving safety and efficiency. Overall, the automation market in the automotive industry is a dynamic and innovative space, with ongoing developments in machine learning algorithms, data analytics, and infrastructure development driving growth.
What are the market trends shaping the Automation In Automotive Industry Industry?
- Smart manufacturing is an emerging market trend. The implementation of advanced technologies, such as automation, artificial intelligence, and the Internet of Things, is driving the growth of this trend in manufacturing industries.
- In the automotive industry, automation is driving advancements in various areas, from powertrain optimization and lane keeping assist to autonomous delivery vehicles and infotainment systems. The integration of sensors, sensor fusion, and high-performance computing enables real-world testing and safety standards compliance for autonomous vehicles and valet parking. Electric vehicles (EVs) are a significant focus, with the need for fuel efficiency and sensor technology optimization.
- Logistics and warehousing operations are also benefiting from automation, improving efficiency and reducing human error. However, ethical considerations, such as data privacy and cybersecurity, must be addressed as automation continues to evolve. The future of the automotive industry lies in the seamless integration of technology and human interaction, creating an immersive and harmonious driving experience.
What challenges does the Automation In Automotive Industry Industry face during its growth?
- The growth of the industry is significantly impacted by the complex security challenges associated with industrial control systems. These challenges, which require the expertise of professionals, pose a critical threat to the reliable operation and integrity of industrial processes. Addressing these issues is essential for ensuring business continuity and mitigating potential risks to safety and productivity.
- In the automotive industry, the integration of advanced technologies such as object recognition, v2x communication, and adaptive cruise control is revolutionizing the manufacturing process and transportation services. However, securing legacy industrial control systems, which were established during the pre-Internet era, poses a significant challenge. These systems, primarily used in Europe and the US, were not designed for connectivity or authentication, making them susceptible to security threats. Replacing these systems is cost-prohibitive for companies. To enhance productivity and system functions, new industrial control systems must incorporate both IT and OT technologies and software. Key technologies include ultrasonic sensors, artificial intelligence (AI), human-machine interface (HMI), deep learning networks, fleet management, and ride-hailing services.
- These advancements will enable level 0-5 autonomy and optimize production lines. However, ensuring the security of these new systems is crucial to prevent potential vulnerabilities. The automotive industry's transition to advanced technologies will significantly impact public transportation and ride-hailing services, offering increased efficiency, safety, and convenience. System integration and continuous innovation are essential to remain competitive in this rapidly evolving market.
Exclusive Customer Landscape
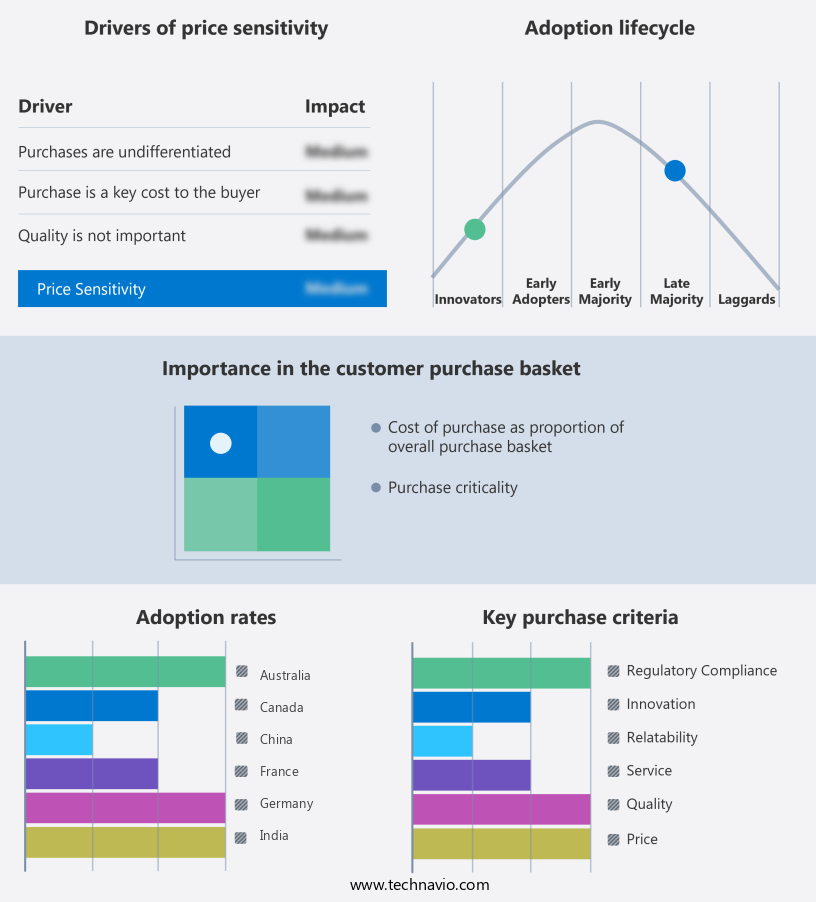
The automation market in automotive industry forecasting report includes the adoption lifecycle of the market, covering from the innovator’s stage to the laggard’s stage. It focuses on adoption rates in different regions based on penetration. Furthermore, the automation market in automotive industry report also includes key purchase criteria and drivers of price sensitivity to help companies evaluate and develop their market growth analysis strategies.
Customer Landscape
Key Companies & Market Insights
Companies are implementing various strategies, such as strategic alliances, automation market in automotive industry forecast, partnerships, mergers and acquisitions, geographical expansion, and product/service launches, to enhance their presence in the industry.
ABB Ltd. - The automotive industry benefits from the company's automation solutions, encompassing press operations, body in white processing, paint applications, and final assembly. By implementing advanced technologies, these processes experience increased efficiency and precision. The result is a streamlined production line, reduced costs, and improved product quality. The company's commitment to innovation drives continuous advancements in automation, ensuring a competitive edge in the global market.
The industry research and growth report includes detailed analyses of the competitive landscape of the market and information about key companies, including:
- ABB Ltd.
- Applied Materials Inc.
- Aurotek Corp. Inc.
- Auto Control Systems
- Denso Robotics
- Emerson Electric Co.
- FANUC Bulgaria EOOD
- Festo SE and Co. KG
- General Electric Co.
- Kawasaki Heavy Industries Ltd.
- KUKA AG
- Mitsubishi Electric Corp.
- OMRON Corp.
- Rockwell Automation Inc.
- Schneider Electric SE
- Siemens AG
- Yaskawa Electric Corp.
- Yokogawa Electric Corp.
Qualitative and quantitative analysis of companies has been conducted to help clients understand the wider business environment as well as the strengths and weaknesses of key industry players. Data is qualitatively analyzed to categorize companies as pure play, category-focused, industry-focused, and diversified; it is quantitatively analyzed to categorize companies as dominant, leading, strong, tentative, and weak.
Recent Development and News in Automation Market In Automotive Industry
- In February 2023, Bosch and BMW announced a strategic partnership to develop and produce automated driving systems for BMW and Mini vehicles. This collaboration represents a significant step towards mass-producing autonomous vehicles (Bosch press release).
- In March 2024, Tesla unveiled its latest technological advancement, the "Full Self-Driving" (FSD) Beta software update, which allows Tesla vehicles to navigate city streets without human intervention under certain conditions. This development marks a major milestone in the automation market, with Tesla leading the way in autonomous driving technology (Tesla press release).
- In May 2024, General Motors (GM) and Cruise, its autonomous vehicle subsidiary, secured a USD2 billion investment from Honda to expand their autonomous vehicle development and deployment efforts. This strategic partnership and investment will enable the companies to accelerate their autonomous vehicle programs and expand their market reach (GM press release).
- In December 2024, the European Union passed the "Regulation on Type Approval and Conformity of Production of Vehicles, their Components, and Separate Technical Units," which includes provisions for the approval of automated driving systems. This regulatory approval is a crucial development for the automation market in Europe, paving the way for the mass production and deployment of autonomous vehicles (European Parliament press release).
Research Analyst Overview
- The automotive industry's automation market is experiencing significant advancements, with motion control systems and AI-powered fault diagnosis leading the charge. Network security and legal liability concerns are increasingly important as manufacturers integrate more data monetization strategies and implement additive manufacturing and sustainable manufacturing practices using lightweight materials like carbon fiber. AI is also revolutionizing driver training through robotic process automation and human factors engineering. Sensor calibration and fault detection are critical components of automated quality inspection, ensuring green technology and OTA updates are effective. Big data analytics plays a crucial role in path planning and supply chain optimization, while 3D printing and additive manufacturing enable the production of composite materials.
- Data security is paramount as manufacturers monetize data and implement AI systems, requiring robust network security measures. Public acceptance of autonomous vehicles and the integration of green technology are key trends shaping the industry. Despite these advancements, challenges remain, including the need for standardized regulations and addressing insurance implications.
Dive into Technavio’s robust research methodology, blending expert interviews, extensive data synthesis, and validated models for unparalleled Automation Market In Automotive Industry insights. See full methodology.
|
Market Scope |
|
|
Report Coverage |
Details |
|
Page number |
215 |
|
Base year |
2024 |
|
Historic period |
2019-2023 |
|
Forecast period |
2025-2029 |
|
Growth momentum & CAGR |
Accelerate at a CAGR of 4.5% |
|
Market growth 2025-2029 |
USD 2640.1 million |
|
Market structure |
Fragmented |
|
YoY growth 2024-2025(%) |
4.2 |
|
Key countries |
China, Japan, India, US, South Korea, Australia, Germany, UK, Canada, and France |
|
Competitive landscape |
Leading Companies, Market Positioning of Companies, Competitive Strategies, and Industry Risks |
What are the Key Data Covered in this Automation Market In Automotive Industry Research and Growth Report?
- CAGR of the Automation In Automotive Industry industry during the forecast period
- Detailed information on factors that will drive the growth and forecasting between 2025 and 2029
- Precise estimation of the size of the market and its contribution of the industry in focus to the parent market
- Accurate predictions about upcoming growth and trends and changes in consumer behaviour
- Growth of the market across APAC, Europe, North America, South America, and Middle East and Africa
- Thorough analysis of the market’s competitive landscape and detailed information about companies
- Comprehensive analysis of factors that will challenge the automation market in automotive industry growth of industry companies
We can help! Our analysts can customize this automation market in automotive industry research report to meet your requirements.
 RIA -
RIA - 
