Automotive Camless Engine Market Size 2024-2028
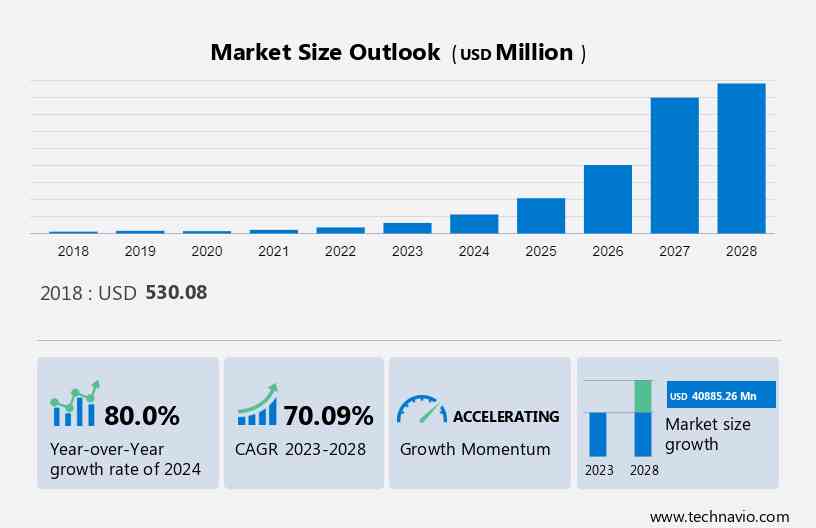
The automotive camless engine market size is estimated to grow by USD 40.88 billion at a CAGR of 70.09% between 2023 and 2028. Market growth hinges on various factors, including the electrification of automotive components to enhance braking efficiency and fuel economy, the benefits of improved fuel efficiency and enhanced power output, and the declining retail gasoline prices. These elements collectively propel market expansion, reflecting advancements in automotive technology and shifting consumer preferences. The electrification of automotive components underscores the industry's drive towards sustainability and performance optimization. Simultaneously, the advantages of greater fuel efficiency and power signify the demand for vehicles offering improved performance and environmental friendliness. Additionally, the decreasing prices of retail gasoline contribute to cost savings for consumers and encourage vehicle usage. Thus, the interplay of these factors delineates the landscape for the anticipated growth of the automotive market, presenting opportunities for stakeholders in the electrification and fuel efficiency segments.
It also includes an in-depth analysis of drivers, trends, and challenges. Furthermore, the report includes historic market data from 2018 - 2022.
What will be the Size of the Market During the Forecast Period?
For More Highlights About this Report, Download Free Sample in a Minute
Market Segmentation
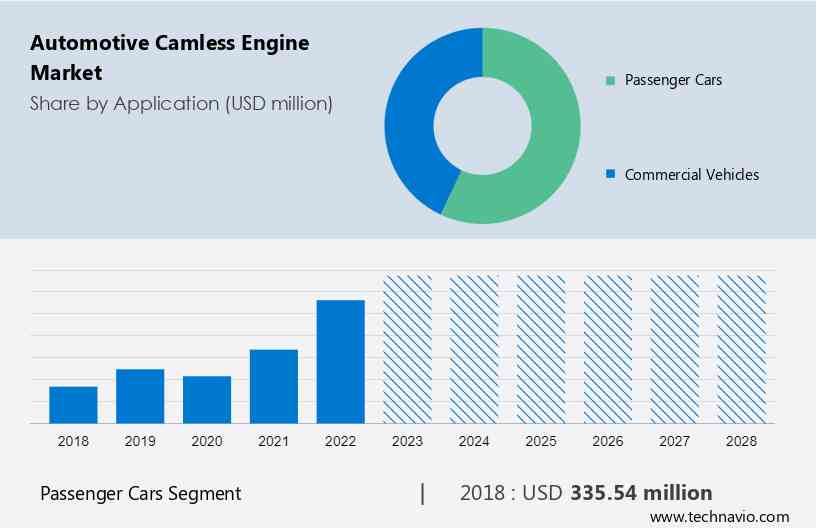
By Application
The passenger cars segment is estimated to witness significant growth during the forecast period. Developed automotive markets, including Europe and North America, contribute significantly to the market. One of the main reasons is that the vehicles sold in these regions have a maximum uptake of modern automotive camless engines. Furthermore, stringent regulatory norms on fuel efficiency are driving automakers and companies to improve the design of camless engines and related components, such as the engine control module (ECM).
Get a glance at the market contribution of various segments Download the PDF Sample
The passenger cars segment was the largest segment and was valued at USD 335.54 million in 2018. Moreover, the increasing demand for fuel efficiency in passenger cars by customers is fuelling the adoption of additional features in vehicles. In addition, the automotive camless engine and its related components, such as fuel pumps, sensors, and electronic control units (ECU), have also evolved in terms of design and the functionality offered. Furthermore, the increasing demand for premium-segment luxury cars from emerging and developed economies is fuelling the growth of this segment which in turn will drive the market growth during the forecast period.
By Region
For more insights on the market share of various regions Download PDF Sample now!
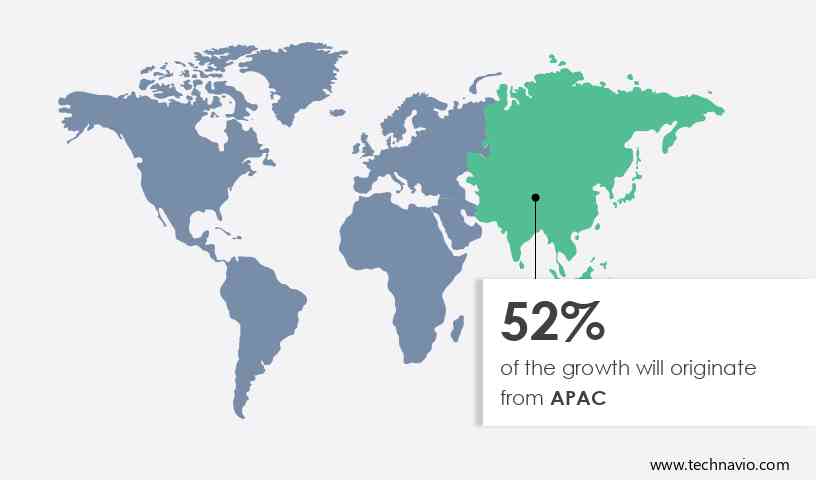
APAC is estimated to contribute 52% to the growth of the global market during the forecast period. Technavio’s analysts have elaborately explained the regional trends and drivers that shape the market during the forecast period. Some of the main revenue-contributing countries in the market in APAC include China, India, and Japan. In addition, these countries are high-volume adopters of vehicles. Moreover, factors such as the increasing disposable incomes in emerging economies such as China and India have led to a rise in the number of car buyers. Therefore, the automotive industry in the region fuels the demand for automotive camless engines. The high purchasing power has increased the sales of luxury cars in the region. Furthermore, the high purchasing power has increased the sales of luxury cars in the region. Hence, such factors drive the market growth in APAC during the forecast period.
Market Dynamics
The market witnesses a shift towards innovative technologies like poppet valves and electromagnetic actuator systems, replacing traditional hydraulic and pneumatic actuator systems. With the emergence of free valve engines and advancements in electromechanical technology, springs and friction losses are minimized, improving engine efficiency. This evolution aligns with stricter environmental laws and CO2 criteria, promoting hybrid and electric powertrains for reduced emissions. The adoption of solenoid-driven systems and conventional cams ensures compliance while addressing maintenance requirements and enhancing lifespans. As automobiles seek cost reductions, the market drives towards industrialization and optimization to meet the demands of the EU market. Our researchers analyzed the data with 2023 as the base year, along with the key drivers, trends, and challenges. A holistic analysis of drivers will help companies refine their marketing strategies to gain a competitive advantage.
Key Market Driver
One of the key factors driving the market growth is the advantage of greater fuel efficiency and more power. The research and development in the field of automotive powertrains have resulted in the development of more efficient designs in the field of automotive engines, camshafts, crankshafts, cylinder heads, and timing belts, among others. In addition, an engine forms the heart of a vehicle, and therefore, vehicles' engine has witnessed major developments and improvements over the years.
Moreover, the development of the camless engine design promises to be more efficient and durable than the conventional one. In addition, the valve operation is greatly optimized for the use of camless engine profiles as the system uses either a pneumatic, electrohydraulic, or electromagnetic actuator for precision control of the valve. Hence, such factors are positively impacting the market. Therefore, it is expected to drive the market growth during the forecast period.
Significant Market Trends
A key factor shaping the market growth is the development of single-cylinder light-duty camless engines. The global automotive industry has witnessed a significant revolution in the field of powertrain, safety, technology, comfort, and convenience systems. In addition, modern cars are much more technically advanced compared with their predecessors, with the automotive industry shifting toward autonomous mobility.
Moreover, automotive engines have been one of the primary areas of development, with engine designers and manufacturers continuously investing in the research and development of advanced engine systems. For instance, Ricardo is a global engineering and consultancy firm that specializes in the manufacturing of high-performance products. The company offers consulting solutions in the fields of technical, performance, critical, energy, strategic, and environmental, among others. Hence, such developments are positively impacting the market. Therefore, it is expected to drive the market growth during the forecast period.
Major Market Challenge
Chances of technical failure of automotive camless engine system are one of the key challenges hindering the automotive camless engine market growth. The automotive camless engine profile exhibits several advantages and benefits over traditional cam engines. The flexibility of the valve mechanism inherited into the system with the use of pneumatic or electrohydraulic actuators is one of the biggest takeaways of this advanced system, which is leading to its growing popularity in the automotive industry.
Moreover, several stakeholders involved in engine development and testing are finding ways to make camless engine designs suitable for mass adoption. However, the significant complexity and integration of numerous delicate sub-systems and components pose a challenge to the viability of the camless engine design on a large scale. Furthermore, the integration of more electronic components also means that the repairs and replacement of parts would inherently be more expensive and frequent. Hence, such factors are negatively impacting the market growth during the forecast period.
Key Market Customer Landscape
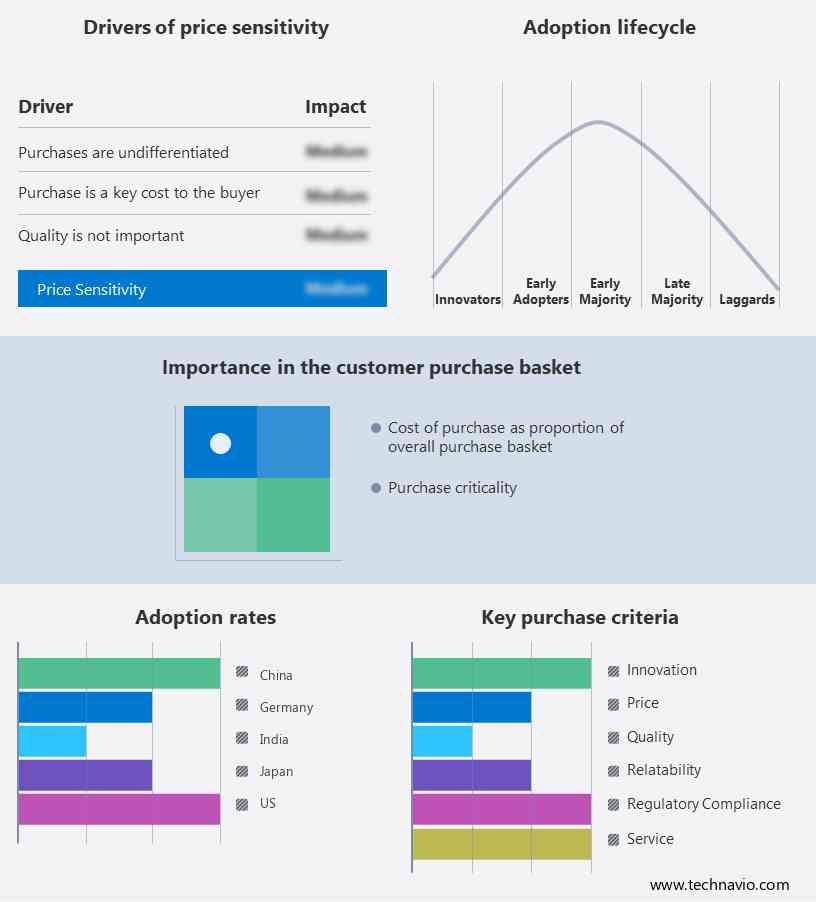
The market research report includes the adoption lifecycle of the market, covering from the innovator’s stage to the laggard’s stage. It focuses on adoption rates in different regions based on penetration. Furthermore, the report also includes key purchase criteria and drivers of price sensitivity to help companies evaluate and develop their growth strategies.
Global Market Customer Landscape
Who are the Major Market Companies?
Companies are implementing various strategies, such as strategic alliances, partnerships, mergers and acquisitions, geographical expansion, and product/service launches, to enhance their presence in the market.
BorgWarner Inc: The company offers automotive camless engine products such as Cam Torque Actuated Phasers, Intelligent Cam Torque Actuation, and Torsional Assist Phasers.
The research report also includes detailed analyses of the competitive landscape of the market and information about 10 market companies, including:
- Camcon Auto Ltd.
- ElringKlinger AG
- Freevalve AB
- Linamar Corp.
- Musashi Seimitsu Industry Co. Ltd.
- NEMAK SAB de CV
- Parker Hannifin Corp.
- Textron Inc.
- thyssenkrupp AG
Qualitative and quantitative analysis of companies has been conducted to help clients understand the wider business environment as well as the strengths and weaknesses of key market players. Data is qualitatively analyzed to categorize companies as pure play, category-focused, industry-focused, and diversified; it is quantitatively analyzed to categorize companies as dominant, leading, strong, tentative, and weak.
Segment Overview
The market research report provides comprehensive data (region-wise segment analysis), with forecasts and estimates in "USD Billion" for the period 2024 to 2028, as well as historical data from 2018 to 2023 for the following segments
- Application Outlook
- Passenger cars
- Commercial vehicles
- Type Outlook
- Gasoline engine
- Diesel engine
- Geography Outlook
- North America
- The U.S.
- Canada
- Europe
- U.K.
- Germany
- France
- Rest of Europe
- APAC
- China
- India
- South America
- Chile
- Argentina
- Brazil
- Middle East & Africa
- Saudi Arabia
- South Africa
- Rest of the Middle East & Africa
- North America
You may also interested in the below market reports
-
Automotive Engine Market: Automotive Engine Market Analysis APAC, North America, Europe, South America, Middle East and Africa - US, China, Japan, India, Germany - Size and Forecast
-
Automotive Balance Shaft Market: Automotive Balance Shaft Market Analysis APAC, Europe, North America, South America, Middle East and Africa - China, US, Japan, India, Germany - Size and Forecast
-
Timing Gear Market: Timing Gear Market Analysis North America, Europe, APAC, South America, Middle East and Africa - US, Canada, China, UK, Germany - Size and Forecast
Market Analyst Overview
The market is experiencing a paradigm shift with the adoption of innovative technologies like hydraulic actuator systems and the revolutionary free valve engine concept. By eliminating the traditional valve train and integrating advanced computer systems, the market aims to address issues such as mechanical failure and reduce carbon emissions. Original Equipment Manufacturers (OEMs) are investing in pneumatic and electromagnetic actuators to enhance the efficiency of exhaust valves and intake valves. The transition to a camless arrangement heralds a new era in engine development, optimizing engine configuration for optimum performance while complying with stringent CO2 emission reduction targets set by global governments and emission regulations to combat air pollution and greenhouse gas emissions from internal combustion engines. This shift towards camless engine technology enables precise control over engine load, speed, and operating circumstances, effectively mitigating the release of hazardous exhaust gases through sophisticated synchronization and control strategies that facilitate real-time changes in engine operation.
|
Market Scope |
|
|
Report Coverage |
Details |
|
Page number |
155 |
|
Base year |
2023 |
|
Historic period |
2018 - 2022 |
|
Forecast period |
2024-2028 |
|
Growth momentum & CAGR |
Accelerate at a CAGR of 70.09% |
|
Market Growth 2024-2028 |
USD 40.88 bllion |
|
Market structure |
Concentrated |
|
YoY growth 2023-2024(%) |
80.0 |
|
Regional analysis |
APAC, Europe, North America, Middle East and Africa, and South America |
|
Performing market contribution |
APAC at 52% |
|
Key countries |
US, China, Japan, India, and Germany |
|
Competitive landscape |
Leading Companies, Market Positioning of Companies, Competitive Strategies, and Industry Risks |
|
Key companies profiled |
BorgWarner Inc., Camcon Auto Ltd., ElringKlinger AG, Freevalve AB, Linamar Corp., Musashi Seimitsu Industry Co. Ltd., NEMAK SAB de CV, Parker Hannifin Corp., Textron Inc., and thyssenkrupp AG |
|
Market dynamics |
Parent market analysis, Market Forecasting, Market growth inducers and obstacles, Fast-growing and slow-growing segment analysis, COVID-19 impact and recovery analysis and future consumer dynamics, and Market condition analysis for the market forecast period. |
|
Customization purview |
If our report has not included the data that you are looking for, you can reach out to our analysts and get segments customized. |
What are the Key Data Covered in this Market Report?
- CAGR of the market during the forecast period
- Detailed information on factors that will drive the market growth and forecasting of the market between 2024 and 2028
- Precise estimation of the size of the market size and its contribution to the parent market
- Accurate predictions about upcoming market trends and analysis and changes in consumer behavior
- Growth of the market industry across Europe, North America, APAC, South America, and Middle East and Africa
- Thorough market growth analysis of the market’s competitive landscape and detailed information about companies
- Comprehensive market analysis and report on the factors that will challenge the market research and growth of market companies
We can help! Our analysts can customize this market research report to meet your requirements.
 RIA -
RIA - 
