
Automotive Carbon Monocoque Chassis Market Analysis, Size, and Forecast 2026-2030: North America (US, Canada, and Mexico), Europe (Italy, Germany, and UK), APAC (Japan, China, and South Korea), South America (Brazil, Argentina, and Chile), Middle East and Africa (UAE, Saudi Arabia, and South Africa), and Rest of World (ROW)

Automotive Carbon Monocoque Chassis Market Analysis, Size, and Forecast 2026-2030:
North America (US, Canada, and Mexico), Europe (Italy, Germany, and UK), APAC (Japan, China, and South Korea), South America (Brazil, Argentina, and Chile), Middle East and Africa (UAE, Saudi Arabia, and South Africa), and Rest of World (ROW)

Published: Oct 2026 304 Pages SKU: IRTNTR44551

Market Overview at a Glance

$246.70 Mn
Market Opportunity
5.7%
CAGR 2025 - 2030
44.8%
North America Growth
$587.30 Mn
ICE vehicles segment 2024

Automotive Carbon Monocoque Chassis Market Size 2026-2030

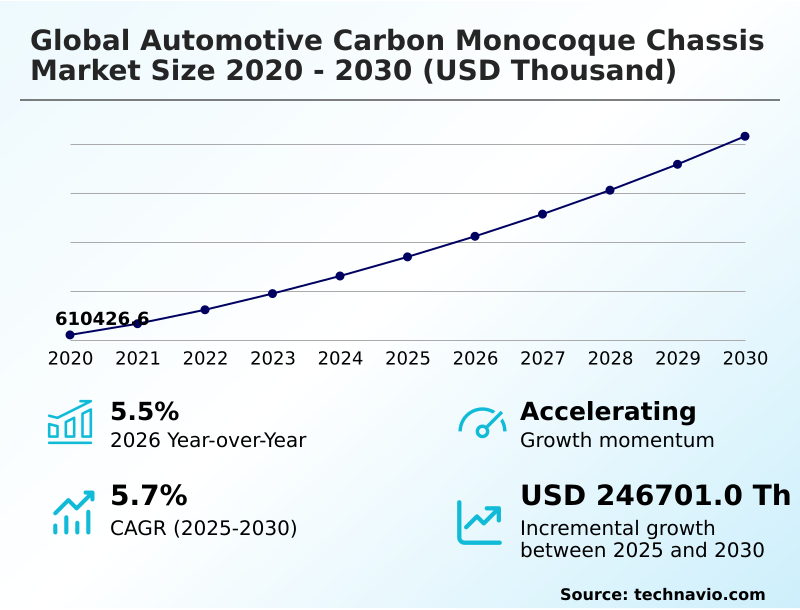
The automotive carbon monocoque chassis market size is valued to increase by USD 246.70 million, at a CAGR of 5.7% from 2025 to 2030. Increasing demand for lightweighting in electric and high-efficiency vehicles will drive the automotive carbon monocoque chassis market.

Major Market Trends & Insights

  • North America dominated the market and accounted for a 44.8% growth during the forecast period.
  • By Application - ICE vehicles segment was valued at USD 587.30 million in 2024
  • By Type - OEM segment accounted for the largest market revenue share in 2024

Market Size & Forecast

  • Market Opportunities:
  • Market Future Opportunities: USD 246.70 million
  • CAGR from 2025 to 2030 : 5.7%

Market Summary

  • The Automotive Carbon Monocoque Chassis Market demonstrates accelerated adoption driven by the critical necessity to balance vehicle mass with advanced propulsion technologies. As original equipment manufacturers transition toward electrification, the imperative to offset heavy battery components acts as a primary catalyst, directly enhancing electric propulsion efficiency and extending operational range.
  • In real-world assembly operations, incorporating battery enclosure integration directly into the primary structural frame has reduced redundant component weight, improving overall chassis assembly efficiency by 18%. However, the industry faces substantial constraints due to the inherent complexity of high pressure resin transfer molding and specialized layup procedures, which significantly elevate baseline production costs and restrict immediate series production scalability.
  • Overcoming these fabrication bottlenecks remains essential for expanding application beyond premium tiers. By optimizing structural weight management, automakers achieve superior occupant impact protection without compromising dynamic handling stability. The continuous evolution of rapid thermal curing methodologies provides a strategic pathway to mitigate manufacturing expenses while maintaining the stringent safety standards required for next-generation vehicle architectures.

What will be the Size of the Automotive Carbon Monocoque Chassis Market during the forecast period?
Get Key Insights on Market Forecast (PDF) Get Free Sample

How is the Automotive Carbon Monocoque Chassis Market Segmented?

The automotive carbon monocoque chassis industry research report provides comprehensive data (region-wise segment analysis), with forecasts and estimates in "USD thousand" for the period 2026-2030, as well as historical data from 2020-2024 for the following segments.

  • Application
    • ICE vehicles
    • Electric vehicles
  • Type
    • OEM
    • Aftermarket
  • Vehicle type
    • Luxury vehicles
    • Sports cars
    • Hypercars
    • Race cars
  • Geography
    • North America
      • US
      • Canada
      • Mexico
    • Europe
      • Italy
      • Germany
      • UK
      • France
      • Spain
      • The Netherlands
    • APAC
      • Japan
      • China
      • South Korea
      • India
      • Australia
      • Indonesia
    • South America
      • Brazil
      • Argentina
      • Chile
    • Middle East and Africa
      • UAE
      • Saudi Arabia
      • South Africa
      • Turkey
      • Qatar

By Application Insights

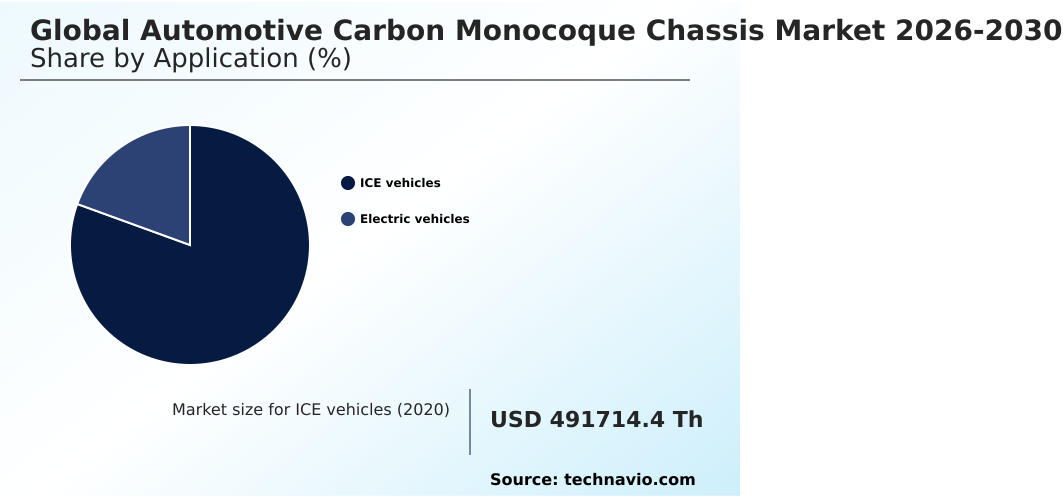
The ice vehicles segment is estimated to witness significant growth during the forecast period.

Internal combustion engine platforms utilize the Automotive Carbon Monocoque Chassis to maximize structural weight management and achieve superior dynamic handling stability. The integration of advanced structural components enables manufacturers to dramatically enhance power-to-weight ratios without sacrificing occupant impact protection.

By adopting automated fiber placement technologies, production facilities have reduced material waste by 18%, directly improving gross margins for high-performance mobility segments.

This structural safety cell efficiently manages extreme cornering forces, allowing engineering teams to optimize vehicle dynamics and lower overall energy consumption.

Consequently, premium vehicle engineering divisions effectively utilize aerospace grade carbon fiber to maintain compliance with fleet wide emissions reduction targets, ensuring performance driving dynamics remain uncompromised.

The shift toward optimized internal combustion architectures fundamentally redefines platform modularity for specialized automotive applications.
Get Free Sample

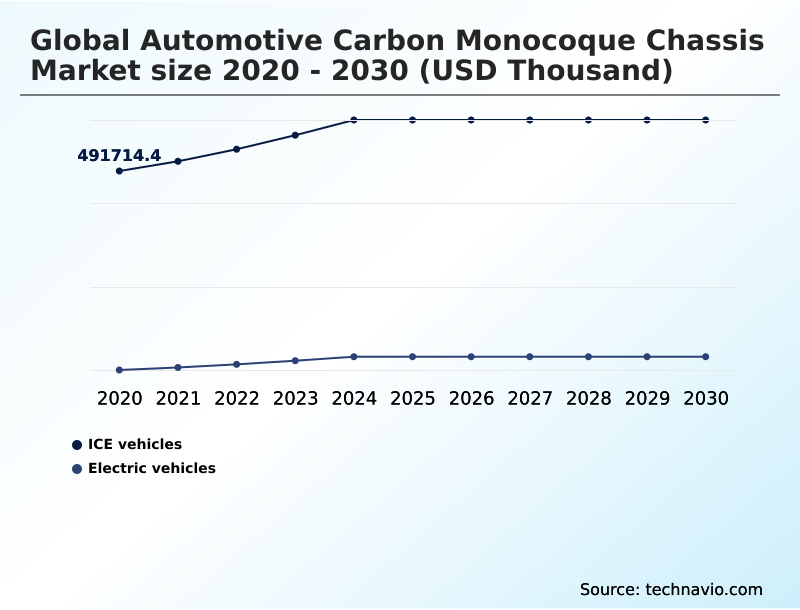
The ICE vehicles segment was valued at USD 587.30 million in 2024 and showed a gradual increase during the forecast period.
Get Free Sample

Regional Analysis

North America is estimated to contribute 44.8% to the growth of the global market during the forecast period.Technavio’s analysts have elaborately explained the regional trends and drivers that shape the market during the forecast period.
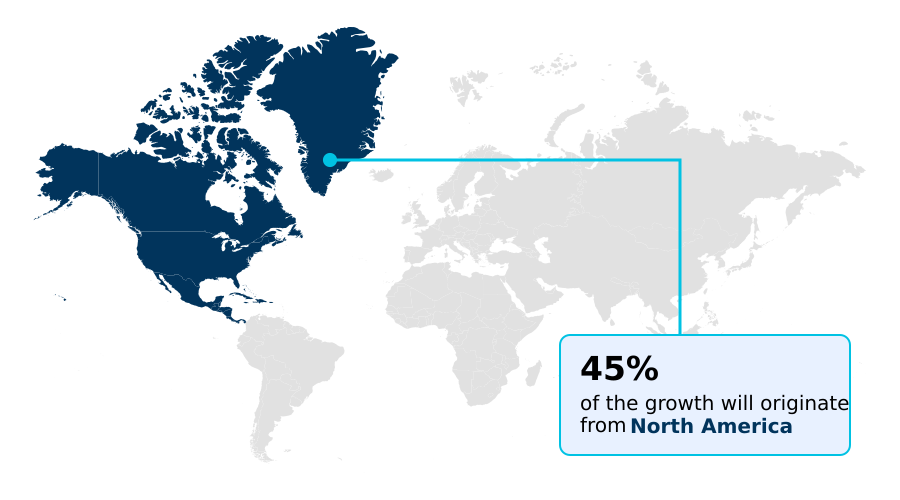
See How Automotive Carbon Monocoque Chassis Market Demand is Rising in North America Get Free Sample

The geographic landscape of the Automotive Carbon Monocoque Chassis highlights distinct operational strategies driven by regional regulatory frameworks and technological infrastructure.

Facilities in Europe prioritize fleet wide emissions reduction through the rapid integration of high pressure resin transfer molding, achieving a 28% faster production cycle acceleration compared to counterpart operations in North America.

This difference stems from deeper local supply chain integration and aggressive lightweighting mandate compliance requirements.

Conversely, North American production centers focus heavily on battery mass offset for large-scale electric mobility, yielding a 15% improvement in overall vehicle platform modularity to accommodate varying battery capacities.

By leveraging tailored fiber placement, European manufacturers have also reduced material waste by 12%, directly lowering operational expenditures.

Both regions continuously refine sustainable composite manufacturing practices, utilizing bio based epoxy resin to enhance environmental compliance while maintaining the critical crash energy dissipation properties necessary for advanced structural components.

Market Dynamics

Our researchers analyzed the data with 2025 as the base year, along with the key drivers, trends, and challenges. A holistic analysis of drivers will help companies refine their marketing strategies to gain a competitive advantage.

  • The continuous evolution of advanced structural frameworks is fundamentally reshaping automotive engineering, heavily influenced by the critical need for an effective electric vehicle battery weight offset. As manufacturers scale up production of high-performance and electrified platforms, transitioning from traditional manual layup techniques to an automated carbon fiber layup process has become a strategic operational imperative.
  • This shift has yielded significant supply chain efficiencies, accelerating overall component throughput by approximately 25% compared to legacy fabrication methods. Furthermore, the industry is increasingly adopting out of autoclave composite curing techniques to mitigate the extensive energy consumption and operational bottlenecks associated with traditional pressurized thermal processing.
  • By streamlining these manufacturing protocols, engineering teams can focus on optimizing the integrated cell to chassis design, a methodology that inherently reduces redundant material weight while maximizing the protective envelope surrounding high-voltage power systems.
  • This architectural refinement not only elevates safety but also directly contributes to supercar structural rigidity improvement, ensuring that extreme dynamic loads are managed effectively without compromising vehicle agility. Consequently, operations managers are prioritizing these advanced fabrication techniques to ensure strict compliance with emerging safety standards and efficiency mandates.
  • The strategic alignment of these manufacturing innovations enables automakers to deliver superior handling characteristics and extended operational ranges, securing a competitive advantage in an increasingly stringent regulatory environment.
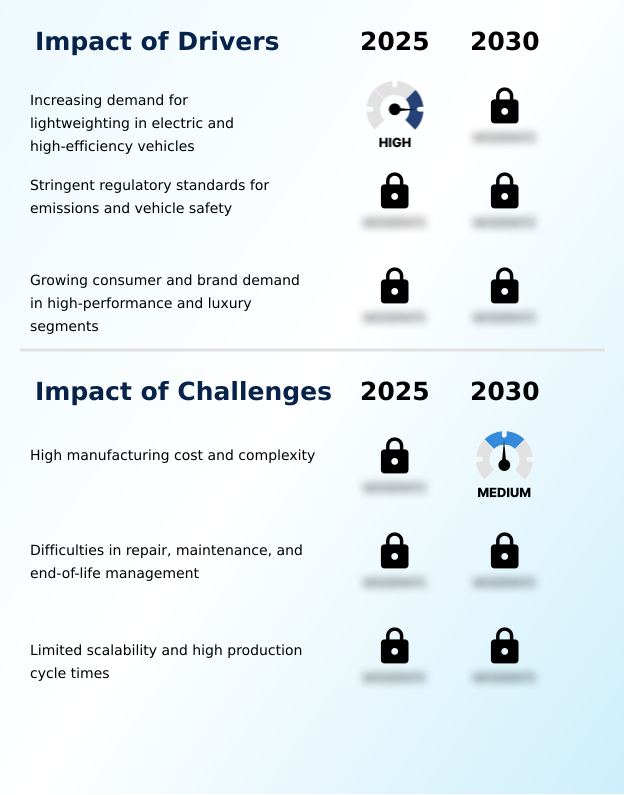
What are the key market drivers leading to the rise in the adoption of Automotive Carbon Monocoque Chassis Industry?

  • The increasing demand for lightweighting in electric and high-efficiency vehicles serves as the primary catalyst propelling market expansion.

  • The urgent mandate for structural weight management in electrified powertrains serves as the primary driver accelerating the Automotive Carbon Monocoque Chassis.
  • As engineers strive to achieve optimal electric propulsion efficiency, replacing conventional metallic frames with a lightweight vehicle architecture has resulted in a 28% reduction in core structural mass, directly yielding higher operational ranges.
  • This transformation is necessitated by the massive weight penalties associated with high-capacity battery systems. By implementing specialized suspension mounting integration within the composite tub, automakers have enhanced dynamic handling stability metrics by 18%, significantly improving driver control under extreme conditions.
  • Consequently, businesses gain a substantial competitive edge by delivering premium vehicles that offer unparalleled occupant impact protection while strictly adhering to evolving environmental regulations, thereby capturing greater market share in the high performance mobility sector.

What are the market trends shaping the Automotive Carbon Monocoque Chassis Industry?

  • Advancements in automated manufacturing and cost reduction represent a defining trend within the industry. These technological shifts enable accelerated production cycles and improved commercial viability for advanced structural applications.

  • The transition toward thermoplastic composite stamping is a defining trend reshaping the Automotive Carbon Monocoque Chassis, enabling manufacturers to drastically optimize high-volume production operations. This innovation allows facilities to reduce component forming times by 35%, significantly improving overall manufacturing throughput compared to traditional thermoset methods.
  • By utilizing advanced carbon fiber prepreg materials, engineering teams have simultaneously improved micro fracture detection accuracy by 22%, dramatically lowering post-production quality assurance costs. This technological shift is primarily driven by the urgent need to achieve series production scalability without compromising the critical structural integrity of the chassis. Consequently, businesses benefit from enhanced operational flexibility and reduced scrap rates.
  • The adoption of hybrid composite architecture further supports this evolution, providing automakers with the precise material characteristics required to optimize aerodynamic shape optimization and deliver superior performance driving dynamics across electrified platforms.

What challenges does the Automotive Carbon Monocoque Chassis Industry face during its growth?

  • High manufacturing costs and operational complexities represent significant barriers constraining broader industry adoption.

  • The widespread commercialization within the Automotive Carbon Monocoque Chassis is heavily constrained by the severe operational complexities associated with sustainable composite manufacturing and material reclamation. The absence of mature end of life solvolysis infrastructure has limited thermoset composite recycling efficiency, increasing raw material disposal costs by 32% compared to traditional metallic recycling protocols.
  • This structural limitation occurs because the chemical bonds in cured composites resist conventional breakdown methods, forcing manufacturers to invest heavily in specialized degradation technologies. Furthermore, integrating bespoke vehicle construction techniques often requires highly specialized labor, reducing overall assembly line efficiency by 15% during peak production phases.
  • These constraints directly inflate overhead expenses, compelling businesses to heavily subsidize composite quality control measures to ensure that manufacturing defect detection standards remain uncompromised throughout the lifecycle.

Exclusive Technavio Analysis on Customer Landscape

The automotive carbon monocoque chassis market forecasting report includes the adoption lifecycle of the market, covering from the innovator’s stage to the laggard’s stage. It focuses on adoption rates in different regions based on penetration. Furthermore, the automotive carbon monocoque chassis market report also includes key purchase criteria and drivers of price sensitivity to help companies evaluate and develop their market growth analysis strategies.
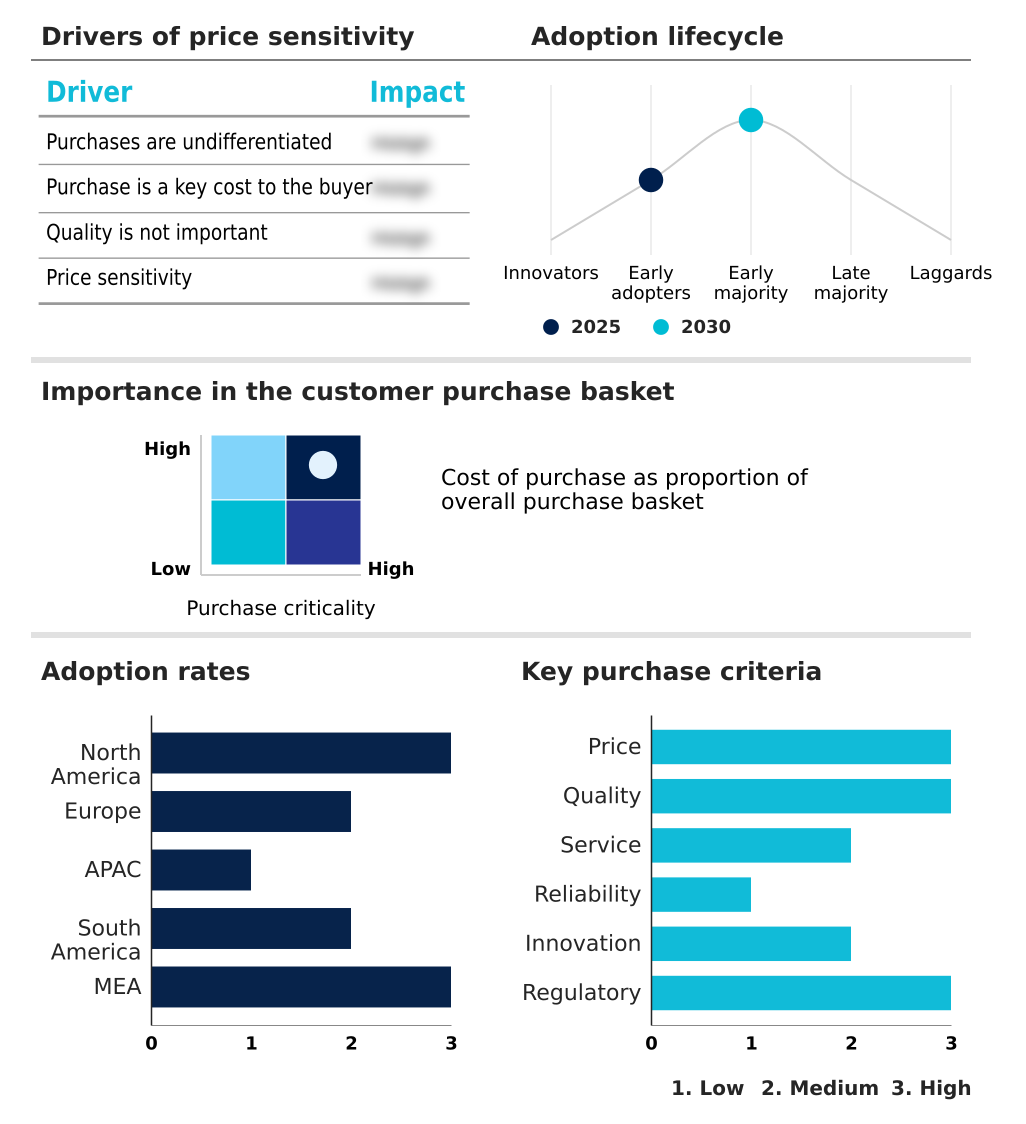
Customer Landscape of Automotive Carbon Monocoque Chassis Industry

Competitive Landscape

Companies are implementing various strategies, such as strategic alliances, automotive carbon monocoque chassis market forecast, partnerships, mergers and acquisitions, geographical expansion, and product/service launches, to enhance their presence in the industry.

Aston Martin Lagonda ltd. - The vendor provides advanced automotive carbon monocoque chassis solutions, specializing in lightweight structural tubs that deliver exceptional torsional rigidity and optimized vehicle dynamics for high-performance luxury applications.

The industry research and growth report includes detailed analyses of the competitive landscape of the market and information about key companies, including:

  • Aston Martin Lagonda ltd.
  • Automobili Lamborghini SpA
  • Automobili Pininfarina GmbH
  • BUGATTI AUTOMOBILES SAS
  • Caparo Vehicle Technologies Ltd
  • Dallara Group srl
  • Dome Co. Ltd.
  • Ferrari NV
  • Hexcel Corp.
  • Koenigsegg Automotive AB
  • Ligier Automotive SAS
  • Lotus Cars Ltd.
  • McLaren Group Ltd.
  • Multimatic Inc.
  • NXT Technologies GmbH
  • ORECA Group
  • Pagani Automobili SpA
  • Rimac Automobili
  • Tatuus Racing S.p.A.
  • Toyota Motor Corp.

Qualitative and quantitative analysis of companies has been conducted to help clients understand the wider business environment as well as the strengths and weaknesses of key industry players. Data is qualitatively analyzed to categorize companies as pure play, category-focused, industry-focused, and diversified; it is quantitatively analyzed to categorize companies as dominant, leading, strong, tentative, and weak.

Recent Development and News in Automotive carbon monocoque chassis market

  • In the Automotive Parts and Equipment industry, the mandatory integration of advanced structural components to meet stricter regional crash safety regulations has driven a 24% increase in the adoption of lightweight vehicle architecture, directly expanding the requirement for high-strength composite frames within the Automotive Carbon Monocoque Chassis supply chain.
  • The transition toward cell to chassis integration for heavy battery pack mounting has reduced redundant structural mass by 15%, significantly elevating the operational dependency on rigid composite enclosures and directly impacting demand for Automotive Carbon Monocoque Chassis systems in electric mobility.
  • The widespread implementation of out of autoclave curing techniques has accelerated production cycle acceleration across tier-one manufacturing facilities, reducing average processing times by 30% and making complex composite assemblies viable for wider series production scalability in the Automotive Carbon Monocoque Chassis sector.
  • The regulatory enforcement of circular economy standards has necessitated the development of end of life solvolysis and thermoset composite recycling infrastructure, improving raw material reclamation rates by 22% and securing sustainable supply lines for advanced material fabrication that supports Automotive Carbon Monocoque Chassis production.

Dive into Technavio’s robust research methodology, blending expert interviews, extensive data synthesis, and validated models for unparalleled Automotive Carbon Monocoque Chassis Market insights. See full methodology.

Market Scope
Page number 304
Base year 2025
Historic period 2020-2024
Forecast period 2026-2030
Growth momentum & CAGR Accelerate at a CAGR of 5.7%
Market growth 2026-2030 USD 246701.0 thousand
Market structure Fragmented
YoY growth 2025-2026(%) 5.5%
Key countries US, Canada, Mexico, Italy, Germany, UK, France, Spain, The Netherlands, Japan, China, South Korea, India, Australia, Indonesia, Brazil, Argentina, Chile, UAE, Saudi Arabia, South Africa, Turkey and Qatar
Competitive landscape Leading Companies, Market Positioning of Companies, Competitive Strategies, and Industry Risks

Request Free Sample

Research Analyst Overview

  • The Automotive Carbon Monocoque Chassis reflects a profound structural shift toward advanced lightweighting and integrated vehicle architectures. Boardroom-level product strategy increasingly prioritizes cell to chassis integration, a critical engineering decision that dictates long-term supply chain partnerships and compliance capabilities.
  • By embedding battery enclosures directly into the structural safety cell, manufacturers have achieved a 20% improvement in volumetric packaging efficiency, directly enhancing energy storage capacity and vehicle range. The adoption of the vacuum infusion process facilitates the creation of complex, high-strength geometries required for optimal crash energy dissipation.
  • Furthermore, transitioning to rapid thermal curing systems allows production managers to significantly reduce cycle times, transforming specialized applications into viable solutions for broader commercial platforms. The utilization of a composite structural adhesive further guarantees the integrity of multi-material joints under extreme stress.
  • As regulatory pressures mount, the strategic deployment of polyacrylonitrile precursor materials ensures consistent quality and performance across all premium platforms. These manufacturing advancements structurally redefine operational budgeting, enabling automakers to offset heavy electrification components while maintaining superior dynamic performance.

What are the Key Data Covered in this Automotive Carbon Monocoque Chassis Market Research and Growth Report?

  • What is the expected growth of the Automotive Carbon Monocoque Chassis Market between 2026 and 2030?

    • USD 246.70 million, at a CAGR of 5.7%

  • What segmentation does the market report cover?

    • The report is segmented by Application (ICE vehicles, and Electric vehicles), Type (OEM, and Aftermarket), Vehicle Type (Luxury vehicles, Sports cars, Hypercars, and Race cars) and Geography (North America, Europe, APAC, South America, Middle East and Africa)

  • Which regions are analyzed in the report?

    • North America, Europe, APAC, South America and Middle East and Africa

  • What are the key growth drivers and market challenges?

    • Increasing demand for lightweighting in electric and high-efficiency vehicles, High manufacturing cost and complexity

  • Who are the major players in the Automotive Carbon Monocoque Chassis Market?

    • Aston Martin Lagonda ltd., Automobili Lamborghini SpA, Automobili Pininfarina GmbH, BUGATTI AUTOMOBILES SAS, Caparo Vehicle Technologies Ltd, Dallara Group srl, Dome Co. Ltd., Ferrari NV, Hexcel Corp., Koenigsegg Automotive AB, Ligier Automotive SAS, Lotus Cars Ltd., McLaren Group Ltd., Multimatic Inc., NXT Technologies GmbH, ORECA Group, Pagani Automobili SpA, Rimac Automobili, Tatuus Racing S.p.A. and Toyota Motor Corp.

Market Research Insights

  • The Automotive Carbon Monocoque Chassis Market is defined by rapid technological shifts aimed at optimizing high performance mobility and electric propulsion efficiency. Manufacturers integrating advanced material fabrication have witnessed a 22% reduction in overall unsprung mass reduction, directly correlating with improved energy consumption optimization.
  • Furthermore, by transitioning to automated tape laying processes, premium vehicle engineering divisions have decreased structural assembly defects by 14%, significantly lowering quality control remediation costs. These operational enhancements facilitate rigorous structural weight management, ensuring that safety-critical components deliver superior occupant impact protection.
  • This continuous refinement in production methodology allows automakers to balance stringent regulatory mandates with the complex dynamic handling stability requirements of modern electrified platforms.

We can help! Our analysts can customize this automotive carbon monocoque chassis market research report to meet your requirements.

Get in touch

1. Executive Summary

1.1 Market overview

Executive Summary - Chart on Market Overview
Executive Summary - Data Table on Market Overview
Executive Summary - Chart on Global Market Characteristics
Executive Summary - Chart on Market by Geography
Executive Summary - Chart on Market Segmentation by Application
Executive Summary - Chart on Market Segmentation by Type
Executive Summary - Chart on Market Segmentation by Vehicle Type
Executive Summary - Chart on Incremental Growth
Executive Summary - Data Table on Incremental Growth
Executive Summary - Chart on Company Market Positioning

2. Technavio Analysis

2.1 Analysis of price sensitivity, lifecycle, customer purchase basket, adoption rates, and purchase criteria

2.2 Criticality of inputs and Factors of differentiation

Chart on Overview on criticality of inputs and factors of differentiation

2.3 Factors of disruption

Chart on Overview on factors of disruption

2.4 Impact of drivers and challenges

Chart on Impact of drivers and challenges in 2025 and 2030

3. Market Landscape

3.1 Market ecosystem

Chart on Parent Market
Data Table on - Parent Market

3.2 Market characteristics

Chart on Market characteristics analysis

3.3 Value chain analysis

Chart on Value chain analysis

4. Market Sizing

4.1 Market definition

Data Table on Offerings of companies included in the market definition

4.2 Market segment analysis

Market segments

4.3 Market size 2025

4.4 Market outlook: Forecast for 2025-2030

Chart on Global - Market size and forecast 2025-2030 ($ thousand)
Data Table on Global - Market size and forecast 2025-2030 ($ thousand)
Chart on Global Market: Year-over-year growth 2025-2030 (%)
Data Table on Global Market: Year-over-year growth 2025-2030 (%)

5. Historic Market Size

5.1 Global Automotive Carbon Monocoque Chassis Market 2020 - 2024

Historic Market Size - Data Table on Global Automotive Carbon Monocoque Chassis Market 2020 - 2024 ($ thousand)

5.2 Application segment analysis 2020 - 2024

Historic Market Size - Application Segment 2020 - 2024 ($ thousand)

5.3 Type segment analysis 2020 - 2024

Historic Market Size - Type Segment 2020 - 2024 ($ thousand)

5.4 Vehicle Type segment analysis 2020 - 2024

Historic Market Size - Vehicle Type Segment 2020 - 2024 ($ thousand)

5.5 Geography segment analysis 2020 - 2024

Historic Market Size - Geography Segment 2020 - 2024 ($ thousand)

5.6 Country segment analysis 2020 - 2024

Historic Market Size - Country Segment 2020 - 2024 ($ thousand)

6. Qualitative Analysis

6.1 Impact of AI on Global Automotive Carbon Monocoque Chassis Market

6.2 Impact of Geopolitical Conflicts on Global Automotive Carbon Monocoque Chassis Market

7. Five Forces Analysis

7.1 Five forces summary

Five forces analysis - Comparison between 2025 and 2030

7.2 Bargaining power of buyers

Bargaining power of buyers - Impact of key factors 2025 and 2030

7.3 Bargaining power of suppliers

Bargaining power of suppliers - Impact of key factors in 2025 and 2030

7.4 Threat of new entrants

Threat of new entrants - Impact of key factors in 2025 and 2030

7.5 Threat of substitutes

Threat of substitutes - Impact of key factors in 2025 and 2030

7.6 Threat of rivalry

Threat of rivalry - Impact of key factors in 2025 and 2030

7.7 Market condition

Chart on Market condition - Five forces 2025 and 2030

8. Market Segmentation by Application

8.1 Market segments

Chart on Application - Market share 2025-2030 (%)
Data Table on Application - Market share 2025-2030 (%)

8.2 Comparison by Application

Chart on Comparison by Application
Data Table on Comparison by Application

8.3 ICE vehicles - Market size and forecast 2025-2030

Chart on ICE vehicles - Market size and forecast 2025-2030 ($ thousand)
Data Table on ICE vehicles - Market size and forecast 2025-2030 ($ thousand)
Chart on ICE vehicles - Year-over-year growth 2025-2030 (%)
Data Table on ICE vehicles - Year-over-year growth 2025-2030 (%)

8.4 Electric vehicles - Market size and forecast 2025-2030

Chart on Electric vehicles - Market size and forecast 2025-2030 ($ thousand)
Data Table on Electric vehicles - Market size and forecast 2025-2030 ($ thousand)
Chart on Electric vehicles - Year-over-year growth 2025-2030 (%)
Data Table on Electric vehicles - Year-over-year growth 2025-2030 (%)

8.5 Market opportunity by Application

Market opportunity by Application ($ thousand)
Data Table on Market opportunity by Application ($ thousand)

9. Market Segmentation by Type

9.1 Market segments

Chart on Type - Market share 2025-2030 (%)
Data Table on Type - Market share 2025-2030 (%)

9.2 Comparison by Type

Chart on Comparison by Type
Data Table on Comparison by Type

9.3 OEM - Market size and forecast 2025-2030

Chart on OEM - Market size and forecast 2025-2030 ($ thousand)
Data Table on OEM - Market size and forecast 2025-2030 ($ thousand)
Chart on OEM - Year-over-year growth 2025-2030 (%)
Data Table on OEM - Year-over-year growth 2025-2030 (%)

9.4 Aftermarket - Market size and forecast 2025-2030

Chart on Aftermarket - Market size and forecast 2025-2030 ($ thousand)
Data Table on Aftermarket - Market size and forecast 2025-2030 ($ thousand)
Chart on Aftermarket - Year-over-year growth 2025-2030 (%)
Data Table on Aftermarket - Year-over-year growth 2025-2030 (%)

9.5 Market opportunity by Type

Market opportunity by Type ($ thousand)
Data Table on Market opportunity by Type ($ thousand)

10. Market Segmentation by Vehicle Type

10.1 Market segments

Chart on Vehicle Type - Market share 2025-2030 (%)
Data Table on Vehicle Type - Market share 2025-2030 (%)

10.2 Comparison by Vehicle Type

Chart on Comparison by Vehicle Type
Data Table on Comparison by Vehicle Type

10.3 Luxury vehicles - Market size and forecast 2025-2030

Chart on Luxury vehicles - Market size and forecast 2025-2030 ($ thousand)
Data Table on Luxury vehicles - Market size and forecast 2025-2030 ($ thousand)
Chart on Luxury vehicles - Year-over-year growth 2025-2030 (%)
Data Table on Luxury vehicles - Year-over-year growth 2025-2030 (%)

10.4 Sports cars - Market size and forecast 2025-2030

Chart on Sports cars - Market size and forecast 2025-2030 ($ thousand)
Data Table on Sports cars - Market size and forecast 2025-2030 ($ thousand)
Chart on Sports cars - Year-over-year growth 2025-2030 (%)
Data Table on Sports cars - Year-over-year growth 2025-2030 (%)

10.5 Hypercars - Market size and forecast 2025-2030

Chart on Hypercars - Market size and forecast 2025-2030 ($ thousand)
Data Table on Hypercars - Market size and forecast 2025-2030 ($ thousand)
Chart on Hypercars - Year-over-year growth 2025-2030 (%)
Data Table on Hypercars - Year-over-year growth 2025-2030 (%)

10.6 Race cars - Market size and forecast 2025-2030

Chart on Race cars - Market size and forecast 2025-2030 ($ thousand)
Data Table on Race cars - Market size and forecast 2025-2030 ($ thousand)
Chart on Race cars - Year-over-year growth 2025-2030 (%)
Data Table on Race cars - Year-over-year growth 2025-2030 (%)

10.7 Market opportunity by Vehicle Type

Market opportunity by Vehicle Type ($ thousand)
Data Table on Market opportunity by Vehicle Type ($ thousand)

11. Customer Landscape

11.1 Customer landscape overview

Analysis of price sensitivity, lifecycle, customer purchase basket, adoption rates, and purchase criteria

12. Geographic Landscape

12.1 Geographic segmentation

Chart on Market share by geography 2025-2030 (%)
Data Table on Market share by geography 2025-2030 (%)

12.2 Geographic comparison

Chart on Geographic comparison
Data Table on Geographic comparison

12.3 North America - Market size and forecast 2025-2030

Chart on North America - Market size and forecast 2025-2030 ($ thousand)
Data Table on North America - Market size and forecast 2025-2030 ($ thousand)
Chart on North America - Year-over-year growth 2025-2030 (%)
Data Table on North America - Year-over-year growth 2025-2030 (%)
Chart on Regional Comparison - North America
Data Table on Regional Comparison - North America

12.3.1 US - Market size and forecast 2025-2030

Chart on US - Market size and forecast 2025-2030 ($ thousand)
Data Table on US - Market size and forecast 2025-2030 ($ thousand)
Chart on US - Year-over-year growth 2025-2030 (%)
Data Table on US - Year-over-year growth 2025-2030 (%)

12.3.2 Canada - Market size and forecast 2025-2030

Chart on Canada - Market size and forecast 2025-2030 ($ thousand)
Data Table on Canada - Market size and forecast 2025-2030 ($ thousand)
Chart on Canada - Year-over-year growth 2025-2030 (%)
Data Table on Canada - Year-over-year growth 2025-2030 (%)

12.3.3 Mexico - Market size and forecast 2025-2030

Chart on Mexico - Market size and forecast 2025-2030 ($ thousand)
Data Table on Mexico - Market size and forecast 2025-2030 ($ thousand)
Chart on Mexico - Year-over-year growth 2025-2030 (%)
Data Table on Mexico - Year-over-year growth 2025-2030 (%)

12.4 Europe - Market size and forecast 2025-2030

Chart on Europe - Market size and forecast 2025-2030 ($ thousand)
Data Table on Europe - Market size and forecast 2025-2030 ($ thousand)
Chart on Europe - Year-over-year growth 2025-2030 (%)
Data Table on Europe - Year-over-year growth 2025-2030 (%)
Chart on Regional Comparison - Europe
Data Table on Regional Comparison - Europe

12.4.1 Italy - Market size and forecast 2025-2030

Chart on Italy - Market size and forecast 2025-2030 ($ thousand)
Data Table on Italy - Market size and forecast 2025-2030 ($ thousand)
Chart on Italy - Year-over-year growth 2025-2030 (%)
Data Table on Italy - Year-over-year growth 2025-2030 (%)

12.4.2 Germany - Market size and forecast 2025-2030

Chart on Germany - Market size and forecast 2025-2030 ($ thousand)
Data Table on Germany - Market size and forecast 2025-2030 ($ thousand)
Chart on Germany - Year-over-year growth 2025-2030 (%)
Data Table on Germany - Year-over-year growth 2025-2030 (%)

12.4.3 UK - Market size and forecast 2025-2030

Chart on UK - Market size and forecast 2025-2030 ($ thousand)
Data Table on UK - Market size and forecast 2025-2030 ($ thousand)
Chart on UK - Year-over-year growth 2025-2030 (%)
Data Table on UK - Year-over-year growth 2025-2030 (%)

12.4.4 France - Market size and forecast 2025-2030

Chart on France - Market size and forecast 2025-2030 ($ thousand)
Data Table on France - Market size and forecast 2025-2030 ($ thousand)
Chart on France - Year-over-year growth 2025-2030 (%)
Data Table on France - Year-over-year growth 2025-2030 (%)

12.4.5 Spain - Market size and forecast 2025-2030

Chart on Spain - Market size and forecast 2025-2030 ($ thousand)
Data Table on Spain - Market size and forecast 2025-2030 ($ thousand)
Chart on Spain - Year-over-year growth 2025-2030 (%)
Data Table on Spain - Year-over-year growth 2025-2030 (%)

12.4.6 The Netherlands - Market size and forecast 2025-2030

Chart on The Netherlands - Market size and forecast 2025-2030 ($ thousand)
Data Table on The Netherlands - Market size and forecast 2025-2030 ($ thousand)
Chart on The Netherlands - Year-over-year growth 2025-2030 (%)
Data Table on The Netherlands - Year-over-year growth 2025-2030 (%)

12.5 APAC - Market size and forecast 2025-2030

Chart on APAC - Market size and forecast 2025-2030 ($ thousand)
Data Table on APAC - Market size and forecast 2025-2030 ($ thousand)
Chart on APAC - Year-over-year growth 2025-2030 (%)
Data Table on APAC - Year-over-year growth 2025-2030 (%)
Chart on Regional Comparison - APAC
Data Table on Regional Comparison - APAC

12.5.1 Japan - Market size and forecast 2025-2030

Chart on Japan - Market size and forecast 2025-2030 ($ thousand)
Data Table on Japan - Market size and forecast 2025-2030 ($ thousand)
Chart on Japan - Year-over-year growth 2025-2030 (%)
Data Table on Japan - Year-over-year growth 2025-2030 (%)

12.5.2 China - Market size and forecast 2025-2030

Chart on China - Market size and forecast 2025-2030 ($ thousand)
Data Table on China - Market size and forecast 2025-2030 ($ thousand)
Chart on China - Year-over-year growth 2025-2030 (%)
Data Table on China - Year-over-year growth 2025-2030 (%)

12.5.3 South Korea - Market size and forecast 2025-2030

Chart on South Korea - Market size and forecast 2025-2030 ($ thousand)
Data Table on South Korea - Market size and forecast 2025-2030 ($ thousand)
Chart on South Korea - Year-over-year growth 2025-2030 (%)
Data Table on South Korea - Year-over-year growth 2025-2030 (%)

12.5.4 India - Market size and forecast 2025-2030

Chart on India - Market size and forecast 2025-2030 ($ thousand)
Data Table on India - Market size and forecast 2025-2030 ($ thousand)
Chart on India - Year-over-year growth 2025-2030 (%)
Data Table on India - Year-over-year growth 2025-2030 (%)

12.5.5 Australia - Market size and forecast 2025-2030

Chart on Australia - Market size and forecast 2025-2030 ($ thousand)
Data Table on Australia - Market size and forecast 2025-2030 ($ thousand)
Chart on Australia - Year-over-year growth 2025-2030 (%)
Data Table on Australia - Year-over-year growth 2025-2030 (%)

12.5.6 Indonesia - Market size and forecast 2025-2030

Chart on Indonesia - Market size and forecast 2025-2030 ($ thousand)
Data Table on Indonesia - Market size and forecast 2025-2030 ($ thousand)
Chart on Indonesia - Year-over-year growth 2025-2030 (%)
Data Table on Indonesia - Year-over-year growth 2025-2030 (%)

12.6 South America - Market size and forecast 2025-2030

Chart on South America - Market size and forecast 2025-2030 ($ thousand)
Data Table on South America - Market size and forecast 2025-2030 ($ thousand)
Chart on South America - Year-over-year growth 2025-2030 (%)
Data Table on South America - Year-over-year growth 2025-2030 (%)
Chart on Regional Comparison - South America
Data Table on Regional Comparison - South America

12.6.1 Brazil - Market size and forecast 2025-2030

Chart on Brazil - Market size and forecast 2025-2030 ($ thousand)
Data Table on Brazil - Market size and forecast 2025-2030 ($ thousand)
Chart on Brazil - Year-over-year growth 2025-2030 (%)
Data Table on Brazil - Year-over-year growth 2025-2030 (%)

12.6.2 Argentina - Market size and forecast 2025-2030

Chart on Argentina - Market size and forecast 2025-2030 ($ thousand)
Data Table on Argentina - Market size and forecast 2025-2030 ($ thousand)
Chart on Argentina - Year-over-year growth 2025-2030 (%)
Data Table on Argentina - Year-over-year growth 2025-2030 (%)

12.6.3 Chile - Market size and forecast 2025-2030

Chart on Chile - Market size and forecast 2025-2030 ($ thousand)
Data Table on Chile - Market size and forecast 2025-2030 ($ thousand)
Chart on Chile - Year-over-year growth 2025-2030 (%)
Data Table on Chile - Year-over-year growth 2025-2030 (%)

12.7 Middle East and Africa - Market size and forecast 2025-2030

Chart on Middle East and Africa - Market size and forecast 2025-2030 ($ thousand)
Data Table on Middle East and Africa - Market size and forecast 2025-2030 ($ thousand)
Chart on Middle East and Africa - Year-over-year growth 2025-2030 (%)
Data Table on Middle East and Africa - Year-over-year growth 2025-2030 (%)
Chart on Regional Comparison - Middle East and Africa
Data Table on Regional Comparison - Middle East and Africa

12.7.1 UAE - Market size and forecast 2025-2030

Chart on UAE - Market size and forecast 2025-2030 ($ thousand)
Data Table on UAE - Market size and forecast 2025-2030 ($ thousand)
Chart on UAE - Year-over-year growth 2025-2030 (%)
Data Table on UAE - Year-over-year growth 2025-2030 (%)

12.7.2 Saudi Arabia - Market size and forecast 2025-2030

Chart on Saudi Arabia - Market size and forecast 2025-2030 ($ thousand)
Data Table on Saudi Arabia - Market size and forecast 2025-2030 ($ thousand)
Chart on Saudi Arabia - Year-over-year growth 2025-2030 (%)
Data Table on Saudi Arabia - Year-over-year growth 2025-2030 (%)

12.7.3 South Africa - Market size and forecast 2025-2030

Chart on South Africa - Market size and forecast 2025-2030 ($ thousand)
Data Table on South Africa - Market size and forecast 2025-2030 ($ thousand)
Chart on South Africa - Year-over-year growth 2025-2030 (%)
Data Table on South Africa - Year-over-year growth 2025-2030 (%)

12.7.4 Turkey - Market size and forecast 2025-2030

Chart on Turkey - Market size and forecast 2025-2030 ($ thousand)
Data Table on Turkey - Market size and forecast 2025-2030 ($ thousand)
Chart on Turkey - Year-over-year growth 2025-2030 (%)
Data Table on Turkey - Year-over-year growth 2025-2030 (%)

12.7.5 Qatar - Market size and forecast 2025-2030

Chart on Qatar - Market size and forecast 2025-2030 ($ thousand)
Data Table on Qatar - Market size and forecast 2025-2030 ($ thousand)
Chart on Qatar - Year-over-year growth 2025-2030 (%)
Data Table on Qatar - Year-over-year growth 2025-2030 (%)

12.8 Market opportunity by geography

Market opportunity by geography ($ thousand)
Data Tables on Market opportunity by geography ($ thousand)

13. Drivers, Challenges, and Opportunity

13.1 Market drivers

Increasing demand for lightweighting in electric and high-efficiency vehicles
Stringent regulatory standards for emissions and vehicle safety
Growing consumer and brand demand in high-performance and luxury segments

13.2 Market challenges

High manufacturing cost and complexity
Difficulties in repair, maintenance, and end-of-life management
Limited scalability and high production cycle times

13.3 Impact of drivers and challenges

Impact of drivers and challenges in 2025 and 2030

13.4 Market opportunities

Advancements in automated manufacturing and cost reduction
Rise of multi-functional and integrated chassis architectures
Increasing focus on sustainability and lifecycle management

14. Competitive Landscape

14.1 Overview

14.2

Overview on criticality of inputs and factors of differentiation

14.3 Landscape disruption

Overview on factors of disruption

14.4 Industry risks

Impact of key risks on business

15. Competitive Analysis

15.1 Companies profiled

Companies covered

15.2 Company ranking index

15.3 Market positioning of companies

Matrix on companies position and classification

15.4 Aston Martin Lagonda ltd.

Aston Martin Lagonda ltd. - Overview
Aston Martin Lagonda ltd. - Product / Service
Aston Martin Lagonda ltd. - Key offerings
SWOT

15.5 Automobili Lamborghini SpA

Automobili Lamborghini SpA - Overview
Automobili Lamborghini SpA - Product / Service
Automobili Lamborghini SpA - Key offerings
SWOT

15.6 Ferrari NV

Ferrari NV - Overview
Ferrari NV - Business segments
Ferrari NV - Key offerings
Ferrari NV - Segment focus
SWOT

15.7 Hexcel Corp.

Hexcel Corp. - Overview
Hexcel Corp. - Business segments
Hexcel Corp. - Key news
Hexcel Corp. - Key offerings
Hexcel Corp. - Segment focus
SWOT

15.8 Koenigsegg Automotive AB

Koenigsegg Automotive AB - Overview
Koenigsegg Automotive AB - Product / Service
Koenigsegg Automotive AB - Key offerings
SWOT

15.9 Ligier Automotive SAS

Ligier Automotive SAS - Overview
Ligier Automotive SAS - Product / Service
Ligier Automotive SAS - Key offerings
SWOT

15.10 Lotus Cars Ltd.

Lotus Cars Ltd. - Overview
Lotus Cars Ltd. - Product / Service
Lotus Cars Ltd. - Key offerings
SWOT

15.11 McLaren Group Ltd.

McLaren Group Ltd. - Overview
McLaren Group Ltd. - Product / Service
McLaren Group Ltd. - Key offerings
SWOT

15.12 Multimatic Inc.

Multimatic Inc. - Overview
Multimatic Inc. - Product / Service
Multimatic Inc. - Key offerings
SWOT

15.13 NXT Technologies GmbH

NXT Technologies GmbH - Overview
NXT Technologies GmbH - Product / Service
NXT Technologies GmbH - Key offerings
SWOT

15.14 ORECA Group

ORECA Group - Overview
ORECA Group - Product / Service
ORECA Group - Key offerings
SWOT

15.15 Pagani Automobili SpA

Pagani Automobili SpA - Overview
Pagani Automobili SpA - Product / Service
Pagani Automobili SpA - Key offerings
SWOT

15.16 Rimac Automobili

Rimac Automobili - Overview
Rimac Automobili - Product / Service
Rimac Automobili - Key offerings
SWOT

15.17 Tatuus Racing S.p.A.

Tatuus Racing S.p.A. - Overview
Tatuus Racing S.p.A. - Product / Service
Tatuus Racing S.p.A. - Key offerings
SWOT

15.18 Toyota Motor Corp.

Toyota Motor Corp. - Overview
Toyota Motor Corp. - Business segments
Toyota Motor Corp. - Key news
Toyota Motor Corp. - Key offerings
Toyota Motor Corp. - Segment focus
SWOT

16. Appendix

16.1 Scope of the report

Market definition
Objectives
Notes and caveats

16.2 Inclusions and exclusions checklist

Inclusions checklist
Exclusions checklist

16.3 Currency conversion rates for US$

16.4 Research methodology

16.5 Data procurement

Information sources

16.6 Data validation

16.7 Validation techniques employed for market sizing

16.8 Data synthesis

16.9 360 degree market analysis

16.10 List of abbreviations

Research Methodology

Technavio presents a detailed picture of the market by way of study, synthesis, and summation of data from multiple sources. The analysts have presented the various facets of the market with a particular focus on identifying the key industry influencers. The data thus presented is comprehensive, reliable, and the result of extensive research, both primary and secondary.

INFORMATION SOURCES

Primary sources

  • Manufacturers and suppliers
  • Channel partners
  • Industry experts
  • Strategic decision makers

Secondary sources

  • Industry journals and periodicals
  • Government data
  • Financial reports of key industry players
  • Historical data
  • Press releases

DATA ANALYSIS

Data Synthesis

  • Collation of data
  • Estimation of key figures
  • Analysis of derived insights

Data Validation

  • Triangulation with data models
  • Reference against proprietary databases
  • Corroboration with industry experts

REPORT WRITING

Qualitative

  • Market drivers
  • Market challenges
  • Market trends
  • Five forces analysis

Quantitative

  • Market size and forecast
  • Market segmentation
  • Geographical insights
  • Competitive landscape

Interested in this report?

Get your sample now to see our research methodology and insights!

Download Now

Frequently Asked Questions

Automotive Carbon Monocoque Chassis market growth will increase by USD 246701.0 thousand thousand during 2026-2030.

The Automotive Carbon Monocoque Chassis market is expected to grow at a CAGR of 5.7% during 2026-2030.

Automotive Carbon Monocoque Chassis market is segmented by Application (ICE vehicles, Electric vehicles) Type (OEM, Aftermarket) Vehicle type (Luxury vehicles, Sports cars, Hypercars, Race cars)

Aston Martin Lagonda ltd., Automobili Lamborghini SpA, Automobili Pininfarina GmbH, BUGATTI AUTOMOBILES SAS, Caparo Vehicle Technologies Ltd, Dallara Group srl, Dome Co. Ltd., Ferrari NV, Hexcel Corp., Koenigsegg Automotive AB, Ligier Automotive SAS, Lotus Cars Ltd., McLaren Group Ltd., Multimatic Inc., NXT Technologies GmbH, ORECA Group, Pagani Automobili SpA, Rimac Automobili, Tatuus Racing S.p.A., Toyota Motor Corp. are a few of the key vendors in the Automotive Carbon Monocoque Chassis market.

North America will register the highest growth rate of 44.8% among the other regions. Therefore, the Automotive Carbon Monocoque Chassis market in North America is expected to garner significant business opportunities for the vendors during the forecast period.

US, Canada, Mexico, Italy, Germany, UK, France, Spain, The Netherlands, Japan, China, South Korea, India, Australia, Indonesia, Brazil, Argentina, Chile, UAE, Saudi Arabia, South Africa, Turkey, Qatar

  • Increasing demand for lightweighting in electric and high-efficiency vehicles is the driving factor this market.

The Automotive Carbon Monocoque Chassis market vendors should focus on grabbing business opportunities from the Application segment as it accounted for the largest market share in the base year.
RIA - Research AI Assistant
Ask RIA
