Automotive Tires E-Retailing Market Size 2025-2029
The automotive tires e-retailing market size is forecast to increase by USD 15.9 billion, at a CAGR of 16.7% between 2024 and 2029.
- The market is experiencing significant growth due to several key factors. One of the primary drivers is the increasing lifespan of passenger vehicles globally, leading to a higher demand for tire replacements. Another trend influencing the market is the rising adoption of Retail-as-a-Service (RaaS) and Recommendation-as-a-Service (RaaS) business models, which enable tire retailers to offer personalized recommendations to customers based on their vehicle data. Furthermore, the commercial vehicle segment is witnessing high demand for tire retreading, which is contributing to the growth of the e-retailing market. Overall, these trends are expected to continue driving market growth in the coming years. The market is expected to continue growing as the trend toward digital commerce in the automotive industry continues to gain momentum. The market is poised for significant expansion, as consumer preferences shift towards online purchasing and retailers leverage technology to offer personalized and convenient shopping experiences.
What will be the Size of the Automotive Tires E-Retailing Market During the Forecast Period?
- The market represents a significant segment of the broader automotive e-retailing industry, encompassing the online sale of tires for passenger vehicles, light commercial vehicles, and heavy commercial vehicles. This market is driven by several key trends, including the increasing popularity of online shopping and the integration of digital platforms into the automotive industry. Consumers are increasingly turning to e-commerce websites and self-service digital marketplaces to purchase tires, driven by the convenience and accessibility offered by these channels.
- Key product offerings within the market include radial tires, base tires, and high-performance tires. Advanced tire technologies, such as self-inflating technology and low rolling resistance, are also gaining traction in this market. The integration of smartphones and mobile applications into the tire purchasing process is further enhancing the customer experience. Automotive dealers and OEMs are increasingly leveraging e-commerce platforms to sell tires and other automotive parts and accessories online, with options for home delivery.
How is this Automotive Tires E-Retailing Industry segmented and which is the largest segment?
The automotive tires e-retailing industry research report provides comprehensive data (region-wise segment analysis), with forecasts and estimates in "USD billion" for the period 2025-2029, as well as historical data from 2019-2023 for the following segments.
- Type
- Radial tire
- Base tire
- Application
- Passenger cars
- Light commercial vehicles
- Heavy commercial vehicles
- Product Type
- All-season tires
- Summer tires
- Winter tires
- Others
- Geography
- North America
- Canada
- US
- Europe
- Germany
- UK
- France
- Italy
- APAC
- China
- India
- Japan
- South America
- Brazil
- Middle East and Africa
- North America
By Type Insights
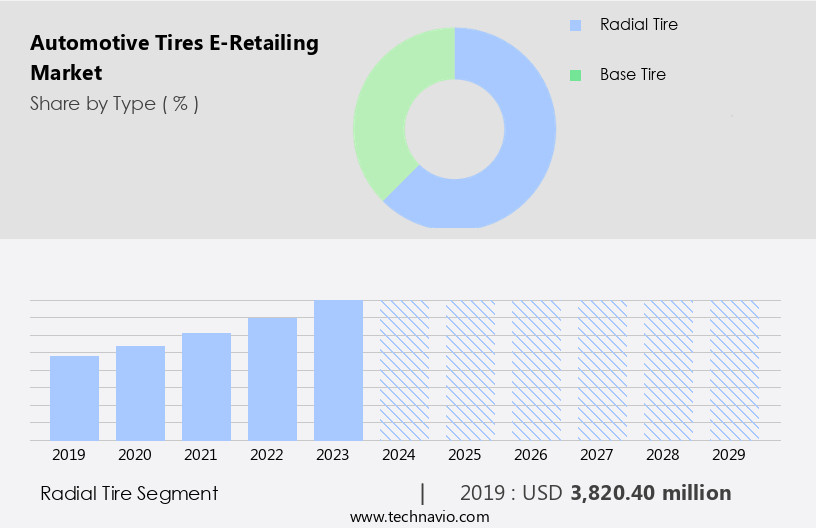
- The radial tire segment is estimated to witness significant growth during the forecast period. Radial tires, a modern automotive tire innovation, are recognized by their distinct construction, featuring steel belts that run perpendicular to the tread direction at a 90-degree angle. This design enables the sidewall and tread to function independently, leading to enhanced vehicle handling and tire durability. Radial tires deliver several advantages, including reduced rolling resistance for improved fuel efficiency, superior shock absorption for increased comfort, and extended tread life, resulting in a cost-effective solution over the tire's lifespan. Furthermore, radial tires provide better stability and traction under diverse road conditions, ensuring passenger and commercial vehicle safety. In the evolving automotive landscape, e-retailing channels have gained traction, allowing online shoppers to purchase tires conveniently from the comfort of their homes. Self-inflating technology, low rolling resistance, and fuel mileage are essential considerations for online tire purchases.
- Passenger cars, radial tires, and base tires are popular segments in the automotive e-retailing market. Online selling platforms cater to passenger vehicles, light commercial vehicles, and heavy commercial vehicles, offering dealers, OEM suppliers, third-party sellers, and e-commerce channels a significant opportunity to expand their customer base. Digital devices, internet-habituated customers, and home delivery add to the convenience of online shopping. However, online payment frauds and counterfeit auto parts pose challenges, necessitating data encryption and infotainment and multimedia features for a secure and authentic online shopping experience. Augmented Reality, virtual reality, and artificial intelligence enhance the online shopping experience for digital car sellers, traditional vehicle makers, and traditional retailers.
Get a glance at the market report of share of various segments Request Free Sample
The radial tire segment was valued at USD 3.82 billion in 2019 and showed a gradual increase during the forecast period.
Regional Analysis
- North America is estimated to contribute 39% to the growth of the global market during the forecast period. Technavio's analysts have elaborately explained the regional trends and drivers that shape the market during the forecast period.
For more insights on the market size of various regions, Request Free Sample
The market in North America is experiencing growth due to the increasing popularity of online shopping among consumers. Automobile manufacturers such as Ford, General Motors, and Tesla are embracing e-retailing channels to sell tires, including radial tires and base tires for passenger cars, light commercial vehicles, and heavy commercial vehicles. Self-inflating technology and low rolling resistance are key features driving demand for tires In the market. Smartphones and online shopping have become integral to consumers' lives, enabling them to conveniently purchase tires from the comfort of their homes. Fuel mileage is another factor influencing tire sales, as consumers seek to minimize fuel consumption and replacement costs.
Online shoppers prefer e-commerce platforms for their convenience, offering home delivery and payment convenience through digital devices. However, concerns over online payment frauds and counterfeit auto parts require e-retailing platforms to prioritize data encryption and ensure the authenticity of components. E-Retailing, traditional retailing, OEM companies, and third-party sellers are all active players in the automotive e-commerce market, offering a wide range of tires, accessories, and other automotive products. Augmented Reality, Virtual Reality, and Artificial Intelligence are enhancing the online shopping experience for digital car sellers, traditional vehicle makers, and consumers alike.
Market Dynamics
Our researchers analyzed the data with 2024 as the base year, along with the key drivers, trends, and challenges. A holistic analysis of drivers will help companies refine their marketing strategies to gain a competitive advantage.
What are the key market drivers leading to the rise in the adoption of Automotive Tires E-Retailing Industry?
- Rise in lifespan of passenger vehicles globally is the key driver of the market. The market is experiencing significant growth due to the increasing lifespan of various passenger vehicles, leading to a continuous demand for replacement tires. Online shopping is a prominent channel for customers to purchase tires in this market. The economic growth of emerging economies like Brazil, Russia, India, and China has fueled the growth of the auto industry, with many global vehicle manufacturers expanding their focus to these markets. Self-inflating technology and low rolling resistance are key trends in the market, catering to the demands for fuel mileage and environmental consciousness among consumers. Smartphones and online platforms have made the tire purchasing process more convenient, with features like home delivery, online payment convenience, and digital devices integration.
- The market comprises OEM suppliers, aftermarket suppliers, and third-party sellers, with e-commerce platforms, websites, and channels serving as the primary sales channels. The market is witnessing advancements in technology, including Augmented Reality, Virtual Reality, and Artificial Intelligence, enhancing the online shopping experience for customers. However, concerns over online payment frauds and counterfeit auto parts persist, necessitating data encryption and infotainment and multimedia features for customer assurance. The market encompasses a wide range of automotive products, including tires and wheels, interior accessories, electrical products, and various vehicle segments, such as passenger cars, light commercial vehicles, and heavy commercial vehicles.
What are the market trends shaping the Automotive Tires E-Retailing Industry?
- Increasing adoption of RTB is the upcoming market trend. The market is experiencing significant growth due to the increasing adoption of digital commerce by automobile manufacturers and vehicle owners. Online shopping for tires and wheels, interior accessories, electrical products, and other automotive components is becoming increasingly popular. E-retailing platforms offer convenience through home delivery, payment convenience using digital devices, and a superior online shopping experience with the use of technologies like Augmented Reality and Virtual Reality. Self-inflating technology, low rolling resistance, and ground compaction are key features that attract online shoppers to purchase tires online. Passenger cars and radial tires are the major segments driving the market growth.
- OEM companies, third-party companies, and dealers are leveraging e-commerce channels to sell their products, with passenger vehicles, light commercial vehicles, and heavy commercial vehicles being the primary focus. Online retailing through digital platforms is transforming the automotive industry, with traditional vehicle makers and traditional retailers adapting to the trend. However, concerns regarding online payment frauds and the availability of counterfeit auto parts and low-grade components necessitate data encryption and other security measures. The market dynamics of the Automotive E-Retailing Market include the increasing demand for cheaper automotive components, the growing number of vehicle owners, and the convenience offered by online selling.
What challenges does the Automotive Tires E-Retailing Industry face during its growth?
- High demand for tire retreading in the commercial vehicle segment is a key challenge affecting the industry growth. In the market, the passenger cars segment dominates online tire purchases due to the focus on supplying new tires to this segment, as commercial vehicles typically opt for retreading. Retreading, which involves creating a new tread for an old tire, is increasingly popular among fleet managers to reduce operating costs. The cost savings from retreading are significant, especially for the trucking industry, which faces escalating fuel and driver wage costs. Consequently, cost is the primary driver of retread tire sales. Online shopping, facilitated by smartphones and the convenience of home delivery, is increasingly preferred by vehicle owners for purchasing tires and other automotive components.
- The e-retailing channel offers payment convenience, access to a wider selection of products, and the ability to compare prices from various e-commerce platforms and third-party sellers. The digital commerce trend in the automotive industry is transforming the selling of tires and other automotive parts and accessories, with digital devices and the internet becoming essential tools for consumers. Online retailing, including e-commerce channels and websites, is becoming increasingly important for both OEM companies and aftermarket suppliers. However, concerns over online payment frauds necessitate strong security measures, such as data encryption and infotainment and multimedia features to enhance the online shopping experience.
Exclusive Customer Landscape
The automotive tires e-retailing market forecasting report includes the adoption lifecycle of the market, covering from the innovator's stage to the laggard's stage. It focuses on adoption rates in different regions based on penetration. Furthermore, the automotive tires e-retailing market report also includes key purchase criteria and drivers of price sensitivity to help companies evaluate and develop their market growth analysis strategies.
Customer Landscape
Key Companies & Market Insights
Companies are implementing various strategies, such as strategic alliances, automotive tires e-retailing market forecast, partnerships, mergers and acquisitions, geographical expansion, and product/service launches, to enhance their presence in the industry.
1A Auto Inc. - The company offers automotive tires e-retailing solutions such as expert customer service and a comprehensive library of how-to videos to assist customers with DIY repairs.
The industry research and growth report includes detailed analyses of the competitive landscape of the market and information about key companies, including:
- Advance Auto Parts Inc.
- Alibaba Group Holding Ltd.
- Amazon.com Inc.
- AutoZone Inc.
- CarParts.com Inc.
- Cummins Inc.
- Delticom AG
- DENSO Corp.
- eBay Inc.
- HELLA GmbH and Co. KGaA
- Icahn Automotive Group LLC
- JD.com Inc.
- LKQ Corp.
- Rakuten Group Inc.
- Robert Bosch GmbH
- RockAuto LLC
- The Goodyear Tire and Rubber Co.
- Walmart Inc.
Qualitative and quantitative analysis of companies has been conducted to help clients understand the wider business environment as well as the strengths and weaknesses of key industry players. Data is qualitatively analyzed to categorize companies as pure play, category-focused, industry-focused, and diversified; it is quantitatively analyzed to categorize companies as dominant, leading, strong, tentative, and weak.
Research Analyst Overview
The market has experienced significant growth in recent years, driven by the increasing prevalence of online shopping and the convenience it offers to consumers. This trend is particularly notable in the passenger cars and light commercial vehicles segments, where self-inflating technology and low rolling resistance tires have gained popularity. Online shopping has become a preferred choice for many consumers due to its convenience and accessibility. With the widespread use of smartphones and the internet, passenger vehicle owners can now easily research, compare, and purchase tires from the comfort of their own homes. This shift from traditional retailing to e-retailing has led to increased competition among e-commerce platforms, websites, and third-party sellers.
Further, the radial tire segment has been a significant contributor to the growth of the market. Radial tires offer better fuel mileage and ground compaction compared to base tires, making them a popular choice among vehicle owners. The convenience of home delivery and online payment options further adds to the appeal of e-retailing. However, the growth of the market is not without challenges. Online shoppers are increasingly concerned about payment security and the risk of online payment frauds. OEM suppliers and third-party sellers must ensure that their digital platforms are secure and offer reliable payment options to build trust with customers.
In addition, the rise of e-retailing has also led to an increase in the availability of cheaper automotive components and counterfeit auto parts. To mitigate this risk, e-commerce platforms and websites must implement data encryption and other security measures to ensure the authenticity and quality of the products sold. The automotive e-retailing market is also witnessing the adoption of advanced technologies such as augmented reality and virtual reality to enhance the online shopping experience. Digital car sellers are leveraging these technologies to offer customers a more interactive shopping experience. Traditional vehicle makers and traditional retailers are also adapting to the changing market dynamics by expanding their digital presence and offering e-retailing options.
|
Market Scope |
|
|
Report Coverage |
Details |
|
Page number |
223 |
|
Base year |
2024 |
|
Historic period |
2019-2023 |
|
Forecast period |
2025-2029 |
|
Growth momentum & CAGR |
Accelerate at a CAGR of 16.7% |
|
Market growth 2025-2029 |
USD 15.9 billion |
|
Market structure |
Fragmented |
|
YoY growth 2024-2025(%) |
15.4 |
|
Key countries |
US, China, Germany, Canada, UK, Brazil, France, Japan, Italy, and India |
|
Competitive landscape |
Leading Companies, Market Positioning of Companies, Competitive Strategies, and Industry Risks |
What are the Key Data Covered in this Automotive Tires E-Retailing Market Research and Growth Report?
- CAGR of the Automotive Tires E-Retailing industry during the forecast period
- Detailed information on factors that will drive the market growth and forecasting between 2025 and 2029
- Precise estimation of the size of the market and its contribution of the industry in focus to the parent market
- Accurate predictions about upcoming growth and trends and changes in consumer behaviour
- Growth of the market across North America, Europe, APAC, South America, and Middle East and Africa
- Thorough analysis of the market's competitive landscape and detailed information about companies
- Comprehensive analysis of factors that will challenge the automotive tires e-retailing market growth of industry companies
We can help! Our analysts can customize this automotive tires e-retailing market research report to meet your requirements.


