
Bactericide Market Analysis, Size, and Forecast 2026-2030: APAC (China, India, and Japan), Europe (France, Spain, and Italy), North America (US, Canada, and Mexico), South America (Brazil, Argentina, and Chile), Middle East and Africa (South Africa, Egypt, and Saudi Arabia), and Rest of World (ROW)

Bactericide Market Analysis, Size, and Forecast 2026-2030:
APAC (China, India, and Japan), Europe (France, Spain, and Italy), North America (US, Canada, and Mexico), South America (Brazil, Argentina, and Chile), Middle East and Africa (South Africa, Egypt, and Saudi Arabia), and Rest of World (ROW)

Published: Oct 2026 300 Pages SKU: IRTNTR75044

Market Overview at a Glance

$2.09 B
Market Opportunity
4.8%
CAGR 2025 - 2030
43.4%
APAC Growth
$6.62 B
Soil treatment segment 2024

Bactericide Market Size 2026-2030

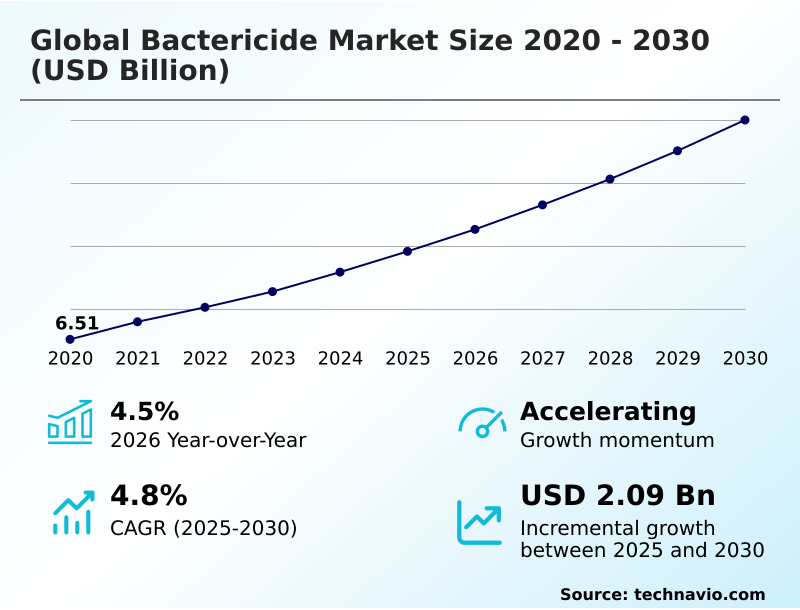
The bactericide market size is valued to increase by USD 2.09 billion, at a CAGR of 4.8% from 2025 to 2030. Increasing global population and escalating food demand will drive the bactericide market.

Major Market Trends & Insights

  • APAC dominated the market and accounted for a 43.4% growth during the forecast period.
  • By Application - Soil treatment segment was valued at USD 6.62 billion in 2024
  • By Type - Dry segment accounted for the largest market revenue share in 2024

Market Size & Forecast

  • Market Opportunities: USD 3.48 billion
  • Market Future Opportunities: USD 2.09 billion
  • CAGR from 2025 to 2030 : 4.8%

Market Summary

  • The Bactericide Market operates as a critical component of commercial agriculture, providing essential chemical and biological interventions to suppress destructive crop diseases. Agricultural enterprises increasingly rely on these targeted formulations to secure harvest yields and maintain supply chain stability.
  • In commercial orchards, the integration of precision spray equipment with advanced liquid suspensions has reduced active ingredient run-off by 25%, significantly improving environmental compliance metrics. A primary driver of this demand is the rising incidence of bacterial infections exacerbated by shifting climatic patterns, which forces growers to adopt rigorous preventive disease management programs to avoid catastrophic crop failures.
  • Conversely, the market faces significant headwinds due to stringent regulatory frameworks that mandate extensive toxicological testing, substantially escalating product development costs and delaying the introduction of novel chemical molecules. The transition toward bio-based alternatives actively reshapes manufacturer portfolios as companies strive to align with international clean label standards.
  • Ultimately, the continuous evolution of bacterial resistance necessitates ongoing innovation in active ingredient formulations to ensure long-term agricultural resilience.

What will be the Size of the Bactericide Market during the forecast period?
Get Key Insights on Market Forecast (PDF) Get Free Sample

How is the Bactericide Market Segmented?

The bactericide industry research report provides comprehensive data (region-wise segment analysis), with forecasts and estimates in "USD million" for the period 2026-2030, as well as historical data from 2020-2024 for the following segments.

  • Application
    • Soil treatment
    • Foliar spray
  • Type
    • Dry
    • Liquid
  • Product type
    • Copper-based
    • Dithiocarbamate
    • Amide
    • Antibiotic
    • Others
  • Geography
    • APAC
      • China
      • India
      • Japan
      • Australia
      • Indonesia
      • South Korea
    • Europe
      • France
      • Spain
      • Italy
      • Germany
      • UK
      • The Netherlands
    • North America
      • US
      • Canada
      • Mexico
    • South America
      • Brazil
      • Argentina
      • Chile
    • Middle East and Africa
      • South Africa
      • Egypt
      • Saudi Arabia
      • UAE
      • Turkey

By Application Insights

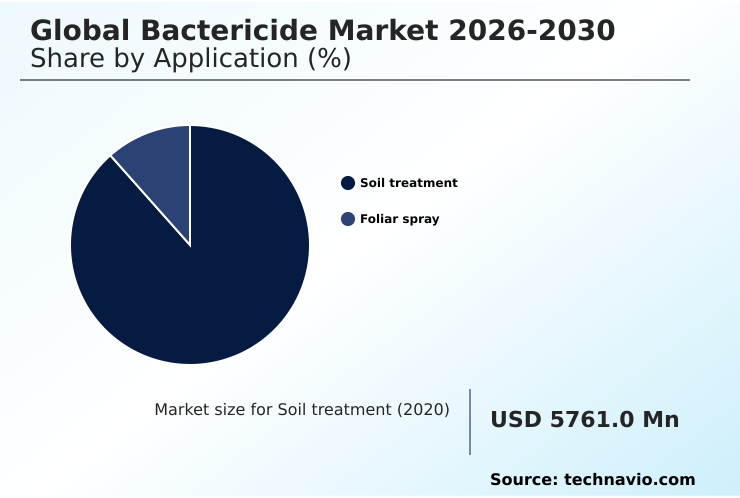
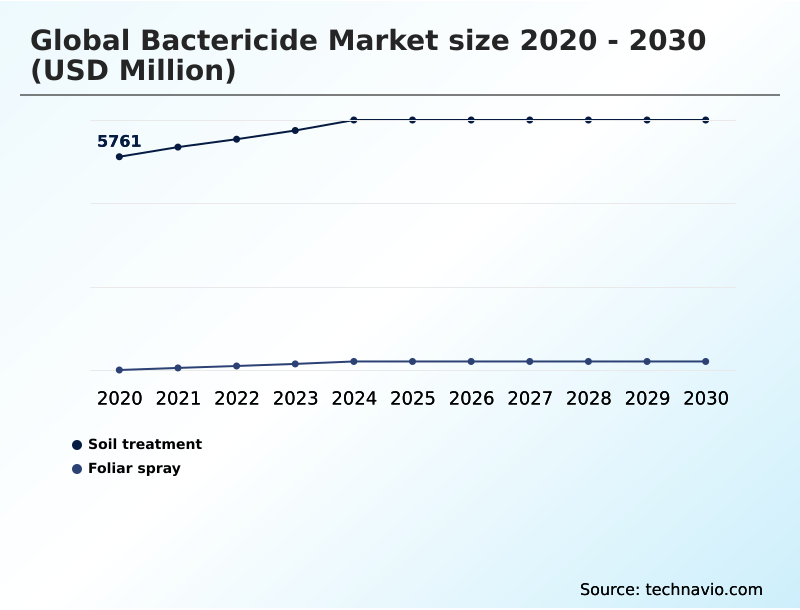
The soil treatment segment is estimated to witness significant growth during the forecast period.

The application of soil treatments provides essential soil-borne pathogen control to protect emerging seedlings from aggressive vascular wilt and decay.

By utilizing microbial inoculants and bio-based soil inoculants, commercial growers establish protective barriers around the root zone prior to critical planting intervals.

This preventive sanitization directly enhances rhizosphere tissue protection, leading to crop yield retention rates improving by up to 18% in high-density vegetable operations.

As regulatory bodies enforce strict export maximum residue limits and mandate zero-chemical-residue restrictions, agricultural enterprises rapidly shift away from synthetic drenches toward sustainable farming frameworks.

Advanced copper hydroxide formulations are increasingly engineered to minimize heavy metal leaching, ensuring robust soil biodiversity preservation. Consequently, adhering to organic production standards empowers farm managers to maintain optimal subterranean plant health while complying with stringent international trade requirements.
Get Free Sample

The Soil treatment segment was valued at USD 6.62 billion in 2024 and showed a gradual increase during the forecast period.
Get Free Sample

Regional Analysis

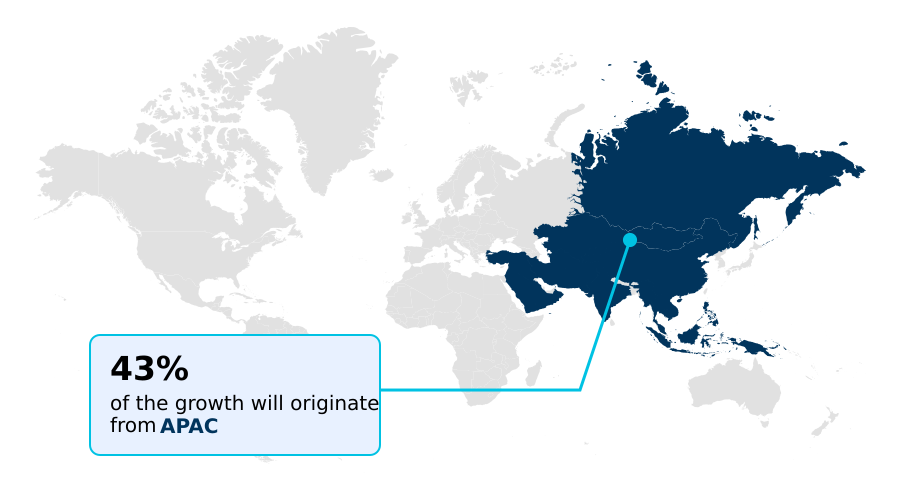
APAC is estimated to contribute 43.4% to the growth of the global market during the forecast period.Technavio’s analysts have elaborately explained the regional trends and drivers that shape the market during the forecast period.
See How Bactericide Market Demand is Rising in APAC Get Free Sample

The regional dynamics of the Bactericide sector reveal stark contrasts in application strategies, particularly between APAC and Europe.

In APAC, intense tropical pathogen pressure drives a 35% higher volume usage of broad-spectrum dithiocarbamate complexes aimed at rapid bacterial blight suppression across staple grain production.

Conversely, European growers, constrained by severe chemical limitations, exhibit a 40% greater adoption rate of targeted delivery systems and systemic active ingredients integrated into complex disease forecasting models.

This regulatory divergence forces European operations to rely on precision agriculture sensors and automated micro-irrigation systems to maintain compliance, enhancing targeted chemical delivery efficiency by 25%.

Meanwhile, rising regional residue-free produce demand pushes extensive greenhouse horticulture systems to adopt rigorous integrated pest management protocols.

As businesses adapt, formulation manufacturers strategically reallocate their supply chains to provide specialized, low-toxicity solutions tailored to distinct regional regulatory and environmental realities.

Market Dynamics

Our researchers analyzed the data with 2025 as the base year, along with the key drivers, trends, and challenges. A holistic analysis of drivers will help companies refine their marketing strategies to gain a competitive advantage.

  • The continuous evolution of agricultural disease management requires highly adaptive strategies to secure commercial yields against aggressive bacterial pathogens. Modern farming enterprises increasingly deploy advanced solutions for the systemic suppression of fire blight, ensuring vulnerable orchard canopies remain protected during critical growth stages.
  • By optimizing automated drip chemigation network integration, farm operators can deliver active compounds directly to the root zone, achieving a 22% improvement in operational application efficiency compared to traditional overhead broadcasting methods. This targeted approach directly supports compliance protocols and minimizes chemical waste across the supply chain.
  • Furthermore, the industry is witnessing a strategic shift toward microbial plant interaction disease control, utilizing beneficial biological agents to outcompete harmful bacteria and stimulate endogenous plant defense mechanisms. While organic segments expand, conventional agriculture continues to rely heavily on refined copper based agricultural chemical formulations, which serve as highly stable, multi-site contact barriers against diverse foliar infections.
  • To mitigate resistance risks, agribusinesses incorporate these metallic inputs into comprehensive broad spectrum crop protection programs. This multi-layered operational planning allows growers to balance immediate curative interventions with long-term soil health sustainability, ultimately reducing harvest rejection rates by up to 18% and optimizing overall resource allocation across regional distribution channels.
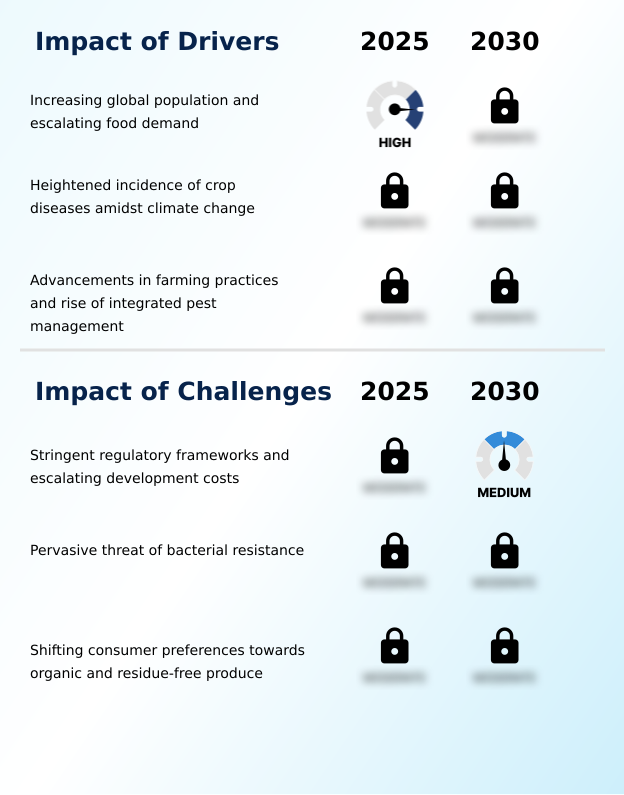
What are the key market drivers leading to the rise in the adoption of Bactericide Industry?

  • The continuous expansion of the global population and the resulting escalation in food demand serve as primary drivers propelling intensive agricultural crop protection initiatives.

  • The escalating severity of environmental stressors and subsequent extreme weather crop vulnerability act as primary catalysts for intensified disease control interventions.
  • Because volatile climatic conditions accelerate pathogen reproduction, commercial specialty crop production facilities face elevated risks of devastating infections, compelling the rapid adoption of advanced bio-bactericide formulations.
  • This shift toward robust bacterial spot prevention protocols utilizes precision agriculture sensors to detect early-stage infections, effectively reducing untreated crop loss incidents by 24%.
  • To align with stringent clean label food requirements, farm managers integrate highly effective systemic active ingredients within comprehensive integrated pest management frameworks.
  • Supported by localized agricultural extension services, these sustainable farming frameworks optimize chemical loading and improve overall harvest recovery rates by up to 18%, securing vital supply chain stability and protecting enterprise revenue margins.

What are the market trends shaping the Bactericide Industry?

  • The ascendancy of biological and bio-based disease control agents represents a defining trend driving sustainable agricultural disease management.

  • The rapid transition toward precision disease management characterizes the current evolution of the Bactericide sector. Because widespread agricultural pathogen evolution diminishes the efficacy of traditional multi-site contact barriers, chemical formulators are heavily investing in novel molecules that initiate cellular signaling disruption within target bacteria.
  • This technological shift enables targeted variable-rate application, which has improved overall chemical utilization efficiency by 28% across mechanized farming operations. Furthermore, the integration of advanced surfactants enhances foliar canopy penetration, ensuring that active ingredients reach internal vascular tissues more effectively.
  • Driven by the need to optimize resource allocation, the adoption of drone-based aerial application facilitates superior foliar application optimization, reducing mechanical crop damage by up to 15%. Consequently, agricultural enterprises incorporate these innovations into strict resistance management programs alongside emerging biological control agents.
  • These elevated crop hygiene protocols allow growers to sustain high-yield production and revitalize post-patent crop protection strategies without violating modern environmental mandates.

What challenges does the Bactericide Industry face during its growth?

  • Stringent regulatory frameworks and the subsequent escalation of product development costs present significant operational challenges for manufacturers seeking active ingredient registration.

  • Stringent environmental regulations and the relentless acceleration of agricultural pathogen evolution present formidable structural bottlenecks for chemical manufacturers. As regulatory bodies mandate aggressive environmental persistence reduction, the formulation of traditional multi-site contact barriers faces severe volume restrictions, elevating compliance overhead by up to 30%.
  • This regulatory pressure forces companies to engineer complex chelated copper formulations and sophisticated controlled-release micro-granules to minimize soil toxicity. However, achieving optimal active ingredient stability within these advanced matrices significantly inflates manufacturing costs. Furthermore, developing novel compounds capable of cellular signaling disruption requires immense capital, often delaying market entry by several years.
  • Consequently, achieving consistent foliar canopy penetration with newly approved water-dispersible granules and specialized targeted delivery systems remains technologically challenging, reducing early-stage application efficiency by 12% as end-users adapt to novel handling protocols.

Exclusive Technavio Analysis on Customer Landscape

The bactericide market forecasting report includes the adoption lifecycle of the market, covering from the innovator’s stage to the laggard’s stage. It focuses on adoption rates in different regions based on penetration. Furthermore, the bactericide market report also includes key purchase criteria and drivers of price sensitivity to help companies evaluate and develop their market growth analysis strategies.
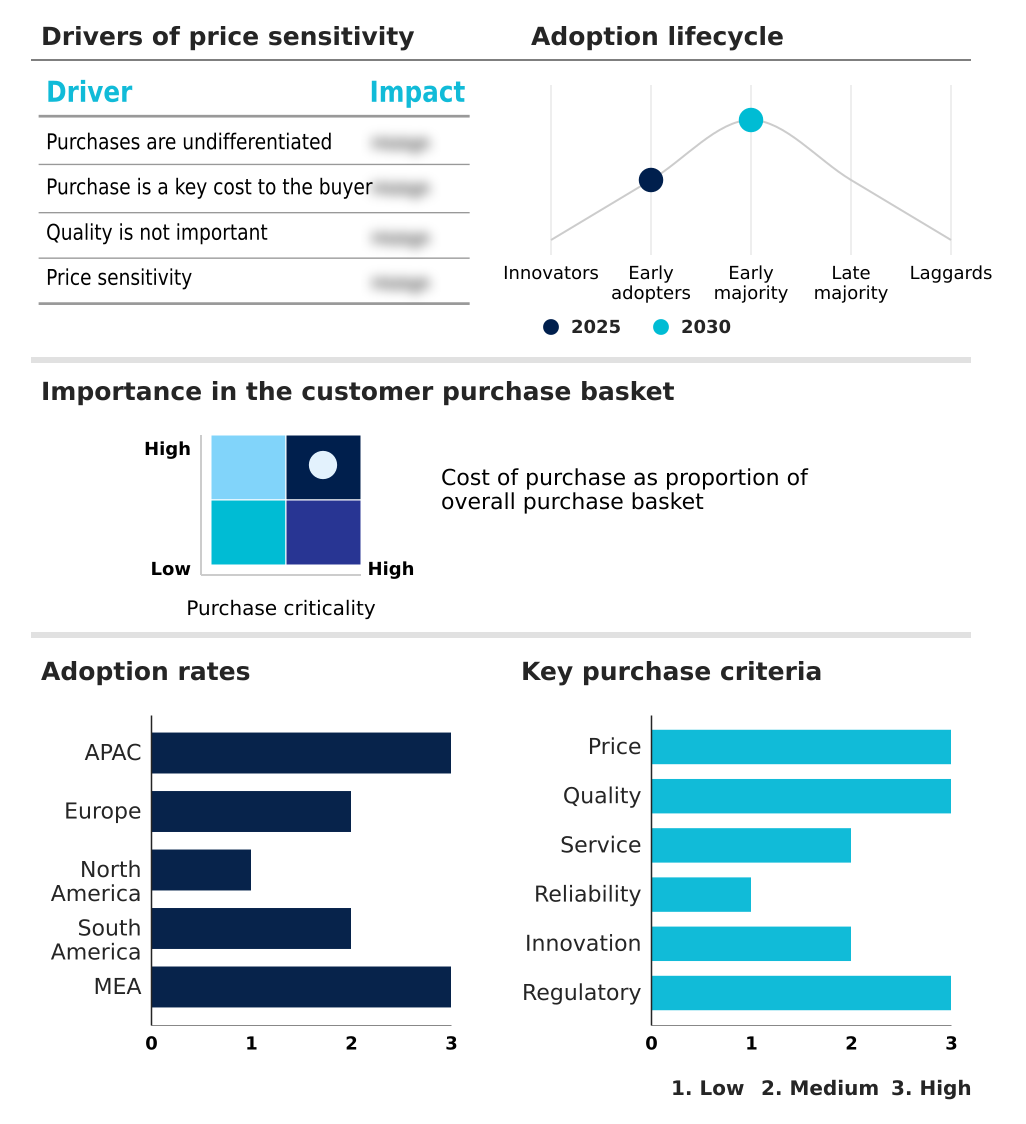
Customer Landscape of Bactericide Industry

Competitive Landscape

Companies are implementing various strategies, such as strategic alliances, bactericide market forecast, partnerships, mergers and acquisitions, geographical expansion, and product/service launches, to enhance their presence in the industry.

ADAMA Ltd. - Provides broad-spectrum crop protection solutions, delivering advanced copper and synthetic chemical formulations designed to suppress bacterial infections and optimize agricultural yields across diverse cultivation environments.

The industry research and growth report includes detailed analyses of the competitive landscape of the market and information about key companies, including:

  • ADAMA Ltd.
  • Albaugh LLC
  • AMVAC Chemical Corp.
  • Arxada AG
  • BASF SE
  • Bayer AG
  • Biostadt India Ltd.
  • Buckman Laboratories
  • Corteva Inc.
  • Dhanuka Agritech Ltd.
  • Ecolab Inc.
  • FMC Corp.
  • Gowan Co.
  • Koppert
  • KUMIAI CHEMICAL INDUSTRY CO.
  • Lanxess AG
  • Nippon Soda Co. Ltd.
  • Nufarm Ltd.
  • Sumitomo Chemical Co. Ltd.
  • UPL Ltd.

Qualitative and quantitative analysis of companies has been conducted to help clients understand the wider business environment as well as the strengths and weaknesses of key industry players. Data is qualitatively analyzed to categorize companies as pure play, category-focused, industry-focused, and diversified; it is quantitatively analyzed to categorize companies as dominant, leading, strong, tentative, and weak.

Recent Development and News in Bactericide market

  • In the Fertilizers and Agricultural Chemicals industry, the widespread integration of automated micro-irrigation systems and precision spray technologies optimized nutrient and chemical delivery across commercial specialty crop production, directly impacting Bactericide demand by increasing the requirement for highly soluble liquid formulations that prevent nozzle clogging while improving application efficiency by 22%.
  • The regulatory push for environmental persistence reduction and sustainable crop management under stringent environmental safety frameworks compelled manufacturers to accelerate the development of biological control agents, altering Bactericide supply dynamics by shifting 30% of new product pipelines toward bio-based active ingredients.
  • The escalation of clean label food requirements and rising consumer residue-free produce demand forced major food retailers to implement strict chemical tracing protocols, significantly influencing Bactericide market positioning as growers transitioned to low-toxicity targeted delivery systems that reduced harvest chemical loads by up to 40%.
  • Advancements in disease forecasting models and the deployment of drone-based aerial application across large-scale farming enterprises enhanced proactive crop hygiene protocols, pulling Bactericide demand forward by allowing farm managers to execute precise, variable-rate treatments that cut overall chemical waste by 15% during peak infection windows.

Dive into Technavio’s robust research methodology, blending expert interviews, extensive data synthesis, and validated models for unparalleled Bactericide Market insights. See full methodology.

Market Scope
Page number 300
Base year 2025
Historic period 2020-2024
Forecast period 2026-2030
Growth momentum & CAGR Accelerate at a CAGR of 4.8%
Market growth 2026-2030 USD 2090.4 million
Market structure Fragmented
YoY growth 2025-2026(%) 4.5%
Key countries China, India, Japan, Australia, Indonesia, South Korea, France, Spain, Italy, Germany, UK, The Netherlands, US, Canada, Mexico, Brazil, Argentina, Chile, South Africa, Egypt, Saudi Arabia, UAE and Turkey
Competitive landscape Leading Companies, Market Positioning of Companies, Competitive Strategies, and Industry Risks

Request Free Sample

Research Analyst Overview

  • The Bactericide ecosystem demonstrates continuous technological refinement as commercial agriculture adapts to shifting climatic pressures and stringent residue regulations. Formulators are accelerating the commercialization of bio-bactericide formulations and sophisticated plant defense activators to construct sustainable, low-toxicity disease management architectures.
  • The strategic integration of agricultural drone spraying mechanisms has allowed large-scale farming enterprises to achieve a 25% reduction in overall application time, significantly enhancing operational agility during critical infection windows. To optimize vascular wilt management and ensure robust bacterial spot prevention, agribusinesses are deploying advanced controlled-release micro-granules that provide sustained active ingredient delivery without severe environmental leaching.
  • Simultaneously, the refinement of chelated copper formulations and novel synthetic heterocyclic carboxamides delivers powerful systemic interventions while minimizing heavy metal accumulation in delicate soil microbiomes. These continuous product architecture upgrades directly support boardroom-level compliance and budget optimization strategies by maximizing harvest yields and preventing catastrophic crop losses.
  • Ultimately, aligning chemical efficacy with precision delivery systems remains paramount for maintaining long-term agricultural productivity and international trade viability.

What are the Key Data Covered in this Bactericide Market Research and Growth Report?

  • What is the expected growth of the Bactericide Market between 2026 and 2030?

    • USD 2.09 billion, at a CAGR of 4.8%

  • What segmentation does the market report cover?

    • The report is segmented by Application (Soil treatment, and Foliar spray), Type (Dry, and Liquid), Product Type (Copper-based, Dithiocarbamate, Amide, Antibiotic, and Others) and Geography (APAC, Europe, North America, South America, Middle East and Africa)

  • Which regions are analyzed in the report?

    • APAC, Europe, North America, South America and Middle East and Africa

  • What are the key growth drivers and market challenges?

    • Increasing global population and escalating food demand, Stringent regulatory frameworks and escalating development costs

  • Who are the major players in the Bactericide Market?

    • ADAMA Ltd., Albaugh LLC, AMVAC Chemical Corp., Arxada AG, BASF SE, Bayer AG, Biostadt India Ltd., Buckman Laboratories, Corteva Inc., Dhanuka Agritech Ltd., Ecolab Inc., FMC Corp., Gowan Co., Koppert, KUMIAI CHEMICAL INDUSTRY CO., Lanxess AG, Nippon Soda Co. Ltd., Nufarm Ltd., Sumitomo Chemical Co. Ltd. and UPL Ltd.

Market Research Insights

  • The Bactericide Market is undergoing a rapid structural transformation driven by the imperative for environmental persistence reduction and adherence to strict clean label food requirements. By implementing advanced crop hygiene protocols, agricultural operators have enhanced disease prevention efficiency by 20%, directly lowering crop loss rates during vulnerable cultivation phases.
  • Furthermore, the integration of new formulation technologies ensures superior active ingredient stability, which improves field application efficacy and reduces required dosage volumes by up to 15%. This measurable shift toward sustainable crop management empowers commercial farming enterprises to optimize operational costs while aligning seamlessly with global regulatory standards, thereby securing supply chain continuity and maximizing overall agricultural output.

We can help! Our analysts can customize this bactericide market research report to meet your requirements.

Get in touch

1. Executive Summary

1.1 Market overview

Executive Summary - Chart on Market Overview
Executive Summary - Data Table on Market Overview
Executive Summary - Chart on Global Market Characteristics
Executive Summary - Chart on Market by Geography
Executive Summary - Chart on Market Segmentation by Application
Executive Summary - Chart on Market Segmentation by Type
Executive Summary - Chart on Market Segmentation by Product Type
Executive Summary - Chart on Incremental Growth
Executive Summary - Data Table on Incremental Growth
Executive Summary - Chart on Company Market Positioning

2. Technavio Analysis

2.1 Analysis of price sensitivity, lifecycle, customer purchase basket, adoption rates, and purchase criteria

2.2 Criticality of inputs and Factors of differentiation

Chart on Overview on criticality of inputs and factors of differentiation

2.3 Factors of disruption

Chart on Overview on factors of disruption

2.4 Impact of drivers and challenges

Chart on Impact of drivers and challenges in 2025 and 2030

3. Market Landscape

3.1 Market ecosystem

Chart on Parent Market
Data Table on - Parent Market

3.2 Market characteristics

Chart on Market characteristics analysis

3.3 Value chain analysis

Chart on Value chain analysis

4. Market Sizing

4.1 Market definition

Data Table on Offerings of companies included in the market definition

4.2 Market segment analysis

Market segments

4.3 Market size 2025

4.4 Market outlook: Forecast for 2025-2030

Chart on Global - Market size and forecast 2025-2030 ($ million)
Data Table on Global - Market size and forecast 2025-2030 ($ million)
Chart on Global Market: Year-over-year growth 2025-2030 (%)
Data Table on Global Market: Year-over-year growth 2025-2030 (%)

5. Historic Market Size

5.1 Global Bactericide Market 2020 - 2024

Historic Market Size - Data Table on Global Bactericide Market 2020 - 2024 ($ million)

5.2 Application segment analysis 2020 - 2024

Historic Market Size - Application Segment 2020 - 2024 ($ million)

5.3 Type segment analysis 2020 - 2024

Historic Market Size - Type Segment 2020 - 2024 ($ million)

5.4 Product Type segment analysis 2020 - 2024

Historic Market Size - Product Type Segment 2020 - 2024 ($ million)

5.5 Geography segment analysis 2020 - 2024

Historic Market Size - Geography Segment 2020 - 2024 ($ million)

5.6 Country segment analysis 2020 - 2024

Historic Market Size - Country Segment 2020 - 2024 ($ million)

6. Qualitative Analysis

6.1 Impact of AI on Global Bactericide Market

6.2 Impact of Geopolitical Conflicts on Global Bactericide Market

7. Five Forces Analysis

7.1 Five forces summary

Five forces analysis - Comparison between 2025 and 2030

7.2 Bargaining power of buyers

Bargaining power of buyers - Impact of key factors 2025 and 2030

7.3 Bargaining power of suppliers

Bargaining power of suppliers - Impact of key factors in 2025 and 2030

7.4 Threat of new entrants

Threat of new entrants - Impact of key factors in 2025 and 2030

7.5 Threat of substitutes

Threat of substitutes - Impact of key factors in 2025 and 2030

7.6 Threat of rivalry

Threat of rivalry - Impact of key factors in 2025 and 2030

7.7 Market condition

Chart on Market condition - Five forces 2025 and 2030

8. Market Segmentation by Application

8.1 Market segments

Chart on Application - Market share 2025-2030 (%)
Data Table on Application - Market share 2025-2030 (%)

8.2 Comparison by Application

Chart on Comparison by Application
Data Table on Comparison by Application

8.3 Soil treatment - Market size and forecast 2025-2030

Chart on Soil treatment - Market size and forecast 2025-2030 ($ million)
Data Table on Soil treatment - Market size and forecast 2025-2030 ($ million)
Chart on Soil treatment - Year-over-year growth 2025-2030 (%)
Data Table on Soil treatment - Year-over-year growth 2025-2030 (%)

8.4 Foliar spray - Market size and forecast 2025-2030

Chart on Foliar spray - Market size and forecast 2025-2030 ($ million)
Data Table on Foliar spray - Market size and forecast 2025-2030 ($ million)
Chart on Foliar spray - Year-over-year growth 2025-2030 (%)
Data Table on Foliar spray - Year-over-year growth 2025-2030 (%)

8.5 Market opportunity by Application

Market opportunity by Application ($ million)
Data Table on Market opportunity by Application ($ million)

9. Market Segmentation by Type

9.1 Market segments

Chart on Type - Market share 2025-2030 (%)
Data Table on Type - Market share 2025-2030 (%)

9.2 Comparison by Type

Chart on Comparison by Type
Data Table on Comparison by Type

9.3 Dry - Market size and forecast 2025-2030

Chart on Dry - Market size and forecast 2025-2030 ($ million)
Data Table on Dry - Market size and forecast 2025-2030 ($ million)
Chart on Dry - Year-over-year growth 2025-2030 (%)
Data Table on Dry - Year-over-year growth 2025-2030 (%)

9.4 Liquid - Market size and forecast 2025-2030

Chart on Liquid - Market size and forecast 2025-2030 ($ million)
Data Table on Liquid - Market size and forecast 2025-2030 ($ million)
Chart on Liquid - Year-over-year growth 2025-2030 (%)
Data Table on Liquid - Year-over-year growth 2025-2030 (%)

9.5 Market opportunity by Type

Market opportunity by Type ($ million)
Data Table on Market opportunity by Type ($ million)

10. Market Segmentation by Product Type

10.1 Market segments

Chart on Product Type - Market share 2025-2030 (%)
Data Table on Product Type - Market share 2025-2030 (%)

10.2 Comparison by Product Type

Chart on Comparison by Product Type
Data Table on Comparison by Product Type

10.3 Copper-based - Market size and forecast 2025-2030

Chart on Copper-based - Market size and forecast 2025-2030 ($ million)
Data Table on Copper-based - Market size and forecast 2025-2030 ($ million)
Chart on Copper-based - Year-over-year growth 2025-2030 (%)
Data Table on Copper-based - Year-over-year growth 2025-2030 (%)

10.4 Dithiocarbamate - Market size and forecast 2025-2030

Chart on Dithiocarbamate - Market size and forecast 2025-2030 ($ million)
Data Table on Dithiocarbamate - Market size and forecast 2025-2030 ($ million)
Chart on Dithiocarbamate - Year-over-year growth 2025-2030 (%)
Data Table on Dithiocarbamate - Year-over-year growth 2025-2030 (%)

10.5 Amide - Market size and forecast 2025-2030

Chart on Amide - Market size and forecast 2025-2030 ($ million)
Data Table on Amide - Market size and forecast 2025-2030 ($ million)
Chart on Amide - Year-over-year growth 2025-2030 (%)
Data Table on Amide - Year-over-year growth 2025-2030 (%)

10.6 Antibiotic - Market size and forecast 2025-2030

Chart on Antibiotic - Market size and forecast 2025-2030 ($ million)
Data Table on Antibiotic - Market size and forecast 2025-2030 ($ million)
Chart on Antibiotic - Year-over-year growth 2025-2030 (%)
Data Table on Antibiotic - Year-over-year growth 2025-2030 (%)

10.7 Others - Market size and forecast 2025-2030

Chart on Others - Market size and forecast 2025-2030 ($ million)
Data Table on Others - Market size and forecast 2025-2030 ($ million)
Chart on Others - Year-over-year growth 2025-2030 (%)
Data Table on Others - Year-over-year growth 2025-2030 (%)

10.8 Market opportunity by Product Type

Market opportunity by Product Type ($ million)
Data Table on Market opportunity by Product Type ($ million)

11. Customer Landscape

11.1 Customer landscape overview

Analysis of price sensitivity, lifecycle, customer purchase basket, adoption rates, and purchase criteria

12. Geographic Landscape

12.1 Geographic segmentation

Chart on Market share by geography 2025-2030 (%)
Data Table on Market share by geography 2025-2030 (%)

12.2 Geographic comparison

Chart on Geographic comparison
Data Table on Geographic comparison

12.3 APAC - Market size and forecast 2025-2030

Chart on APAC - Market size and forecast 2025-2030 ($ million)
Data Table on APAC - Market size and forecast 2025-2030 ($ million)
Chart on APAC - Year-over-year growth 2025-2030 (%)
Data Table on APAC - Year-over-year growth 2025-2030 (%)
Chart on Regional Comparison - APAC
Data Table on Regional Comparison - APAC

12.3.1 China - Market size and forecast 2025-2030

Chart on China - Market size and forecast 2025-2030 ($ million)
Data Table on China - Market size and forecast 2025-2030 ($ million)
Chart on China - Year-over-year growth 2025-2030 (%)
Data Table on China - Year-over-year growth 2025-2030 (%)

12.3.2 India - Market size and forecast 2025-2030

Chart on India - Market size and forecast 2025-2030 ($ million)
Data Table on India - Market size and forecast 2025-2030 ($ million)
Chart on India - Year-over-year growth 2025-2030 (%)
Data Table on India - Year-over-year growth 2025-2030 (%)

12.3.3 Japan - Market size and forecast 2025-2030

Chart on Japan - Market size and forecast 2025-2030 ($ million)
Data Table on Japan - Market size and forecast 2025-2030 ($ million)
Chart on Japan - Year-over-year growth 2025-2030 (%)
Data Table on Japan - Year-over-year growth 2025-2030 (%)

12.3.4 Australia - Market size and forecast 2025-2030

Chart on Australia - Market size and forecast 2025-2030 ($ million)
Data Table on Australia - Market size and forecast 2025-2030 ($ million)
Chart on Australia - Year-over-year growth 2025-2030 (%)
Data Table on Australia - Year-over-year growth 2025-2030 (%)

12.3.5 Indonesia - Market size and forecast 2025-2030

Chart on Indonesia - Market size and forecast 2025-2030 ($ million)
Data Table on Indonesia - Market size and forecast 2025-2030 ($ million)
Chart on Indonesia - Year-over-year growth 2025-2030 (%)
Data Table on Indonesia - Year-over-year growth 2025-2030 (%)

12.3.6 South Korea - Market size and forecast 2025-2030

Chart on South Korea - Market size and forecast 2025-2030 ($ million)
Data Table on South Korea - Market size and forecast 2025-2030 ($ million)
Chart on South Korea - Year-over-year growth 2025-2030 (%)
Data Table on South Korea - Year-over-year growth 2025-2030 (%)

12.4 Europe - Market size and forecast 2025-2030

Chart on Europe - Market size and forecast 2025-2030 ($ million)
Data Table on Europe - Market size and forecast 2025-2030 ($ million)
Chart on Europe - Year-over-year growth 2025-2030 (%)
Data Table on Europe - Year-over-year growth 2025-2030 (%)
Chart on Regional Comparison - Europe
Data Table on Regional Comparison - Europe

12.4.1 France - Market size and forecast 2025-2030

Chart on France - Market size and forecast 2025-2030 ($ million)
Data Table on France - Market size and forecast 2025-2030 ($ million)
Chart on France - Year-over-year growth 2025-2030 (%)
Data Table on France - Year-over-year growth 2025-2030 (%)

12.4.2 Spain - Market size and forecast 2025-2030

Chart on Spain - Market size and forecast 2025-2030 ($ million)
Data Table on Spain - Market size and forecast 2025-2030 ($ million)
Chart on Spain - Year-over-year growth 2025-2030 (%)
Data Table on Spain - Year-over-year growth 2025-2030 (%)

12.4.3 Italy - Market size and forecast 2025-2030

Chart on Italy - Market size and forecast 2025-2030 ($ million)
Data Table on Italy - Market size and forecast 2025-2030 ($ million)
Chart on Italy - Year-over-year growth 2025-2030 (%)
Data Table on Italy - Year-over-year growth 2025-2030 (%)

12.4.4 Germany - Market size and forecast 2025-2030

Chart on Germany - Market size and forecast 2025-2030 ($ million)
Data Table on Germany - Market size and forecast 2025-2030 ($ million)
Chart on Germany - Year-over-year growth 2025-2030 (%)
Data Table on Germany - Year-over-year growth 2025-2030 (%)

12.4.5 UK - Market size and forecast 2025-2030

Chart on UK - Market size and forecast 2025-2030 ($ million)
Data Table on UK - Market size and forecast 2025-2030 ($ million)
Chart on UK - Year-over-year growth 2025-2030 (%)
Data Table on UK - Year-over-year growth 2025-2030 (%)

12.4.6 The Netherlands - Market size and forecast 2025-2030

Chart on The Netherlands - Market size and forecast 2025-2030 ($ million)
Data Table on The Netherlands - Market size and forecast 2025-2030 ($ million)
Chart on The Netherlands - Year-over-year growth 2025-2030 (%)
Data Table on The Netherlands - Year-over-year growth 2025-2030 (%)

12.5 North America - Market size and forecast 2025-2030

Chart on North America - Market size and forecast 2025-2030 ($ million)
Data Table on North America - Market size and forecast 2025-2030 ($ million)
Chart on North America - Year-over-year growth 2025-2030 (%)
Data Table on North America - Year-over-year growth 2025-2030 (%)
Chart on Regional Comparison - North America
Data Table on Regional Comparison - North America

12.5.1 US - Market size and forecast 2025-2030

Chart on US - Market size and forecast 2025-2030 ($ million)
Data Table on US - Market size and forecast 2025-2030 ($ million)
Chart on US - Year-over-year growth 2025-2030 (%)
Data Table on US - Year-over-year growth 2025-2030 (%)

12.5.2 Canada - Market size and forecast 2025-2030

Chart on Canada - Market size and forecast 2025-2030 ($ million)
Data Table on Canada - Market size and forecast 2025-2030 ($ million)
Chart on Canada - Year-over-year growth 2025-2030 (%)
Data Table on Canada - Year-over-year growth 2025-2030 (%)

12.5.3 Mexico - Market size and forecast 2025-2030

Chart on Mexico - Market size and forecast 2025-2030 ($ million)
Data Table on Mexico - Market size and forecast 2025-2030 ($ million)
Chart on Mexico - Year-over-year growth 2025-2030 (%)
Data Table on Mexico - Year-over-year growth 2025-2030 (%)

12.6 South America - Market size and forecast 2025-2030

Chart on South America - Market size and forecast 2025-2030 ($ million)
Data Table on South America - Market size and forecast 2025-2030 ($ million)
Chart on South America - Year-over-year growth 2025-2030 (%)
Data Table on South America - Year-over-year growth 2025-2030 (%)
Chart on Regional Comparison - South America
Data Table on Regional Comparison - South America

12.6.1 Brazil - Market size and forecast 2025-2030

Chart on Brazil - Market size and forecast 2025-2030 ($ million)
Data Table on Brazil - Market size and forecast 2025-2030 ($ million)
Chart on Brazil - Year-over-year growth 2025-2030 (%)
Data Table on Brazil - Year-over-year growth 2025-2030 (%)

12.6.2 Argentina - Market size and forecast 2025-2030

Chart on Argentina - Market size and forecast 2025-2030 ($ million)
Data Table on Argentina - Market size and forecast 2025-2030 ($ million)
Chart on Argentina - Year-over-year growth 2025-2030 (%)
Data Table on Argentina - Year-over-year growth 2025-2030 (%)

12.6.3 Chile - Market size and forecast 2025-2030

Chart on Chile - Market size and forecast 2025-2030 ($ million)
Data Table on Chile - Market size and forecast 2025-2030 ($ million)
Chart on Chile - Year-over-year growth 2025-2030 (%)
Data Table on Chile - Year-over-year growth 2025-2030 (%)

12.7 Middle East and Africa - Market size and forecast 2025-2030

Chart on Middle East and Africa - Market size and forecast 2025-2030 ($ million)
Data Table on Middle East and Africa - Market size and forecast 2025-2030 ($ million)
Chart on Middle East and Africa - Year-over-year growth 2025-2030 (%)
Data Table on Middle East and Africa - Year-over-year growth 2025-2030 (%)
Chart on Regional Comparison - Middle East and Africa
Data Table on Regional Comparison - Middle East and Africa

12.7.1 South Africa - Market size and forecast 2025-2030

Chart on South Africa - Market size and forecast 2025-2030 ($ million)
Data Table on South Africa - Market size and forecast 2025-2030 ($ million)
Chart on South Africa - Year-over-year growth 2025-2030 (%)
Data Table on South Africa - Year-over-year growth 2025-2030 (%)

12.7.2 Egypt - Market size and forecast 2025-2030

Chart on Egypt - Market size and forecast 2025-2030 ($ million)
Data Table on Egypt - Market size and forecast 2025-2030 ($ million)
Chart on Egypt - Year-over-year growth 2025-2030 (%)
Data Table on Egypt - Year-over-year growth 2025-2030 (%)

12.7.3 Saudi Arabia - Market size and forecast 2025-2030

Chart on Saudi Arabia - Market size and forecast 2025-2030 ($ million)
Data Table on Saudi Arabia - Market size and forecast 2025-2030 ($ million)
Chart on Saudi Arabia - Year-over-year growth 2025-2030 (%)
Data Table on Saudi Arabia - Year-over-year growth 2025-2030 (%)

12.7.4 UAE - Market size and forecast 2025-2030

Chart on UAE - Market size and forecast 2025-2030 ($ million)
Data Table on UAE - Market size and forecast 2025-2030 ($ million)
Chart on UAE - Year-over-year growth 2025-2030 (%)
Data Table on UAE - Year-over-year growth 2025-2030 (%)

12.7.5 Turkey - Market size and forecast 2025-2030

Chart on Turkey - Market size and forecast 2025-2030 ($ million)
Data Table on Turkey - Market size and forecast 2025-2030 ($ million)
Chart on Turkey - Year-over-year growth 2025-2030 (%)
Data Table on Turkey - Year-over-year growth 2025-2030 (%)

12.8 Market opportunity by geography

Market opportunity by geography ($ million)
Data Tables on Market opportunity by geography ($ million)

13. Drivers, Challenges, and Opportunity

13.1 Market drivers

Increasing global population and escalating food demand
Heightened incidence of crop diseases amidst climate change
Advancements in farming practices and rise of integrated pest management

13.2 Market challenges

Stringent regulatory frameworks and escalating development costs
Pervasive threat of bacterial resistance
Shifting consumer preferences towards organic and residue-free produce

13.3 Impact of drivers and challenges

Impact of drivers and challenges in 2025 and 2030

13.4 Market opportunities

Ascendancy of biological and bio-based bactericides
Integration of digital technologies and precision agriculture
Focus on advanced formulations and novel delivery systems

14. Competitive Landscape

14.1 Overview

14.2

Overview on criticality of inputs and factors of differentiation

14.3 Landscape disruption

Overview on factors of disruption

14.4 Industry risks

Impact of key risks on business

15. Competitive Analysis

15.1 Companies profiled

Companies covered

15.2 Company ranking index

15.3 Market positioning of companies

Matrix on companies position and classification

15.4 ADAMA Ltd.

ADAMA Ltd. - Overview
ADAMA Ltd. - Product / Service
ADAMA Ltd. - Key offerings
SWOT

15.5 Albaugh LLC

Albaugh LLC - Overview
Albaugh LLC - Product / Service
Albaugh LLC - Key offerings
SWOT

15.6 AMVAC Chemical Corp.

AMVAC Chemical Corp. - Overview
AMVAC Chemical Corp. - Product / Service
AMVAC Chemical Corp. - Key offerings
SWOT

15.7 Arxada AG

Arxada AG - Overview
Arxada AG - Product / Service
Arxada AG - Key offerings
SWOT

15.8 BASF SE

BASF SE - Overview
BASF SE - Business segments
BASF SE - Key news
BASF SE - Key offerings
BASF SE - Segment focus
SWOT

15.9 Bayer AG

Bayer AG - Overview
Bayer AG - Business segments
Bayer AG - Key news
Bayer AG - Key offerings
Bayer AG - Segment focus
SWOT

15.10 Corteva Inc.

Corteva Inc. - Overview
Corteva Inc. - Business segments
Corteva Inc. - Key offerings
Corteva Inc. - Segment focus
SWOT

15.11 Ecolab Inc.

Ecolab Inc. - Overview
Ecolab Inc. - Business segments
Ecolab Inc. - Key news
Ecolab Inc. - Key offerings
Ecolab Inc. - Segment focus
SWOT

15.12 FMC Corp.

FMC Corp. - Overview
FMC Corp. - Product / Service
FMC Corp. - Key offerings
SWOT

15.13 KUMIAI CHEMICAL INDUSTRY CO.

KUMIAI CHEMICAL INDUSTRY CO. - Overview
KUMIAI CHEMICAL INDUSTRY CO. - Product / Service
KUMIAI CHEMICAL INDUSTRY CO. - Key offerings
SWOT

15.14 Lanxess AG

Lanxess AG - Overview
Lanxess AG - Business segments
Lanxess AG - Key offerings
Lanxess AG - Segment focus
SWOT

15.15 Nippon Soda Co. Ltd.

Nippon Soda Co. Ltd. - Overview
Nippon Soda Co. Ltd. - Business segments
Nippon Soda Co. Ltd. - Key offerings
Nippon Soda Co. Ltd. - Segment focus
SWOT

15.16 Nufarm Ltd.

Nufarm Ltd. - Overview
Nufarm Ltd. - Business segments
Nufarm Ltd. - Key offerings
Nufarm Ltd. - Segment focus
SWOT

15.17 Sumitomo Chemical Co. Ltd.

Sumitomo Chemical Co. Ltd. - Overview
Sumitomo Chemical Co. Ltd. - Business segments
Sumitomo Chemical Co. Ltd. - Key offerings
Sumitomo Chemical Co. Ltd. - Segment focus
SWOT

15.18 UPL Ltd.

UPL Ltd. - Overview
UPL Ltd. - Business segments
UPL Ltd. - Key offerings
UPL Ltd. - Segment focus
SWOT

16. Appendix

16.1 Scope of the report

Market definition
Objectives
Notes and caveats

16.2 Inclusions and exclusions checklist

Inclusions checklist
Exclusions checklist

16.3 Currency conversion rates for US$

16.4 Research methodology

16.5 Data procurement

Information sources

16.6 Data validation

16.7 Validation techniques employed for market sizing

16.8 Data synthesis

16.9 360 degree market analysis

16.10 List of abbreviations

Research Methodology

Technavio presents a detailed picture of the market by way of study, synthesis, and summation of data from multiple sources. The analysts have presented the various facets of the market with a particular focus on identifying the key industry influencers. The data thus presented is comprehensive, reliable, and the result of extensive research, both primary and secondary.

INFORMATION SOURCES

Primary sources

  • Manufacturers and suppliers
  • Channel partners
  • Industry experts
  • Strategic decision makers

Secondary sources

  • Industry journals and periodicals
  • Government data
  • Financial reports of key industry players
  • Historical data
  • Press releases

DATA ANALYSIS

Data Synthesis

  • Collation of data
  • Estimation of key figures
  • Analysis of derived insights

Data Validation

  • Triangulation with data models
  • Reference against proprietary databases
  • Corroboration with industry experts

REPORT WRITING

Qualitative

  • Market drivers
  • Market challenges
  • Market trends
  • Five forces analysis

Quantitative

  • Market size and forecast
  • Market segmentation
  • Geographical insights
  • Competitive landscape

Interested in this report?

Get your sample now to see our research methodology and insights!

Download Now

Frequently Asked Questions

Bactericide market growth will increase by USD 2090.4 million during 2026-2030.

The Bactericide market is expected to grow at a CAGR of 4.8% during 2026-2030.

Bactericide market is segmented by Application (Soil treatment, Foliar spray) Type (Dry, Liquid) Product type (Copper-based, Dithiocarbamate, Amide, Antibiotic, Others)

ADAMA Ltd., Albaugh LLC, AMVAC Chemical Corp., Arxada AG, BASF SE, Bayer AG, Biostadt India Ltd., Buckman Laboratories, Corteva Inc., Dhanuka Agritech Ltd., Ecolab Inc., FMC Corp., Gowan Co., Koppert, KUMIAI CHEMICAL INDUSTRY CO., Lanxess AG, Nippon Soda Co. Ltd., Nufarm Ltd., Sumitomo Chemical Co. Ltd., UPL Ltd. are a few of the key vendors in the Bactericide market.

APAC will register the highest growth rate of 43.4% among the other regions. Therefore, the Bactericide market in APAC is expected to garner significant business opportunities for the vendors during the forecast period.

China, India, Japan, Australia, Indonesia, South Korea, France, Spain, Italy, Germany, UK, The Netherlands, US, Canada, Mexico, Brazil, Argentina, Chile, South Africa, Egypt, Saudi Arabia, UAE, Turkey

  • Increasing global population and escalating food demand is the driving factor this market.

The Bactericide market vendors should focus on grabbing business opportunities from the Application segment as it accounted for the largest market share in the base year.
RIA - Research AI Assistant
Ask RIA
