Bar Soap Market Size 2025-2029
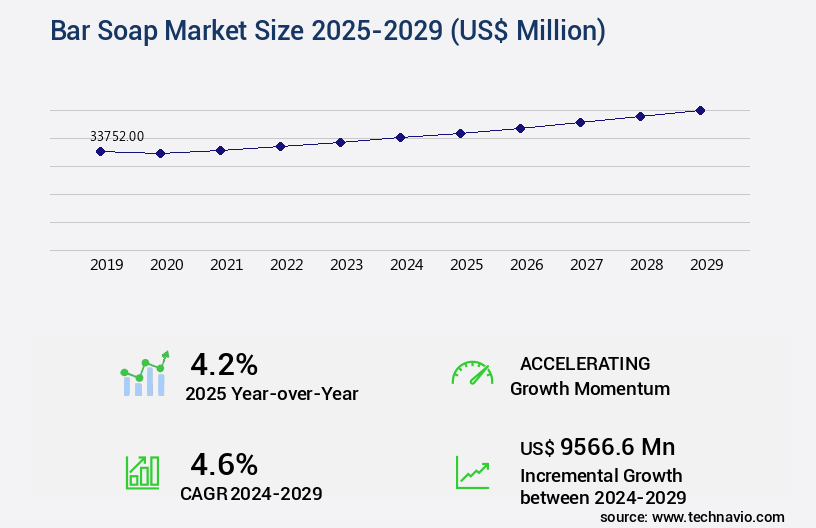
The bar soap market size is valued to increase USD 9.57 billion, at a CAGR of 4.6% from 2024 to 2029. Growing adoption of multi-functional bar soaps will drive the bar soap market.
Major Market Trends & Insights
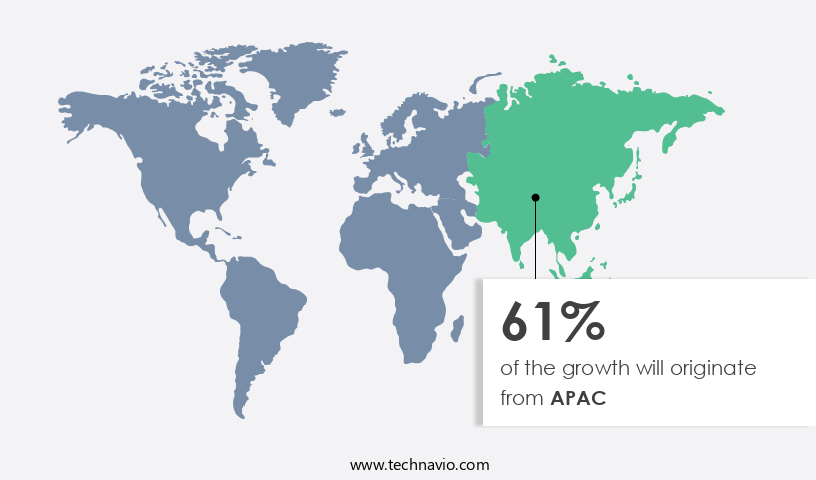
- APAC dominated the market and accounted for a 61% growth during the forecast period.
- By Material - Synthetic segment was valued at USD 25.87 billion in 2023
- By Distribution Channel - Offline segment accounted for the largest market revenue share in 2023
Market Size & Forecast
- Market Opportunities: USD 41.92 billion
- Market Future Opportunities: USD USD 9.57 billion
- CAGR : 4.6%
- APAC: Largest market in 2023
Market Summary
- The market represents a significant segment of the personal care industry, characterized by continuous evolution and innovation. Core technologies, such as the use of natural and organic ingredients, drive growth in this market. For instance, the growing adoption of multi-functional bar soaps, which offer benefits beyond basic cleansing, is a notable trend. However, the market faces challenges, including increasing preference for liquid soaps and stringent government regulations and standards related to BPC (Body Personal Care) products. According to recent reports, organic bar soaps are projected to capture a substantial market share in the coming years, with a 15% adoption rate among consumers.
- As we look forward, the forecast period presents opportunities for market expansion, particularly in emerging regions like Asia Pacific and Africa. Related markets such as the liquid soap and shampoo markets also offer intriguing insights and potential synergies.
What will be the Size of the Bar Soap Market during the forecast period?
Get Key Insights on Market Forecast (PDF) Request Free Sample
How is the Bar Soap Market Segmented and what are the key trends of market segmentation?
The bar soap industry research report provides comprehensive data (region-wise segment analysis), with forecasts and estimates in "USD million" for the period 2025-2029, as well as historical data from 2019-2023 for the following segments.
- Material
- Synthetic
- Natural
- Distribution Channel
- Offline
- Online
- Product
- Antibacterial soaps
- Deodorant soaps
- Moisturizing soaps
- Exfoliating soaps
- Hypoallergenic soaps
- Geography
- North America
- US
- Canada
- Mexico
- Europe
- Germany
- UK
- APAC
- Australia
- China
- India
- Japan
- South Korea
- Rest of World (ROW)
- North America
By Material Insights
The synthetic segment is estimated to witness significant growth during the forecast period.
The market is a dynamic and evolving industry, with various segments catering to diverse consumer preferences. In 2024, the synthetic segment held the largest market share, driven by the popularity of synthetic liquid hand soaps. These soaps, formulated with detergents like sodium laureth sulfate (SLS), offer efficient cleansing and bacterial elimination. However, concerns over potential irritants and allergens in synthetic soap formulations have emerged, leading some consumers to explore natural alternatives. Natural bar soaps, often based on vegetable oils, have gained traction due to their use of natural ingredients and milder textures. The soap texture and sensory evaluation play crucial roles in consumer choice, with many preferring soaps that provide a rich lather and moisturizing properties.
Sodium hydroxide saponification is a common soap-making process used for both synthetic and natural soaps. Fragrance compounds and essential oil blends are added to enhance the sensory experience, while emulsifying waxes ensure a stable soap formulation. Quality control, cost optimization, and safety regulations are essential factors influencing market trends. Skin moisturization and ingredient sourcing are increasingly important to consumers, with many seeking soaps that cater to their specific skin types and sustainability concerns. Manufacturing processes, such as molding techniques and cutting methods, have evolved to improve production efficiency and reduce waste. Consumer preferences for natural ingredients and sustainable sourcing have led to the use of glycerin soapmaking and microbial testing to ensure product safety and quality.
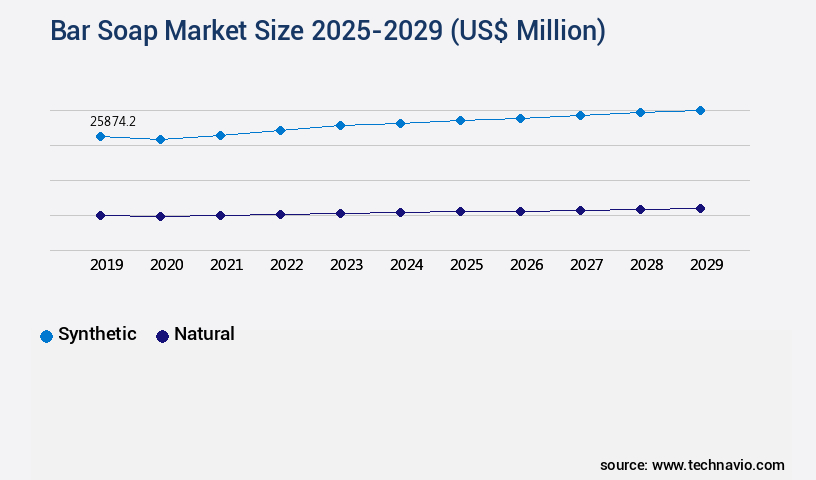
Surfactant properties, pH balance, and fatty acid content are essential factors in soap formulation and performance. The ongoing market activities reflect the continuous unfolding of industry trends and evolving consumer demands. According to recent studies, the natural segment is expected to grow by 18% in the next three years, driven by increasing consumer awareness and demand for eco-friendly and health-conscious products. Meanwhile, the synthetic segment is projected to expand by 12% during the same period, as advancements in formulation technology address consumer concerns over irritants and allergens. These trends underscore the dynamic nature of the market and its ongoing evolution to meet the evolving needs of consumers.
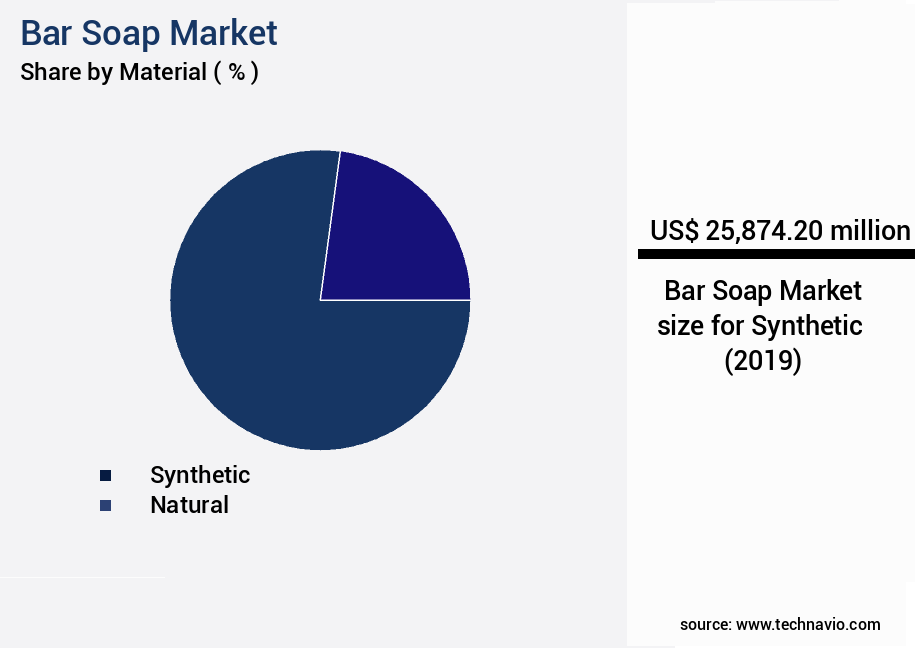
The Synthetic segment was valued at USD 25.87 billion in 2019 and showed a gradual increase during the forecast period.
Regional Analysis
APAC is estimated to contribute 61% to the growth of the global market during the forecast period.Technavio’s analysts have elaborately explained the regional trends and drivers that shape the market during the forecast period.
See How Bar Soap Market Demand is Rising in APAC Request Free Sample
The APAC region dominates The market, driven by its large and diverse population and cultural preferences for traditional hygiene practices. In 2024, APAC accounted for approximately 45% of the global bar soap consumption, with countries like India and China leading the demand. Bar soap's affordability and long shelf life make it a staple in daily routines, especially in regions where access to running water is limited.
The market is further fueled by the growing trend towards natural and organic personal care products, with many APAC consumers preferring bar soaps infused with local botanicals. Despite the emergence of newer cleansing formats, the cultural attachment to bar soap ensures consistent demand, positioning the APAC the market for steady growth.
Market Dynamics
Our researchers analyzed the data with 2024 as the base year, along with the key drivers, trends, and challenges. A holistic analysis of drivers will help companies refine their marketing strategies to gain a competitive advantage.
The market is a dynamic and intricate industry, encompassing various aspects of soap production and quality assessment. Manufacturers continually strive to optimize soap lathering properties by meticulously managing the sodium hydroxide concentration in soapmaking. Essential oils, with their unique fragrances and potential impact on soap pH, are carefully selected to enhance consumer experience. Measuring soap hardness using a durometer is essential for ensuring consistent product quality. Vegetable oil combinations for soap formulation play a significant role in determining the final product's properties, including biodegradability. Assessing soap biodegradability is crucial in today's eco-conscious market, with consumers increasingly preferring environmentally friendly options.
Testing for skin irritation potential in soap is another critical aspect of the production process, as is understanding the effects of curing time on soap hardness. The glycerin content in different soap types varies, influencing their moisturizing properties and consumer appeal. Evaluating soap color stability and determining fatty acid composition are essential for maintaining product quality and consistency. Improving soap production efficiency and reducing manufacturing costs are ongoing priorities for market players. Comparing different soapmaking techniques, such as the cold process versus hot process, can lead to significant cost savings. An analysis of surfactant properties in soap reveals their role in enhancing lather and cleansing ability.
Understanding consumer preferences for soap fragrance is crucial for market success. Assessing the impact of soap packaging materials on product shelf life and quality is another essential consideration. Testing soap shelf life under various conditions ensures product stability and longevity. Evaluating soap quality through sensory testing is an integral part of the quality assurance process. According to market research, the use of natural ingredients in bar soap formulations has seen a significant increase, with a 12% year-on-year growth rate compared to synthetic ingredients, which experienced a 5% decline. This shift towards natural ingredients reflects consumer demand for eco-friendly and health-conscious options.
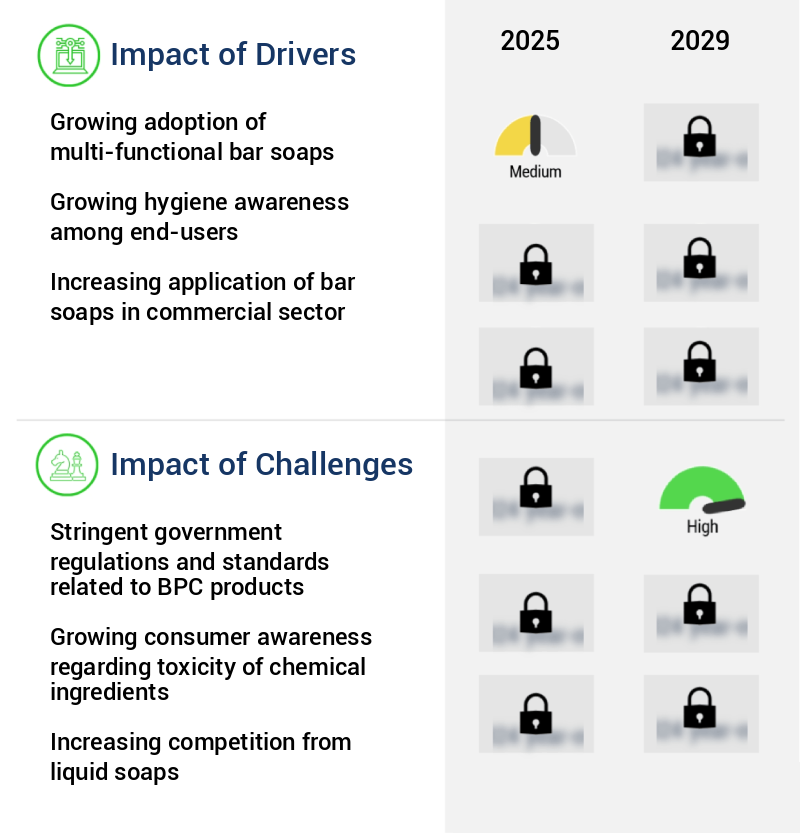
What are the key market drivers leading to the rise in the adoption of Bar Soap Industry?
- The increasing preference for multi-functional bar soaps, which offer convenience and cost-effectiveness, is the primary growth driver in the market.
- Multi-functional bar soaps have emerged as a popular choice for consumers seeking more than just basic cleansing. These innovative products offer a range of benefits beyond traditional soap, making them a versatile option for those desiring holistic skincare experiences. Exfoliating bar soaps, for instance, incorporate gentle abrasives such as natural grains or exfoliating agents to help remove dead skin cells, revealing smoother, rejuvenated skin. Moisturizing bar soaps, on the other hand, infuse the skin with hydrating ingredients like shea butter, coconut oil, or glycerin while cleansing, catering to individuals with dry or sensitive skin.
- The market for multi-functional bar soaps continues to evolve, with new product categories and formulations emerging to address diverse consumer needs. By providing multiple benefits in a single product, multi-functional bar soaps have become a go-to solution for those seeking convenience and effectiveness in their skincare routines.
What are the market trends shaping the Bar Soap Industry?
- The increasing preference for organic bar soaps represents a notable market trend. Organic bar soaps are gaining popularity among consumers.
- The organic the market within the personal care industry experiences continuous growth as consumers prioritize health, sustainability, and transparency. This trend is driven by increasing awareness and a preference for natural, non-synthetic products. Organic bar soaps, certified by reputable organizations, have gained significant traction due to their appeal as safer and eco-friendly alternatives. These soaps are formulated without synthetic chemicals, artificial fragrances, and harsh additives, catering to individuals with sensitive skin and those seeking to minimize exposure to potentially harmful substances.
- The market's expansion is marked by the widespread use of plant-based oils, botanical extracts, and essential oils in soap production, emphasizing their natural origins and purity. Organizations and manufacturers continue to innovate, offering a diverse range of organic bar soap varieties to meet the evolving demands of consumers.
What challenges does the Bar Soap Industry face during its growth?
- The stringent government regulations and standards governing BPC (Biopharmaceutical Complexity) products pose a significant challenge to the industry's growth. These regulations require rigorous compliance, which can increase production costs and limit market entry for new players. Adhering to these regulations and continuously updating processes to meet evolving standards can be time-consuming and resource-intensive for companies. However, ensuring product safety and efficacy is paramount, and the industry must navigate these regulations to bring innovative, high-quality BPC products to market.
- In the realm of beauty and personal care (BPC) products, regulatory compliance plays a pivotal role, particularly in the production and labeling of liquid hand soaps. The US Food and Drug Administration (FDA) enforces regulations to ensure product safety and transparency. Non-compliance with these standards can lead to health hazards. For instance, the improper use of chemical ingredients, such as parabens, fragrances, and phthalates, may pose health risks. Manufacturers are obligated to list all ingredients on the labels of liquid hand soaps, providing consumers with essential information.
- This transparency is crucial for maintaining trust and adhering to regulatory requirements. The ongoing evolution of regulations and consumer preferences necessitates continuous adaptation by bar soap companies to remain competitive in the dynamic BPC market.
Exclusive Customer Landscape
The bar soap market forecasting report includes the adoption lifecycle of the market, covering from the innovator’s stage to the laggard’s stage. It focuses on adoption rates in different regions based on penetration. Furthermore, the bar soap market report also includes key purchase criteria and drivers of price sensitivity to help companies evaluate and develop their market growth analysis strategies.
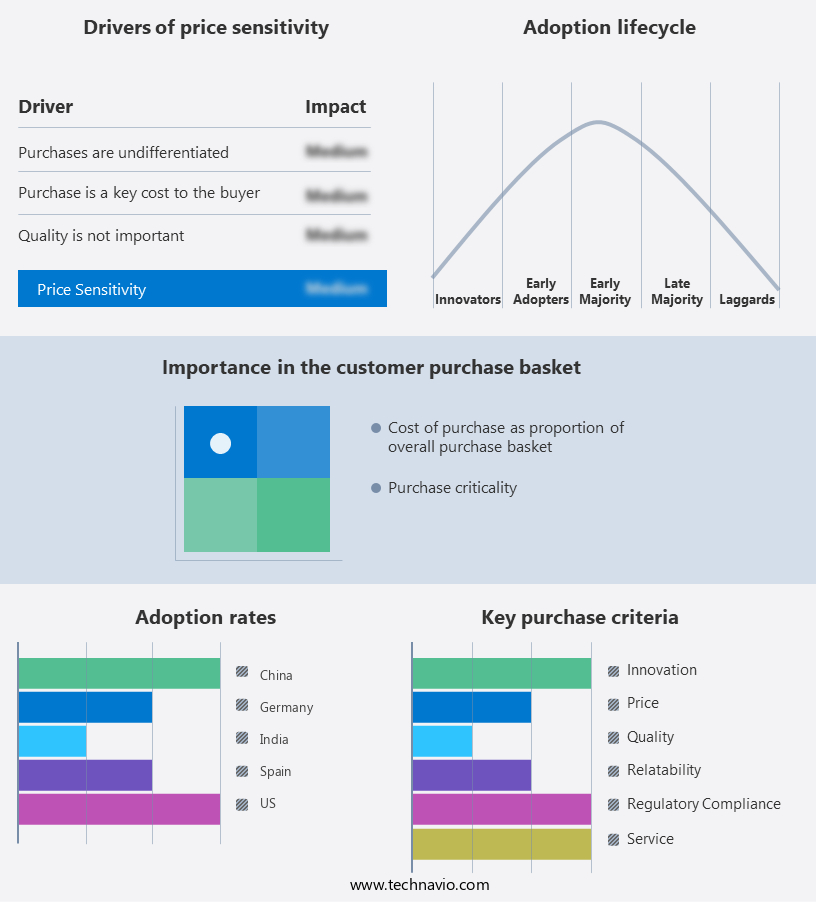
Customer Landscape of Bar Soap Industry
Competitive Landscape & Market Insights
Companies are implementing various strategies, such as strategic alliances, bar soap market forecast, partnerships, mergers and acquisitions, geographical expansion, and product/service launches, to enhance their presence in the industry.
Beaumont Products Inc. - The Clearly Glycerin brand specializes in producing a range of glycerin-based bar soaps, including options infused with aloe vera, vitamin E, honeysuckle, and tea tree. These high-quality soaps deliver nourishing benefits to consumers, enhancing personal hygiene routines.
The industry research and growth report includes detailed analyses of the competitive landscape of the market and information about key companies, including:
- Beaumont Products Inc.
- CST Soap
- Dr. Woods Products
- Godrej Consumer Products Ltd.
- Henkel AG and Co. KGaA
- Himalaya Global Holdings Ltd.
- ITC Ltd.
- John Drury and Co. Ltd.
- Johnson and Johnson Services Inc.
- LOreal SA
- Natura and Co Holding SA
- Neals Yard Ltd.
- Reckitt Benckiser Group Plc
- The Procter and Gamble Co.
- Twincraft Skincare
- Unilever PLC
- Vanguard Soap
- VVF Ltd.
Qualitative and quantitative analysis of companies has been conducted to help clients understand the wider business environment as well as the strengths and weaknesses of key industry players. Data is qualitatively analyzed to categorize companies as pure play, category-focused, industry-focused, and diversified; it is quantitatively analyzed to categorize companies as dominant, leading, strong, tentative, and weak.
Recent Development and News in Bar Soap Market
- In January 2024, Unilever, a leading consumer goods company, launched a new line of eco-friendly bar soaps under the brand name "RAD," which stands for "Responsibly Sourced, Authentic, and Delicious" (Unilever Press Release, 2024). This line includes soaps made with 100% natural ingredients and biodegradable packaging.
- In March 2024, Procter & Gamble (P&G) announced a strategic partnership with TerraCycle, a recycling solutions company, to launch a recycling program for used soap bars (P&G Press Release, 2024). This initiative aims to reduce plastic waste and promote sustainable practices within the bar soap industry.
- In May 2024, Colgate-Palmolive, a major player in the market, completed the acquisition of a manufacturing facility in India from Godrej Consumer Products for approximately USD150 million (Colgate-Palmolive SEC Filing, 2024). This acquisition will increase Colgate-Palmolive's production capacity and strengthen its presence in the Indian market.
- In April 2025, the European Union (EU) approved the use of plant-based surfactants in bar soaps, marking a significant regulatory shift towards more sustainable and eco-friendly ingredients (EU Commission Press Release, 2025). This approval is expected to boost demand for plant-based bar soaps in the EU market.
Dive into Technavio’s robust research methodology, blending expert interviews, extensive data synthesis, and validated models for unparalleled Bar Soap Market insights. See full methodology.
|
Market Scope |
|
|
Report Coverage |
Details |
|
Page number |
228 |
|
Base year |
2024 |
|
Historic period |
2019-2023 |
|
Forecast period |
2025-2029 |
|
Growth momentum & CAGR |
Accelerate at a CAGR of 4.6% |
|
Market growth 2025-2029 |
USD 9566.6 million |
|
Market structure |
Fragmented |
|
YoY growth 2024-2025(%) |
4.2 |
|
Key countries |
US, China, Canada, India, Japan, Mexico, Australia, Germany, UK, and South Korea |
|
Competitive landscape |
Leading Companies, Market Positioning of Companies, Competitive Strategies, and Industry Risks |
Research Analyst Overview
- The dynamic and evolving the market is characterized by continuous innovation and consumer preference shifts. Hardness testing plays a crucial role in ensuring optimal soap texture, with sodium hydroxide saponification being a fundamental process in soap formulation. Vegetable oil bases, incorporating natural ingredients, have gained popularity due to consumer demand for healthier and more sustainable options. Fragrance compounds and essential oil blends contribute significantly to the sensory experience, while safety regulations ensure product safety and quality control. The manufacturing process involves various stages, including cleansing agents' addition for effective lathering, emulsifying waxes for texture enhancement, and ingredient sourcing for cost optimization.
- Consumer preferences for skin moisturization have led to an increased focus on glycerin soapmaking and sustainable sourcing. Sensory evaluation and microbial testing are essential aspects of quality control, ensuring both safety and desirable sensory properties. Soap formulation development requires a deep understanding of ingredient interactions, surfactant properties, and manufacturing process efficiencies. Packaging materials and cutting methods are critical considerations for production and shelf life testing. The market's unfolding activities reflect ongoing research and development in areas such as fatty acid content, ph balance, and detergent properties. Color pigments and manufacturing techniques continue to evolve, addressing consumer demands and market trends.
- In summary, the market is a vibrant and evolving landscape, with a focus on natural ingredients, consumer preferences, and regulatory compliance. Companies must navigate the complexities of formulation development, manufacturing processes, and cost optimization to stay competitive.
What are the Key Data Covered in this Bar Soap Market Research and Growth Report?
-
What is the expected growth of the Bar Soap Market between 2025 and 2029?
-
USD 9.57 billion, at a CAGR of 4.6%
-
-
What segmentation does the market report cover?
-
The report segmented by Material (Synthetic and Natural), Distribution Channel (Offline and Online), Product (Antibacterial soaps, Deodorant soaps, Moisturizing soaps, Exfoliating soaps, and Hypoallergenic soaps), and Geography (APAC, North America, Europe, South America, and Middle East and Africa)
-
-
Which regions are analyzed in the report?
-
APAC, North America, Europe, South America, and Middle East and Africa
-
-
What are the key growth drivers and market challenges?
-
Growing adoption of multi-functional bar soaps, Stringent government regulations and standards related to BPC products
-
-
Who are the major players in the Bar Soap Market?
-
Key Companies Beaumont Products Inc., CST Soap, Dr. Woods Products, Godrej Consumer Products Ltd., Henkel AG and Co. KGaA, Himalaya Global Holdings Ltd., ITC Ltd., John Drury and Co. Ltd., Johnson and Johnson Services Inc., LOreal SA, Natura and Co Holding SA, Neals Yard Ltd., Reckitt Benckiser Group Plc, The Procter and Gamble Co., Twincraft Skincare, Unilever PLC, Vanguard Soap, and VVF Ltd.
-
Market Research Insights
- The market encompasses a wide range of products, including those formulated with sodium lauryl sulfate, sodium cocoate, and potassium hydroxide, among others. One notable trend in the market involves the use of natural ingredients, such as palm oil, coconut oil, olive oil, castor oil, shea butter, and goat milk. Glycerin content is another critical factor, with superfatting techniques used to increase it for enhanced moisturizing properties. Two key performance indicators in the market are skin irritation and biodegradability. According to industry data, sodium lauryl sulfate-based soaps account for approximately 70% of total sales, but they are more likely to cause skin irritation compared to other formulations.
- In contrast, soaps made using oil saponification techniques, such as hot process or cold process, have a lower irritant potential due to their higher glycerin content. Furthermore, the increasing demand for eco-friendly products has led to a growing focus on biodegradability testing, with many manufacturers striving to produce soaps that meet stringent environmental standards. Despite these advancements, challenges persist in the market. Skin irritation remains a concern for some consumers, necessitating allergen testing and careful formulation. Additionally, soap preservatives and additives, such as fragrances and colorants, can impact color stability, soap durability, and drying time.
- The curing process, lye concentration, and soap's overall composition all play crucial roles in determining its final properties and market appeal.
We can help! Our analysts can customize this bar soap market research report to meet your requirements.
 RIA -
RIA - 
