Barge Transportation Market Size 2024-2028
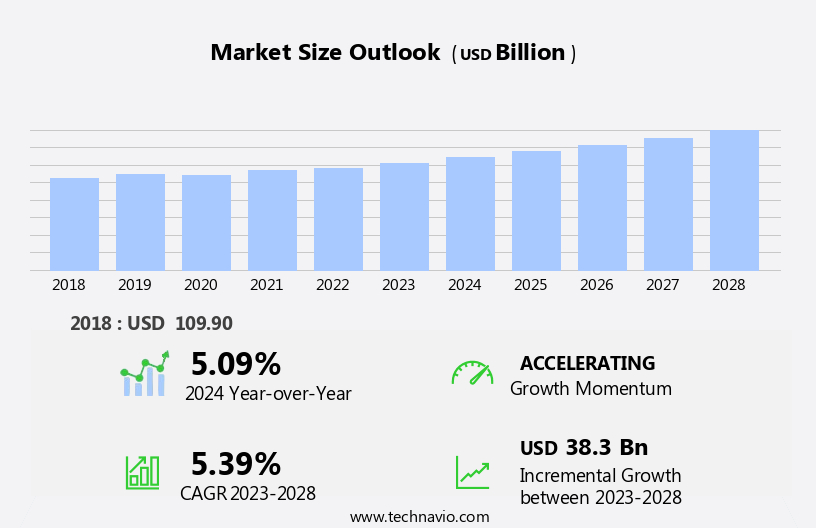
The barge transportation market size is forecast to increase by USD 38.3 billion at a CAGR of 5.39% between 2023 and 2028.
What will be the Size of the Barge Transportation Market During the Forecast Period?
How is this Barge Transportation Industry segmented and which is the largest segment?
The barge transportation industry research report provides comprehensive data (region-wise segment analysis), with forecasts and estimates in "USD billion" for the period 2024-2028, as well as historical data from 2018-2022 for the following segments.
- Type
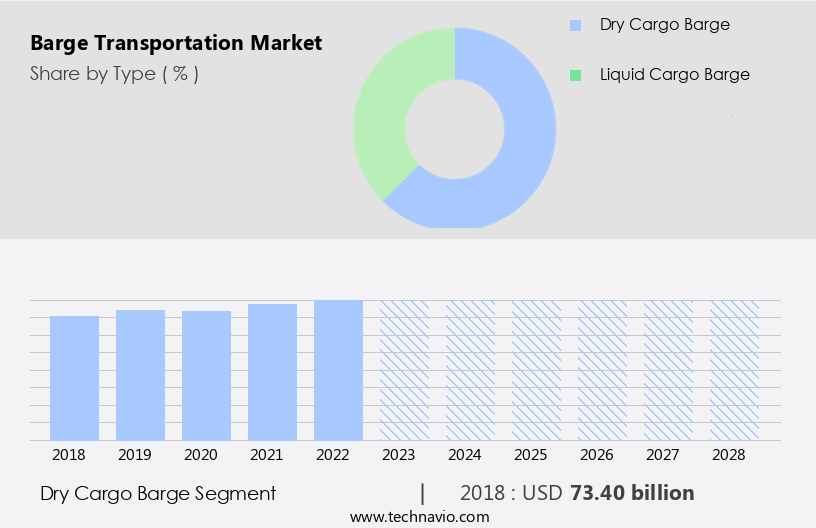
- Dry cargo barge
- Liquid cargo barge
- Application
- Agricultural products
- Coal and crude petroleum
- Food and beverage
- Others
- Geography
- APAC
- China
- Japan
- North America
- US
- Europe
- Germany
- South America
- Middle East and Africa
- APAC
By Type Insights
- The dry cargo barge segment is estimated to witness significant growth during the forecast period.
The market for dry cargo is projected to expand due to the increasing demand for dry cargo capacity worldwide. This growth is primarily driven by the rising production and consumption of agricultural products, electronic goods, home appliances, textiles, and other bulk materials in major economies such as China, India, Australia, Russia, the US, Mexico, South Africa, and Brazil. The significant population base In these countries fuels the demand for these commodities, leading to an increased requirement for dry cargo barges. The market's growth is further boosted by the trend towards intermodal transportation, which combines multiple modes of transport, including barges, to move goods more efficiently and reduce transportation costs.
The use of dry cargo barges offers several advantages, including lower carbon emissions compared to road freight transportation, higher cargo-carrying capacity, and improved safety compared to rail and trucks. The market's growth is also supported by industry expertise, supportive policies, and regulations, making it a climate-friendly and cost-effective option for cargo transportation.
Get a glance at the Barge Transportation Industry report of share of various segments Request Free Sample
The Dry cargo barge segment was valued at USD 73.40 billion in 2018 and showed a gradual increase during the forecast period.
Regional Analysis
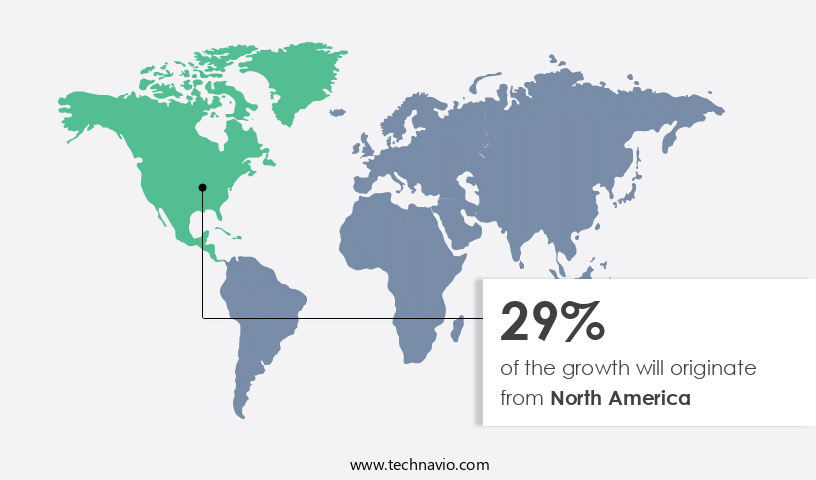
- North America is estimated to contribute 29% to the growth of the global market during the forecast period.
Technavio’s analysts have elaborately explained the regional trends and drivers that shape the market during the forecast period.
For more insights on the market share of various regions, Request Free Sample
The market in APAC is projected to experience significant expansion due to increasing domestic trade opportunities. In 2023, India exported goods valued at USD778.2 billion, representing a minimal increase of 0.23% compared to the previous year. This growth in trade and subsequent government efforts to enhance domestic infrastructure are fueling the development of barge transportation in APAC. Notably, several major countries In the region are investing in improving their inland waterway infrastructure. For instance, the Indian Register of Shipping (IRS) has been instrumental in enhancing inland vessel safety throughout India and contributed significantly to the drafting of the Inland Vessels Act 2021.
This focus on infrastructure development and safety regulations is expected to bolster the growth of barge transportation in APAC.
Market Dynamics
Our researchers analyzed the data with 2023 as the base year, along with the key drivers, trends, and challenges. A holistic analysis of drivers will help companies refine their marketing strategies to gain a competitive advantage.
What are the key market drivers leading to the rise In the adoption of Barge Transportation Industry?
Rising crude oil movement by barges is the key driver of the market.
What are the market trends shaping the Barge Transportation Industry?
Growth opportunities in petrochemical industries is the upcoming market trend.
What challenges does the Barge Transportation Industry face during its growth?
High entry barrier in barge transportation market is a key challenge affecting the industry growth.
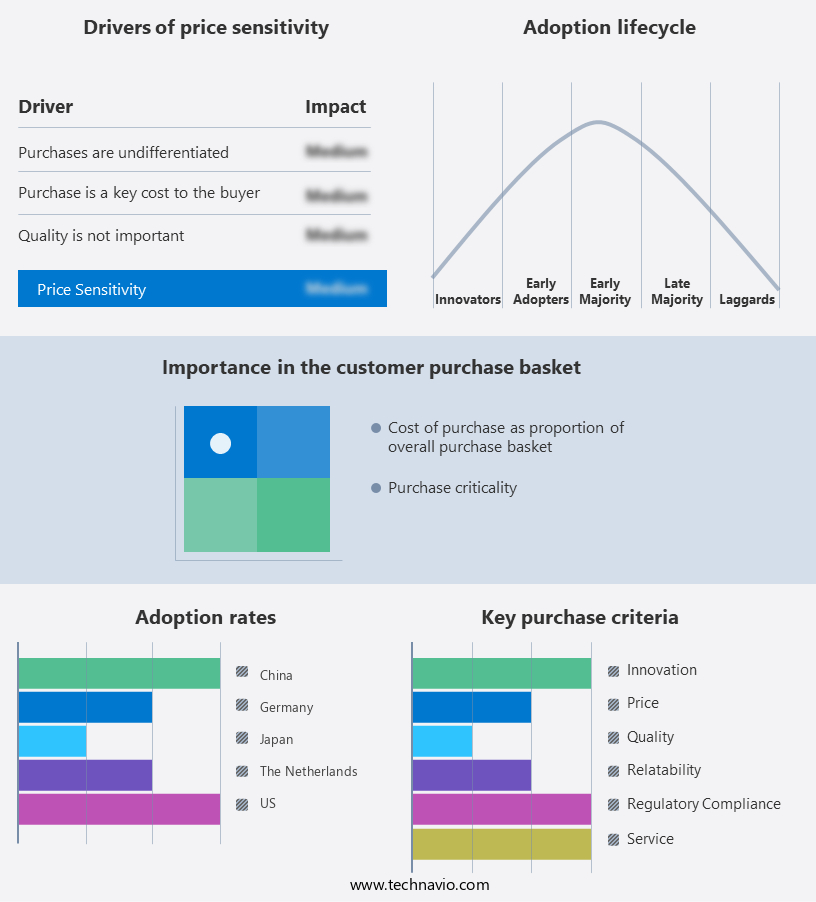
Exclusive Customer Landscape
The barge transportation market forecasting report includes the adoption lifecycle of the market, covering from the innovator’s stage to the laggard’s stage. It focuses on adoption rates in different regions based on penetration. Furthermore, the barge transportation market report also includes key purchase criteria and drivers of price sensitivity to help companies evaluate and develop their market growth analysis strategies.
Customer Landscape
Key Companies & Market Insights
Companies are implementing various strategies, such as strategic alliances, barge transportation market forecast, partnerships, mergers and acquisitions, geographical expansion, and product/service launches, to enhance their presence In the industry.
Alter Logistics Co. - Barge transportation services encompass loading and unloading operations, providing essential logistical solutions for various industries. This sector offers efficient and cost-effective bulk cargo transportation via inland waterways, contributing significantly to the global supply chain. By leveraging advanced equipment and operational expertise, barge transportation services ensure timely and secure movement of commodities, enhancing overall supply chain efficiency.
The industry research and growth report includes detailed analyses of the competitive landscape of the market and information about key companies, including:
- Alter Logistics Co.
- American Commercial Barge Line LLC
- Argosy International Inc.
- Blessey Marine Services Inc.
- Danser Group
- Dubbelman Container Transporten BV
- Ergon Inc.
- Haeger and Schmidt Logistics GmbH
- Heartland Barge Management LLC
- Ingram Marine Group
- Kirby Corp.
- Livingston International Inc.
- Marquette Transportation Co. LLC
- McAllister Towing and Transportation Co. Inc.
- neska Container Line BV
- Poh Tiong Choon Logistics Ltd.
- SEACOR Holdings Inc.
- Singa KBH Industry Sdn Bhd
- The Greenbrier Companies Inc.
- Waalhaven Holding BV
Qualitative and quantitative analysis of companies has been conducted to help clients understand the wider business environment as well as the strengths and weaknesses of key industry players. Data is qualitatively analyzed to categorize companies as pure play, category-focused, industry-focused, and diversified; it is quantitatively analyzed to categorize companies as dominant, leading, strong, tentative, and weak.
Research Analyst Overview
The market encompasses the use of large vessels for moving goods on inland waterways and inland waters. This mode of transportation offers several advantages, including the ability to transport large volumes of cargo over long distances with lower carbon footprints compared to road freight. The market is driven by the need for sustainable and cost-effective logistics solutions, particularly in industries with high transportation requirements, such as construction, agriculture, and manufacturing. Barges come in various types, including flat-bottomed vessels, open barges, covered barges, and tank barges. Each type caters to specific cargo types, such as dry bulk cargo, liquid cargo, and oversized loads.
The dry bulk cargo segment includes minerals, grains, food products, and construction materials, while the liquid cargo segment comprises crude oils, chemicals, and bulk hazardous liquids. The barge transportation industry is undergoing significant changes to become more climate-friendly and sustainable. This includes the use of streamlined designs, water displacement reduction technologies, and the adoption of renewable energy sources for propulsion systems. Additionally, the industry is focusing on reducing carbon emissions by implementing green logistics initiatives, such as zero-emission barges and e-barges. Construction activities and maritime shipping are significant contributors to the market. Construction materials, such as aggregates and cement, are often transported via barges due to their high volume and weight.
Similarly, seaports and river projects rely on barge transportation for the movement of cargo, particularly in areas with shallow-draft vessels or inland waterways. The market faces competitive pressure from other modes of transportation, such as rail, road, and pipelines. Modal shift initiatives are driving the growth of barge transportation as companies seek to reduce their carbon footprints and improve their supply chain logistics. However, weather conditions and navigational channels can pose challenges to barge transportation, particularly during adverse weather events. The barge transportation infrastructure is a critical component of the industry's growth. This includes port infrastructure, intermodal terminals, logistics hubs, and waterway maintenance.
Supportive policies and regulations are essential for the development of the market, particularly in areas with navigable rivers and water bodies. The barge fleet segment includes open barges, covered barges, and tank barges. Open barges are used for transporting dry cargo, while covered barges are used for transporting liquid cargo. Tank barges are specifically designed for transporting bulk hazardous liquids and crude oil. The market for each segment is driven by the demand for specific cargo types and the availability of infrastructure to support their transportation. Security is a significant concern In the market, particularly for cargo transfer and crew mobility.
Unauthorized access, theft, and tampering are potential risks that need to be addressed through robust security measures. The market is expected to grow significantly In the coming years due to its sustainability benefits and cost-effectiveness. The market is also expected to see innovation in barge design, propulsion systems, and eco-friendly solutions. The use of solar panels, finished products, and specialized goods is expected to increase as the industry continues to evolve to meet the changing needs of the global economy.
|
Market Scope |
|
|
Report Coverage |
Details |
|
Page number |
166 |
|
Base year |
2023 |
|
Historic period |
2018-2022 |
|
Forecast period |
2024-2028 |
|
Growth momentum & CAGR |
Accelerate at a CAGR of 5.39% |
|
Market growth 2024-2028 |
USD 38.3 billion |
|
Market structure |
Fragmented |
|
YoY growth 2023-2024(%) |
5.09 |
|
Key countries |
US, China, Japan, The Netherlands, and Germany |
|
Competitive landscape |
Leading Companies, Market Positioning of Companies, Competitive Strategies, and Industry Risks |
What are the Key Data Covered in this Barge Transportation Market Research and Growth Report?
- CAGR of the Barge Transportation industry during the forecast period
- Detailed information on factors that will drive the growth and forecasting between 2024 and 2028
- Precise estimation of the size of the market and its contribution of the industry in focus to the parent market
- Accurate predictions about upcoming growth and trends and changes in consumer behaviour
- Growth of the market across APAC, North America, Europe, South America, and Middle East and Africa
- Thorough analysis of the market’s competitive landscape and detailed information about companies
- Comprehensive analysis of factors that will challenge the barge transportation market growth of industry companies
We can help! Our analysts can customize this barge transportation market research report to meet your requirements.
 RIA -
RIA - 
