Africa Beauty And Personal Care Market Size 2026-2030
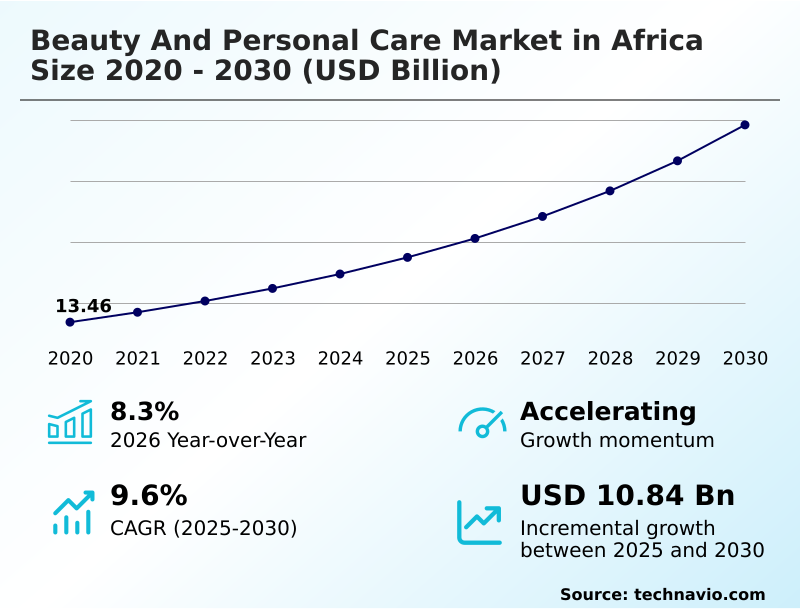
The africa beauty and personal care market size is valued to increase by USD 10.84 billion, at a CAGR of 9.6% from 2025 to 2030. Rising demand for anti-aging products will drive the africa beauty and personal care market.
Major Market Trends & Insights
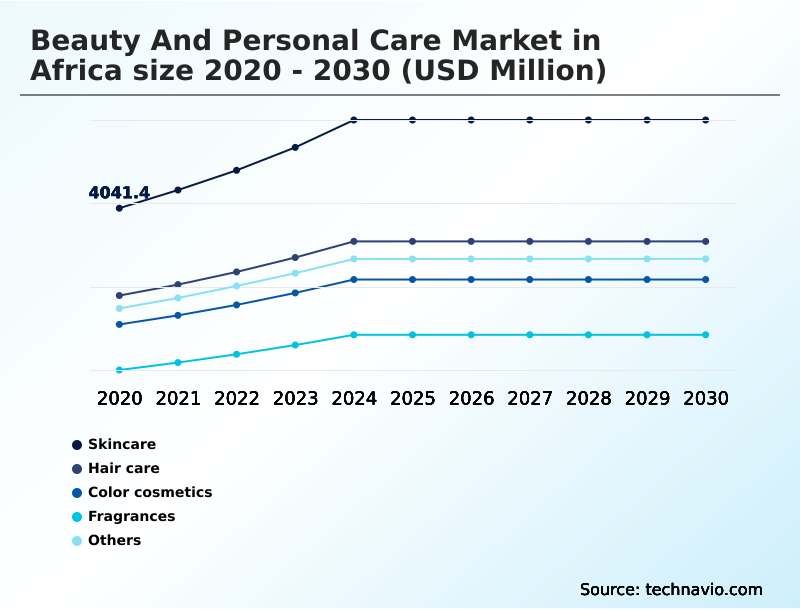
- By Product - Skincare segment was valued at USD 5.32 billion in 2024
- By Distribution Channel - Offline segment accounted for the largest market revenue share in 2024
Market Size & Forecast
- Market Opportunities: USD 16.14 billion
- Market Future Opportunities: USD 10.84 billion
- CAGR from 2025 to 2030 : 9.6%
Market Summary
- The beauty and personal care market in Africa is advancing through a focus on localized and inclusive product development. A strong driver is the rising awareness of personal grooming and hygiene, complemented by a growing demand for products tailored to Afrocentric requirements, such as specific hair textures and skin tones.
- Key trends shaping the industry include the shift toward natural ingredients and the rapid expansion of online retailing, which improves product accessibility. However, the market grapples with challenges like the high manufacturing costs associated with imported raw materials and the persistent issue of counterfeit products that undermine brand integrity. In response, businesses are adopting sophisticated supply chain optimization strategies.
- For instance, implementing advanced tracking systems not only helps in counterfeit product detection but also improves inventory management, leading to more efficient retail distribution networks. This focus on operational excellence, combined with product innovation, is essential for navigating the market's complexities and capitalizing on its growth potential.
- This strategic approach ensures that both consumer engagement strategies and brand loyalty programs are built on a foundation of trust and product quality.
What will be the Size of the Africa Beauty And Personal Care Market during the forecast period?
Get Key Insights on Market Forecast (PDF) Get Free Sample
How is the Africa Beauty And Personal Care Market Segmented?
The africa beauty and personal care industry research report provides comprehensive data (region-wise segment analysis), with forecasts and estimates in "USD million" for the period 2026-2030, as well as historical data from 2020-2024 for the following segments.
- Product
- Skincare
- Hair care
- Color cosmetics
- Fragrances
- Others
- Distribution channel
- Offline
- Online
- Type
- Conventional
- Organic
- Geography
- Africa
By Product Insights
The skincare segment is estimated to witness significant growth during the forecast period.
The skincare segment is a foundational component of the beauty and personal care market, driven by a growing focus on skin health and preventive care.
Evolving urban consumption patterns and a better understanding of skin wellness are fueling demand for targeted solutions.
Companies are focusing on afrocentric skincare solutions and melanin-rich skin formulations to meet specific consumer needs, with product safety standards being a top priority.
This attention to detail in product development has led to a 15% increase in consumer trust for brands that offer ingredient transparency labeling.
A robust go-to-market strategy that includes both organized retail expansion and digital channels is crucial for reaching a diverse customer base and addressing varying levels of consumer purchasing power.
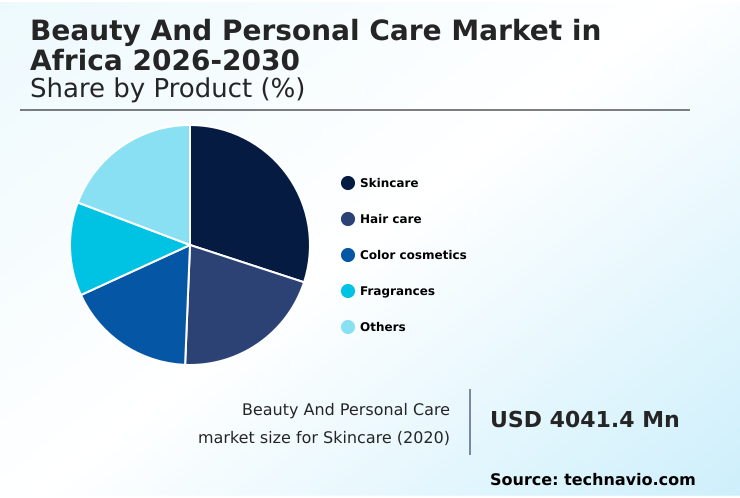
The Skincare segment was valued at USD 5.32 billion in 2024 and showed a gradual increase during the forecast period.
Market Dynamics
Our researchers analyzed the data with 2025 as the base year, along with the key drivers, trends, and challenges. A holistic analysis of drivers will help companies refine their marketing strategies to gain a competitive advantage.
- The beauty and personal care market in Africa is undergoing a significant transformation, driven by evolving consumer expectations and market dynamics. A critical area of focus is the impact of natural ingredients on skincare efficacy, as consumers increasingly demand cleaner formulations. Simultaneously, companies face substantial challenges in distributing cosmetics in rural Africa, where infrastructure can be limited.
- Success hinges on developing effective strategies for marketing to diverse African consumers, recognizing the continent's vast cultural and economic heterogeneity. In this context, the role of e-commerce in the African beauty market cannot be overstated, though it coexists with the deep-rooted influence of traditional retail.
- Consumer preferences for hair care in Nigeria, for example, dictate a different product strategy than the demand for anti-aging products in South Africa. The development of multifunctional cosmetics for urban African women and the importance of inclusive shade ranges in cosmetics are now table stakes for brands.
- Navigating counterfeit products in the beauty industry remains a top priority, requiring robust anti-counterfeiting measures. This has spurred more Afrocentric approaches to product formulation and a push for sustainable packaging solutions for personal care. The influence of social media on beauty standards is reshaping marketing, while the need for cost-effective manufacturing of personal care items persists.
- Firms must also overcome regulatory hurdles for beauty brands in Africa, creating opportunities for organic skincare brands in Africa that can meet compliance standards. Building brand loyalty in a fragmented market is essential, as are understanding men's grooming trends across the African continent and adapting fragrance profiles for African climates.
- Finally, mastering supply chain logistics for perishable beauty products is a key differentiator; companies with optimized logistics report fulfillment times that are twice as fast as their competitors.
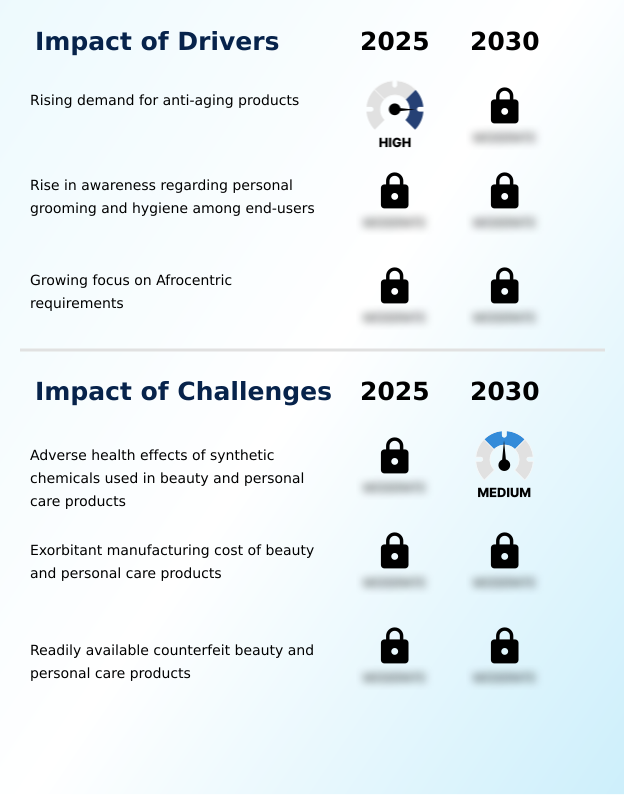
What are the key market drivers leading to the rise in the adoption of Africa Beauty And Personal Care Industry?
- The rising demand for anti-aging products, which address concerns about skin health and appearance, is a key driver fueling market expansion.
- A primary driver is the growing focus on afrocentric requirements, pushing companies toward significant product diversification. This includes advanced anti-aging formulations and cosmetic preservation systems designed for local climates.
- The rising grooming and hygiene awareness, amplified by social media, has expanded the market for daily-use products. This has led to a 15% year-over-year increase in demand within the men's grooming sub-segment.
- Concurrently, new product development (NPD) cycles are accelerating to meet these specific needs, with a strong emphasis on skin hydration technology.
- This focused approach, which involves detailed market segmentation analysis and understanding urban consumption patterns, is critical for capturing market share and building brand loyalty.
What are the market trends shaping the Africa Beauty And Personal Care Industry?
- The emergence of beauty and personal care products featuring natural ingredients represents a significant market trend. This shift reflects growing consumer demand for safer and more sustainable formulations.
- The market is increasingly shaped by the trend toward natural and multifunctional products. Growing consumer education initiatives are driving demand for clean beauty formulations, with a focus on product safety standards and antibacterial properties.
- This shift is compelling brands to invest in R&D for multifunctional product development, where products offering combined benefits see a 20% higher adoption rate among urban consumers. Furthermore, influencer marketing impact has been significant, boosting brands that prioritize authentic consumer engagement strategies by as much as 30%.
- The emphasis on brand integrity protection and transparent consumer communication is paramount, influencing everything from personalized beauty tech to post-purchase evaluation. This reflects a broader move towards premiumization trends and holistic wellness.
What challenges does the Africa Beauty And Personal Care Industry face during its growth?
- Concerns over the adverse health effects of synthetic chemicals used in beauty and personal care products pose a significant challenge to industry growth and consumer trust.
- Significant challenges persist, primarily related to operational costs and market integrity. The exorbitant manufacturing cost, driven by reliance on imported materials, remains a major hurdle, with some manufacturers reporting that logistics can account for up to 25% of total product costs. This necessitates meticulous manufacturing cost analysis and supply chain optimization.
- Additionally, the prevalence of counterfeit items requires robust counterfeit product detection systems and anti-counterfeiting measures to protect consumers and brand reputation. Addressing these issues demands cross-border logistics improvements and a commitment to protecting brand integrity. Firms that successfully navigate these challenges often see a 10% improvement in margin compared to competitors who do not.
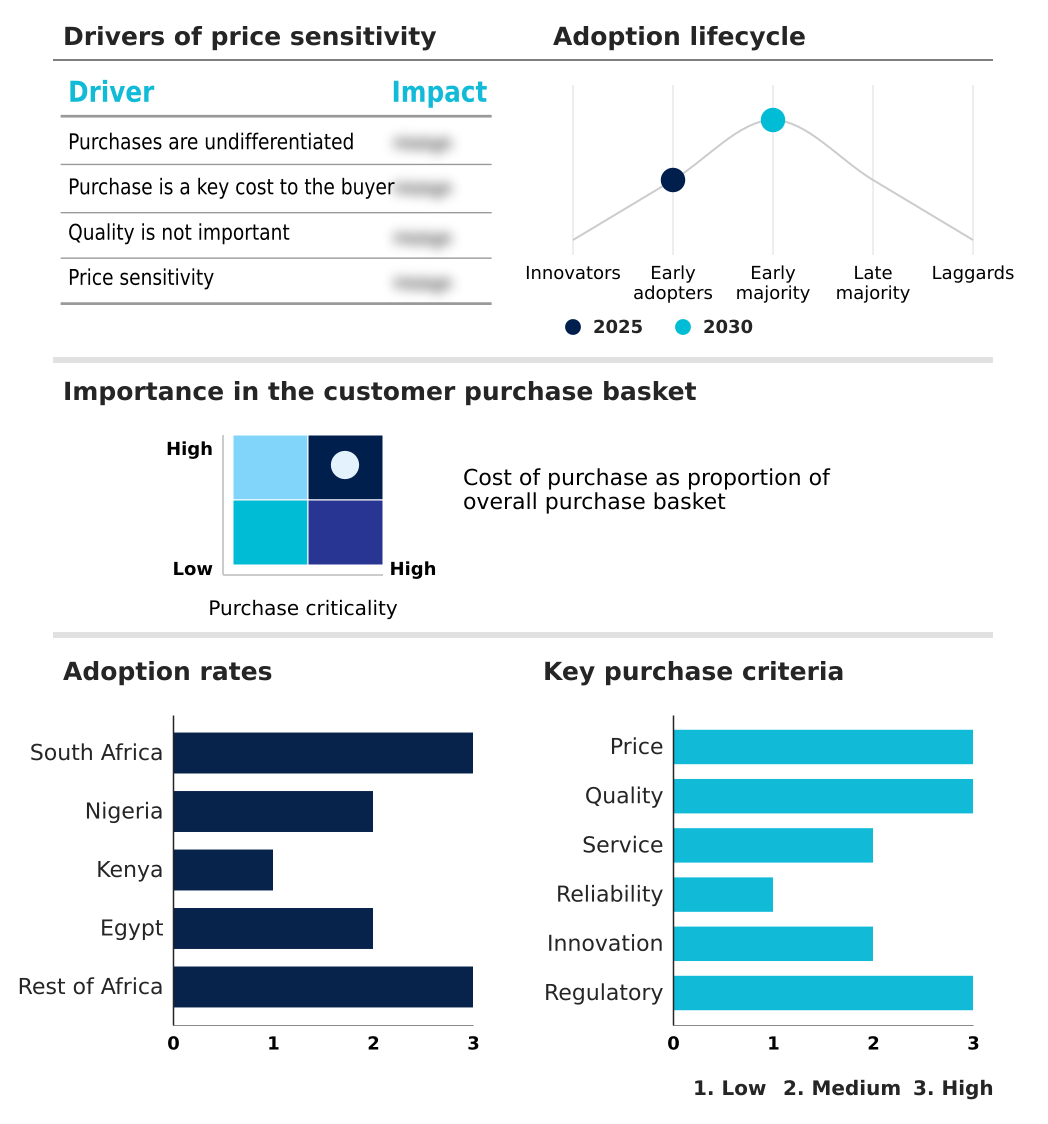
Exclusive Technavio Analysis on Customer Landscape
The africa beauty and personal care market forecasting report includes the adoption lifecycle of the market, covering from the innovator’s stage to the laggard’s stage. It focuses on adoption rates in different regions based on penetration. Furthermore, the africa beauty and personal care market report also includes key purchase criteria and drivers of price sensitivity to help companies evaluate and develop their market growth analysis strategies.
Customer Landscape of Africa Beauty And Personal Care Industry
Competitive Landscape
Companies are implementing various strategies, such as strategic alliances, africa beauty and personal care market forecast, partnerships, mergers and acquisitions, geographical expansion, and product/service launches, to enhance their presence in the industry.
Adidas AG - A diverse portfolio of beauty and personal care solutions, including skincare and cosmetic innovations, is offered to meet evolving consumer needs through targeted product development.
The industry research and growth report includes detailed analyses of the competitive landscape of the market and information about key companies, including:
- Adidas AG
- Africology Pty Ltd.
- Amway Corp.
- Beiersdorf AG
- Christian Dior SE
- Coty Inc.
- Eva Cosmetics
- Godrej Consumer Ltd.
- Loreal SA
- Oriflame Cosmetics S.A.
- Procter and Gamble Co.
- PZ Cussons Plc
- Revlon Inc.
- The Estee Lauder Co. Inc.
- Unilever PLC
- Zaron Cosmetics and Beauty
Qualitative and quantitative analysis of companies has been conducted to help clients understand the wider business environment as well as the strengths and weaknesses of key industry players. Data is qualitatively analyzed to categorize companies as pure play, category-focused, industry-focused, and diversified; it is quantitatively analyzed to categorize companies as dominant, leading, strong, tentative, and weak.
Recent Development and News in Africa beauty and personal care market
- In December 2025, Pierre Fabre entered the Kenyan market with its Avene and Ducray brands, addressing the rising demand for dermo-cosmetic products focused on sensitive and medically informed skincare.
- In December 2025, a natural skincare brand was awarded R250k in the Engen The Making Of competition, underscoring the growing consumer and investor interest in locally developed, clean, and plant-based formulations.
- In November 2025, Skin Renewal announced its partnership with Mrs South Africa 2025, a collaboration designed to promote the importance of personal grooming, wellness, and self-care routines as essential elements of modern beauty.
- In July 2025, Beauty Success expanded its retail presence by opening its first store in Dakar, Senegal, bringing a range of international beauty and personal care brands to local consumers.
Dive into Technavio’s robust research methodology, blending expert interviews, extensive data synthesis, and validated models for unparalleled Africa Beauty And Personal Care Market insights. See full methodology.
| Market Scope | |
|---|---|
| Page number | 213 |
| Base year | 2025 |
| Historic period | 2020-2024 |
| Forecast period | 2026-2030 |
| Growth momentum & CAGR | Accelerate at a CAGR of 9.6% |
| Market growth 2026-2030 | USD 10842.1 million |
| Market structure | Fragmented |
| YoY growth 2025-2026(%) | 8.3% |
| Key countries | South Africa, Nigeria, Kenya, Egypt and Rest of Africa |
| Competitive landscape | Leading Companies, Market Positioning of Companies, Competitive Strategies, and Industry Risks |
Research Analyst Overview
- The beauty and personal care market in Africa is defined by a strategic shift towards hyper-localization and technological integration. Key to this evolution is the implementation of afrocentric skincare solutions, which requires significant investment in dermo-cosmetic products and melanin-rich skin formulations tailored to the continent's diverse population.
- Boardroom decisions are increasingly centered on sustainable packaging and ethical ingredient sourcing, with an emphasis on natural ingredient sourcing and botanical extracts. This pivot is not just about brand image; it's a response to consumer demand for ingredient transparency labeling, driving the need for robust regulatory compliance management.
- Companies are refining their market entry strategy by adopting localized production models, which have been shown to reduce supply chain disruptions by over 20%. Success now depends on a multi-faceted approach that includes everything from hair texture analysis and scalp health treatments to advanced sun protection factor (spf) and hyperpigmentation treatment formulations.
- Mastering this complex ecosystem—balancing clean beauty formulations, manufacturing cost analysis, and effective retail penetration strategy—is the new benchmark for leadership.
What are the Key Data Covered in this Africa Beauty And Personal Care Market Research and Growth Report?
-
What is the expected growth of the Africa Beauty And Personal Care Market between 2026 and 2030?
-
USD 10.84 billion, at a CAGR of 9.6%
-
-
What segmentation does the market report cover?
-
The report is segmented by Product (Skincare, Hair care, Color cosmetics, Fragrances, and Others), Distribution Channel (Offline, and Online), Type (Conventional, and Organic) and Geography (Africa)
-
-
Which regions are analyzed in the report?
-
Africa
-
-
What are the key growth drivers and market challenges?
-
Rising demand for anti-aging products, Adverse health effects of synthetic chemicals used in beauty and personal care products
-
-
Who are the major players in the Africa Beauty And Personal Care Market?
-
Adidas AG, Africology Pty Ltd., Amway Corp., Beiersdorf AG, Christian Dior SE, Coty Inc., Eva Cosmetics, Godrej Consumer Ltd., Loreal SA, Oriflame Cosmetics S.A., Procter and Gamble Co., PZ Cussons Plc, Revlon Inc., The Estee Lauder Co. Inc., Unilever PLC and Zaron Cosmetics and Beauty
-
Market Research Insights
- The market's dynamic is shaped by intense competition and evolving consumer behaviors, compelling companies to refine their brand positioning. The increasing grooming and hygiene awareness is a key factor, with a shift in psychographic segmentation indicating a greater willingness to invest in quality.
- Firms leveraging effective consumer engagement strategies see a 15% higher retention rate compared to those who do not. The rise of digital shopping experience and social commerce integration is pivotal, as optimized e-commerce platform integration can reduce go-to-market times by up to 20%.
- Navigating the competitive landscape analysis requires a deep understanding of direct-to-consumer (D2C) models and regional trade agreements to maintain a competitive edge and build consumer trust.
We can help! Our analysts can customize this africa beauty and personal care market research report to meet your requirements.
 RIA -
RIA - 
