Biochar Machine Market Size 2024-2028
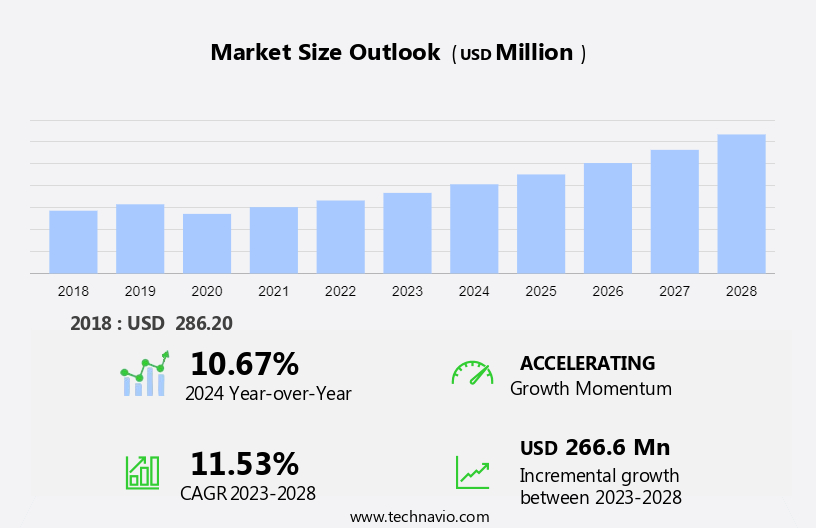
The biochar machine market size is forecast to increase by USD 266.6 million at a CAGR of 11.53% between 2023 and 2028.
- The biochar machine market is experiencing significant growth due to the increasing demand for biochar in agriculture as a soil amendment. This trend is driven by the environmental benefits of using climate-friendly biochar plants, which reduce greenhouse gas emissions during the production process. However, the market faces challenges, including a lack of awareness and adoption for biochar. This is partly due to the complex production process, which involves the conversion of biomass into biochar through methods such as gasification or pyrolysis in a pyrolysis reactor. The resulting syngas or pyrolysis oil can be utilized as energy sources, making these processes even more economically viable.
- Furthermore, companies like Airex Energy and Stine Seed Farms are leading the way In the biochar industry, offering innovative solutions and contributing to the market's growth. In the e-commerce sector, there is a growing trend towards the online sale of biochar products, making them more accessible to a wider audience. To stay competitive in this market, it is essential for businesses to focus on increasing awareness and education about the benefits of biochar, while also investing in research and development to improve production processes and reduce costs.
What will be the Size of the Biochar Machine Market During the Forecast Period?
- The biochar machine market is witnessing significant growth driven by various factors. This organic carbon-rich material, derived from the thermal decomposition of agricultural waste, wood waste, forest waste, animal dung, and other organic matter In the absence of oxygen, has gained traction due to its diverse applications. Biochar's primary use lies in agricultural soil amendment. Its porous structure enhances water retention, improves soil structure, and provides a surface for beneficial microbes to thrive. These properties lead to increased crop yields and improved soil health. Biochar is increasingly being used as a fuel for daily heating and cooking applications. Its low moisture content, high calorific value, and low emissions make it an attractive alternative to traditional fuels. The cost of biochar production varies depending on the feedstock used and the production method. While the initial investment for setting up a biochar plant can be high, the operational costs are relatively low due to the use of abundant and often free feedstocks. Government initiatives and regulations play a crucial role in the biochar machine market.
- Moreover, policies promoting renewable energy and sustainable agriculture can create opportunities for biochar machine market growth. Growing environmental awareness and the need for sustainable practices are driving the demand for biochar. Consumers are increasingly looking for eco-friendly alternatives to conventional fertilizers and fuels. In addition to agricultural applications, biochar is also used as a soil amendment in horticulture and landscaping. Its ability to improve soil structure and water retention makes it an attractive option for these industries. The availability of agricultural waste as a feedstock is a significant factor driving the biochar machine market. Farmers and agro-industries generate large quantities of waste, which can be converted into biochar, reducing disposal costs and providing a valuable byproduct. Biochar production offers a solution to the issue of waste management.
- By converting organic waste into biochar, we can reduce the amount of waste sent to landfills and create a valuable resource. Biochar has potential applications In the construction industry as a building material. Its high porosity and thermal insulation properties make it an attractive alternative to conventional building materials. Biochar is also being explored as a replacement for activated carbon in electronics due to its high surface area and electrical conductivity. As consumers become more environmentally conscious, the demand for sustainable products is increasing. Biochar, with its eco-friendly production and diverse applications, is poised to benefit from this trend.
- Thus, the biochar machine market is driven by various factors, including its agricultural applications, daily heating and cooking uses, and its potential as a building material, fabric additive, and electronics component. The availability of abundant feedstocks, government initiatives, and growing environmental awareness are also significant factors contributing to its growth.
How is this Biochar Machine Industry segmented and which is the largest segment?
The biochar machine industry research report provides comprehensive data (region-wise segment analysis), with forecasts and estimates in "USD million" for the period 2024-2028, as well as historical data from 2018-2022 for the following segments.
- Feedstock
- Agricultural residue
- Wood chips
- Slurry
- Manure
- Sawdust
- Type
- Batch reactors
- Continuous reactors
- Portable reactors
- Fluidized bed reactors
- Geography
- North America
- Canada
- US
- Europe
- Germany
- UK
- APAC
- China
- South America
- Middle East and Africa
- North America
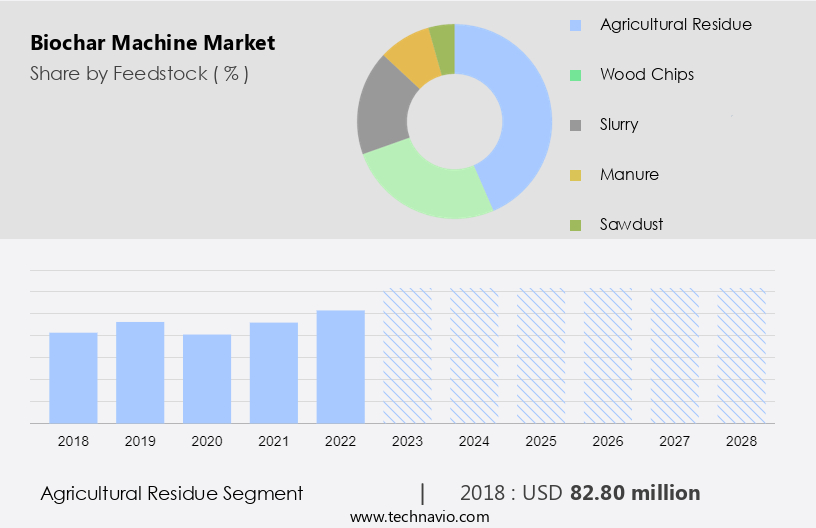
By Feedstock Insights
- The agricultural residue segment is estimated to witness significant growth during the forecast period.
The biochar machine market is witnessing significant growth due to the increasing utilization of agricultural residues as feedstocks. These residues, such as corn stover, wheat straw, rice husks, nut shells, fruit pits, prunings from orchards, and vineyards, are abundantly available globally and can be sourced locally, reducing transportation costs. The conversion of agricultural residues into biochar offers a productive alternative to burning or leaving them in fields. companies are increasingly favoring the use of agricultural residues for biochar production due to their vast availability and the retention of essential nutrients In the resulting biochar, making it an effective soil amendment. The scalability of biochar production from agricultural residues is another factor driving market growth.
Furthermore, this inorganic material is gaining popularity as a sustainable solution for carbon sequestration and improving soil fertility in agriculture. The depth of product offerings In the biochar machine market is expanding as companies explore various feedstocks and applications, ensuring continued growth In the sector. From a business perspective, the use of agricultural waste for biochar production presents a lucrative opportunity for companies looking to reduce their carbon footprint while contributing to sustainable agricultural practices.
Get a glance at the Biochar Machine Industry report of share of various segments Request Free Sample
The agricultural residue segment was valued at USD 82.80 million in 2018 and showed a gradual increase during the forecast period.
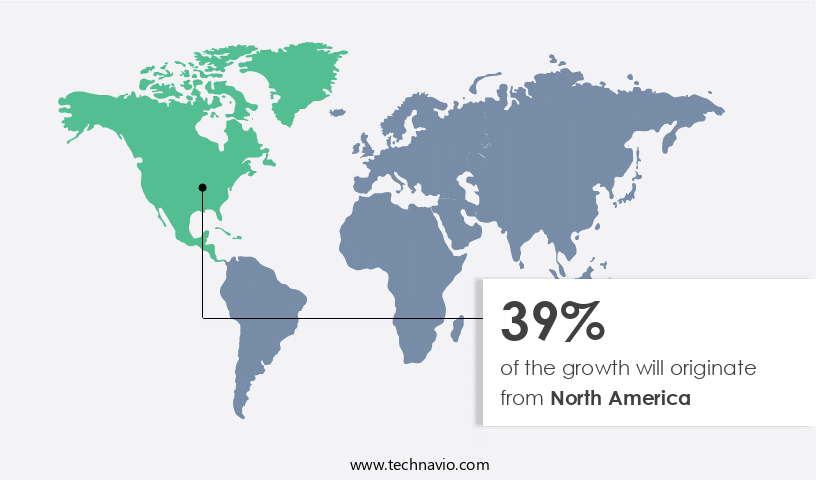
Regional Analysis
- North America is estimated to contribute 39% to the growth of the global market during the forecast period.
Technavio's analysts have elaborately explained the regional trends and drivers that shape the market during the forecast period.
For more insights on the market share of various regions, Request Free Sample
The biochar machine market in North America is poised for substantial expansion during the forecast period. The primary reason for this growth is the heightened demand for biochar in agriculture, particularly in Animal farming and Livestock farming segments such as Cattle farming and Poultry farming. Biochar's ability to enhance soil health and productivity, even when used in small quantities, makes it a superior alternative to traditional fertilizers.
Moreover, the increasing number of production facilities, the expanding utilization of biochar in sectors like power generation, and the vast availability of agricultural and forestry waste are significant factors fueling market growth In the US. The rising consumer consciousness towards health and sustainability is also driving the demand for organic farming, further boosting the market. Biochar's environmental benefits, such as carbon sequestration and reduced greenhouse gas emissions, also make it an attractive proposition In the Carbon market. The biochar machine market in North America is expected to experience steady growth due to these factors.
Market Dynamics
Our researchers analyzed the data with 2023 as the base year, along with the key drivers, trends, and challenges. A holistic analysis of drivers will help companies refine their marketing strategies to gain a competitive advantage.
What are the key market drivers leading to the rise In the adoption of Biochar Machine Industry?
An increasing demand for biochar in agriculture is the key driver of the market.
- The market encompasses the production and application of biochar, an inorganic carbon-rich material derived from agricultural and forest waste, animal dung, and other biomass sources. This machine plays a pivotal role in soil amendment, enhancing agricultural fertility by improving water retention and nutrient availability. Daily heating applications include cooking and baking, while the product's scalability extends to various industries such as textiles (as a fabric additive), construction (as a building material), electronics, and heat power generation in the carbon market. Political factors, environmental awareness, and the agricultural industry's winning imperatives have fueled the global market growth.
- Further, farmers worldwide employ biochar reactors to convert stubble, biomass, grass, wood chips, cow manure, rice husk, and cassava rhizome into valuable biochar. In agriculture, biochar benefits animal farming, livestock farming, and cattle farming by improving soil fertility and reducing greenhouse gas emissions. Additionally, biochar's potential in heat power generation and the carbon market presents significant opportunities. Thus, such factors are driving the growth of the market during the forecast period.
What are the market trends shaping the Biochar Machine Industry?
Climate-friendly biochar plants is the upcoming market trend.
- The market encompasses the production and application of biochar, an inorganic carbon-rich material derived from the thermal decomposition of agricultural waste, wood waste, forest waste, animal dung, and other biomass sources. This product finds extensive use in various sectors, including agricultural fertilizer, daily heating, and cooking applications. The pricing of biochar machines varies based on their size, capacity, and features. Political factors, such as environmental awareness and government initiatives, have significantly influenced the winning imperatives of the global biochar market. The breadth and depth of the product's applications extend to soil amendment, fabric additive, building material, electronics, and heat power generation in the agricultural industry.
- Moreover, farmers employ biochar to improve soil fertility, while animal farming, livestock farming, and cattle farming utilize it as a nutrient-rich feed additive. Biochar production can be scaled up using various feedstocks, such as grass, wood chips, cow manure, rice husks, and cassava rhizomes. The reactor technology used in biochar machines determines the quality and yield of the final product. In addition, the carbon market provides an incentive for the production and utilization of biochar as a carbon sink. Biochar's versatility and potential benefits make it a valuable commodity in various industries. Thus, such trends will shape the growth of the market during the forecast period.
What challenges does the Biochar Machine Industry face during its growth?
Lack of awareness and adoption for biochar is a key challenge affecting the industry growth.
- The market encompasses the production and application of biochar, an inorganic carbon-rich material derived from agricultural and forest waste, animal dung, wood waste, and other biomass sources. This machine plays a pivotal role in the agricultural industry by transforming daily heating and cooking applications into sustainable practices. Product pricing is influenced by several factors, including political conditions, winning imperatives, and the breadth and depth of product offerings. Biochar serves as an effective soil amendment, enhancing soil fertility in agriculture and improving crop yields. In addition, it has applications in animal farming, livestock farming, and cattle farming as a feed additive.
- Furthermore, it can be used as a fabric additive, building material, and even in electronics. The global market is driven by environmental awareness and the potential for heat power generation and carbon market participation. Biochar production can be scaled from small-scale reactors using agricultural stubble, biomass, grass, and wood chips to large-scale industrial processes using rice husk, cassava rhizome, and cow manure. The versatility of biochar and its potential benefits make it an essential component in various industries, ensuring its continued growth and relevance. Hence, the above factors will impede the growth of the market during the forecast period
Exclusive Customer Landscape
The biochar machine market forecasting report includes the adoption lifecycle of the market, market growth and forecasting, covering from the innovator's stage to the laggard's stage. It focuses on adoption rates in different regions based on penetration. Furthermore, the biochar machine market report also includes key purchase criteria and drivers of price sensitivity to help companies evaluate and develop their market growth analysis strategies.

Customer Landscape
Key Companies & Market Insights
Companies are implementing various strategies, such as strategic alliances, biochar machine market forecast, partnerships, mergers and acquisitions, geographical expansion, and product/service launches, to enhance their presence In the industry. The industry research and growth report includes detailed analyses of the competitive landscape of the market and information about key companies, including:
- AGICO Cement International Engineering Co., Ltd.
- Agile Process Chemicals LLP.
- ARTi
- BESTON GROUP CO., LTD.
- Biochar Solutions Inc.
- Bioforcetech Corp.
- Durga Technology Corp.
- FEECO International Inc.
- Goenvi Technologies Pvt Ltd.
- GreenPower
- Henan Sunrishe Biochar Machine Co. Ltd.
- Kerone Engineering Solutions LTD.,
- Kingtiger Shanghai Environmental Technology Co., Ltd.
- Klean Industries Inc.
- MashMakes inc.
- PYREG GmbH
- Pyrotech Energy Pty Ltd
- RMS Roller Grinder
- WasteX Pte. Ltd.
- West Salem Machinery
Qualitative and quantitative analysis of companies has been conducted to help clients understand the wider business environment as well as the strengths and weaknesses of key industry players. Data is qualitatively analyzed to categorize companies as pure play, category-focused, industry-focused, and diversified; it is quantitatively analyzed to categorize companies as dominant, leading, strong, tentative, and weak.
Research Analyst Overview
The global biochar machine market is witnessing significant growth due to the increasing demand for agricultural fertilizers and daily heating applications. Biochar, an inorganic carbon-rich material obtained from the thermal decomposition of agricultural waste, wood waste, forest waste, animal dung, and other biomass, is gaining popularity as a soil amendment. The product's ability to improve soil fertility and enhance agricultural productivity is driving its adoption In the agricultural industry. Biochar machines are used to produce biochar from various feedstocks, including stubble, biomass, and agricultural waste. These machines use pyrolysis or gasification processes to convert the feedstock into biochar. The breadth and depth of product offerings In the market cater to various industries, including agriculture, animal farming, and livestock farming.
Further, the scalability of biochar machines makes them suitable for small-scale farmers as well as large-scale industrial applications. Political factors, such as environmental awareness and carbon market incentives, are also contributing to the growth of the market. Biochar is finding applications in cooking applications, building materials, fabric additives, and even electronics. The market is witnessing innovation In the form of e-commerce platforms, making it easier for farmers to purchase biochar machines and feedstock. Product pricing remains a crucial factor In the market's growth, with companies focusing on winning imperatives through competitive pricing and value-added services. Pyrolysis reactors, syngas, and pyrolysis oil are some of the key components of the biochar production process. Companies such as Airex Energy and Frontline Bioenergy are leading the market with their advanced technologies and comprehensive product offerings.
|
Market Scope |
|
|
Report Coverage |
Details |
|
Page number |
200 |
|
Base year |
2023 |
|
Historic period |
2018-2022 |
|
Forecast period |
2024-2028 |
|
Growth momentum & CAGR |
Accelerate at a CAGR of 11.53% |
|
Market growth 2024-2028 |
USD 266.6 million |
|
Market structure |
Fragmented |
|
YoY growth 2023-2024(%) |
10.67 |
|
Key countries |
US, Canada, Germany, UK, China, and Australia |
|
Competitive landscape |
Leading Companies, Market Positioning of Companies, Competitive Strategies, and Industry Risks |
What are the Key Data Covered in this Biochar Machine Market Research and Growth Report?
- CAGR of the Biochar Machine industry during the forecast period
- Detailed information on factors that will drive the growth and forecasting between 2024 and 2028
- Precise estimation of the size of the market and its contribution of the industry in focus to the parent market
- Accurate predictions about upcoming growth and trends and changes in consumer behaviour
- Growth of the market across North America, Europe, APAC, South America, and Middle East and Africa
- Thorough analysis of the market's competitive landscape and detailed information about companies
- Comprehensive analysis of factors that will challenge the biochar machine market growth of industry companies
We can help! Our analysts can customize this biochar machine market research report to meet your requirements.
 RIA -
RIA - 
